Cusseta, Georgia (GA) Poverty Rate Data
Information about poor and low-income residents

Recent posts about poverty in Cusseta, Georgia on our local forum with over 2,400,000 registered users:
 | Midland Commons (628 replies) |
| 19-year-old proposes adding a major interstate in Columbus. Councilors support the idea. (87 replies) |
| Metro Road Construction Update (18 replies) |
| 84-New Apartments Coming To Blighted Area Of South Columbus (5 replies) |
| Instacart coming to Columbus! (28 replies) |
| Muscogee County declared as an Opportunity Zone (0 replies) |
Latest news about poverty in Cusseta, GA collected exclusively by city-data.com from local newspapers, TV, and radio stations
43.1% of Cusseta, GA residents had an income below the poverty level in 2022, which was 70.6% greater than the poverty level of 12.7% across the entire state of Georgia. Taking into account residents not living in families, 31.7% of high school graduates and 50.0% of non high school graduates live in poverty. The poverty rate was 31.7% among disabled males and 31.3% among disabled females. The renting rate among poor residents was 61.9%. For comparison, it was 36.0% among residents with income above the poverty level.
Poverty rates in Cusseta, GA
Residents with income below the poverty level in 2022:
Residents with income below 50% of the poverty level in 2022:
Poverty rate among disabled males:
Poverty rate among disabled females:
Renting rate in this city among poor and not poor residents:
| Cusseta: | 43.1% |
| Whole state: | 12.7% |
| Cusseta: | 18.3% |
| Whole state: | 6.4% |
Poverty rate among disabled males:
| Cusseta: | 31.7% |
| Georgia: | 15.4% |
Disability rate in this city among poor males (it is 27.6% among male residents who are not classified as poor):
| Cusseta: | 39.2% |
| Georgia: | 28.0% |
Poverty rate among disabled females:
| Cusseta: | 31.3% |
| Georgia: | 21.4% |
Disability rate in this city among poor females (it is 24.5% among female residents who are not classified as poor):
| Cusseta: | 29.3% |
| Georgia: | 29.6% |
Renting rate in this city among poor and not poor residents:
| Residents below poverty level: | 61.9% |
| Residents above poverty level: | 36.0% |
Poverty by age in Cusseta, GA
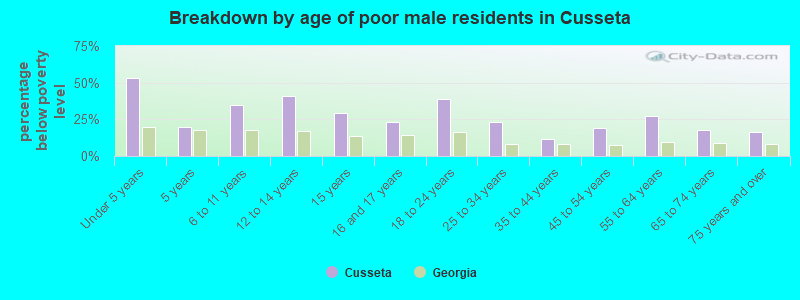
- Breakdown by age of poor male residents in Cusseta,GA (percentage below poverty level)
- 53.3%Under 5 years
- 20.0%5 years
- 34.8%6 to 11 years
- 40.7%12 to 14 years
- 29.4%15 years
- 23.1%16 and 17 years
- 38.7%18 to 24 years
- 23.3%25 to 34 years
- 11.4%35 to 44 years
- 19.0%45 to 54 years
- 27.4%55 to 64 years
- 17.7%65 to 74 years
- 16.1%75 years and over
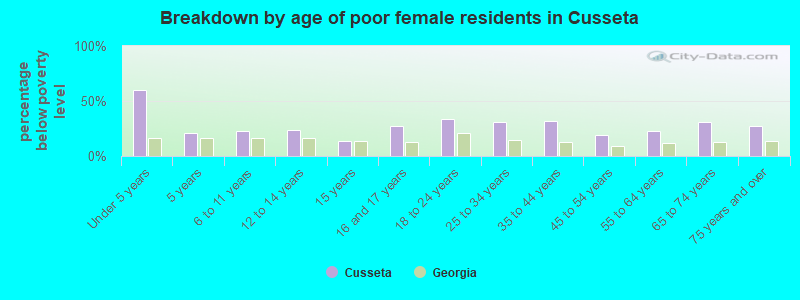
- Breakdown by age of poor female residents in Cusseta,GA (percentage below poverty level)
- 60.4%Under 5 years
- 21.1%5 years
- 22.5%6 to 11 years
- 24.1%12 to 14 years
- 13.3%15 years
- 27.3%16 and 17 years
- 33.7%18 to 24 years
- 30.9%25 to 34 years
- 32.1%35 to 44 years
- 19.5%45 to 54 years
- 22.7%55 to 64 years
- 31.2%65 to 74 years
- 27.3%75 years and over
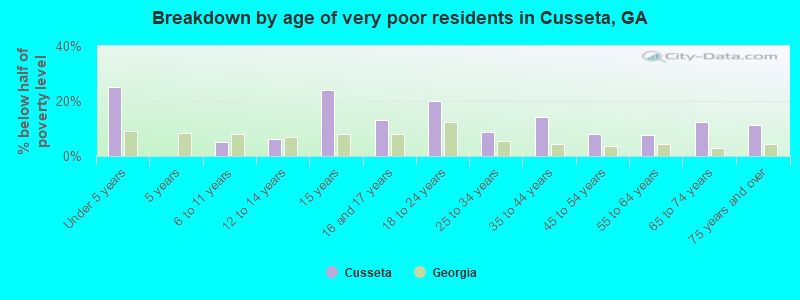
- Breakdown by age of very poor residents in Cusseta,GA (% below half of poverty level)
- 25.2%Under 5 years
- 0.0%5 years
- 5.1%6 to 11 years
- 6.2%12 to 14 years
- 24.0%15 years
- 13.2%16 and 17 years
- 20.0%18 to 24 years
- 8.7%25 to 34 years
- 14.1%35 to 44 years
- 7.9%45 to 54 years
- 7.5%55 to 64 years
- 12.5%65 to 74 years
- 11.4%75 years and over
Poverty by race and place of birth in Cusseta, GA
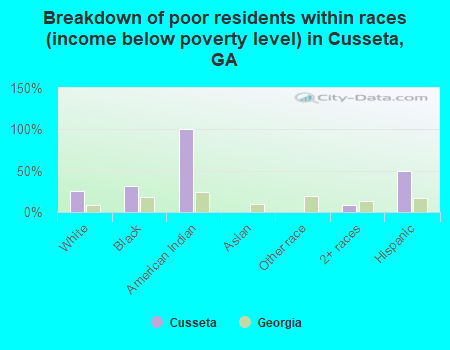
- Breakdown of poor residents within races in Cusseta, GA (%)
- 25.0%White
- 32.0%Black
- 100.0%American Indian
- 0.0%Asian
- 0.0%Other race
- 9.0%2+ races
- 49.0%Hispanic
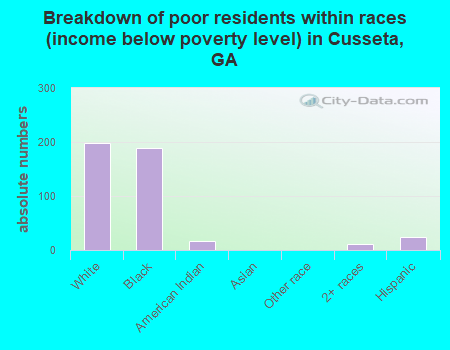
- Breakdown of poor residents within races in Cusseta, GA (absolute numbers)
- 199White
- 189Black
- 17American Indian
- 0Asian
- 0Other race
- 122+ races
- 24Hispanic
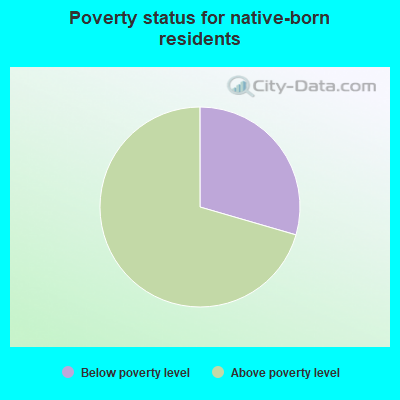
- 29.5%Below poverty level
- 70.5%Above poverty level
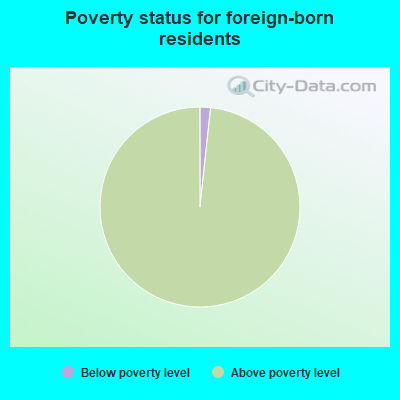
- 1.7%Below poverty level
- 98.3%Above poverty level
Poverty in families in Cusseta, GA
Children below poverty level:
| Cusseta, Georgia: | 36.6% |
| State: | 16.3% |
Poverty rate among high school graduates not in families:
| Cusseta: | 31.7% |
| Georgia: | 17.6% |
Poverty rate among people who did not graduate high school not in families:
| Cusseta: | 50.0% |
| Georgia: | 44.8% |
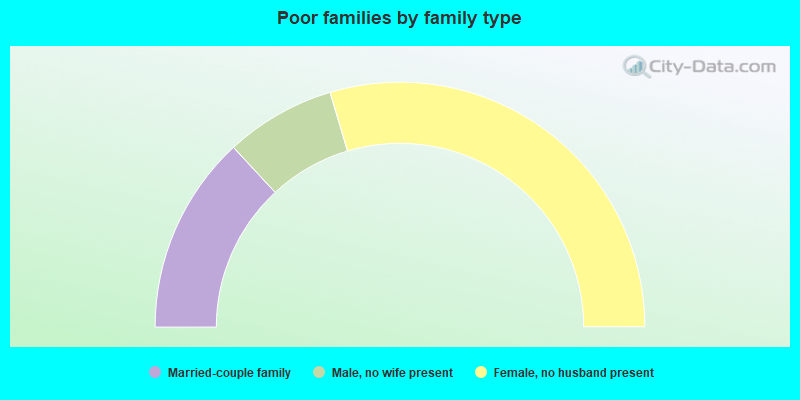
- 26.2%Married-couple family
- 14.6%Male, no wife present
- 59.2%Female, no husband present
Other data
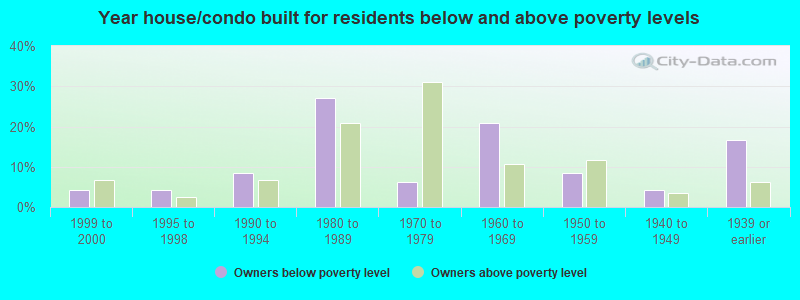
- Owners below poverty level
- 4.2%1999 to 2000
- 4.2%1995 to 1998
- 8.3%1990 to 1994
- 27.1%1980 to 1989
- 6.2%1970 to 1979
- 20.8%1960 to 1969
- 8.3%1950 to 1959
- 4.2%1940 to 1949
- 16.7%1939 or earlier
- Owners above poverty level
- 6.8%1999 to 2000
- 2.4%1995 to 1998
- 6.8%1990 to 1994
- 20.9%1980 to 1989
- 31.1%1970 to 1979
- 10.7%1960 to 1969
- 11.7%1950 to 1959
- 3.4%1940 to 1949
- 6.3%1939 or earlier