Dixon, Iowa (IA) Poverty Rate Data
Information about poor and low-income residents
Settings
X


Recent posts about poverty in Dixon, Iowa on our local forum with over 2,400,000 registered users:
 | Southern influence in IA (58 replies) |
| Johnson County plans to vote on "travel ban" to Indiana. (9 replies) |
| Race In Des Moines (60 replies) |
| Quiet place to rent in DeWitt or Scott County? (3 replies) |
| How is downtown Dubuque? Restaurants? (4 replies) |
| Contemplating move to IA from CA (7 replies) |
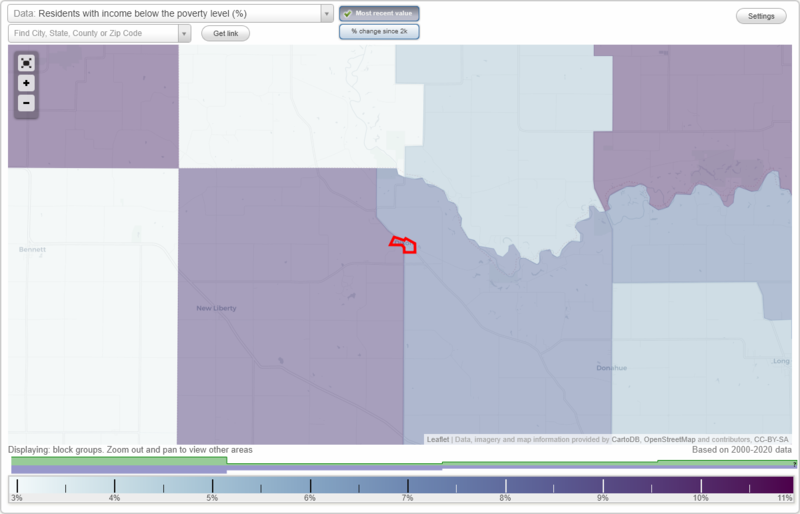
0.9% of Dixon, IA residents had an income below the poverty level in 2022, which was 1142.9% less than the poverty level of 11.0% across the entire state of Iowa.
Poverty rates in Dixon, IA
Residents with income below the poverty level in 2022:
| Dixon: | 0.9% |
| Whole state: | 11.0% |
Poverty by age in Dixon, IA
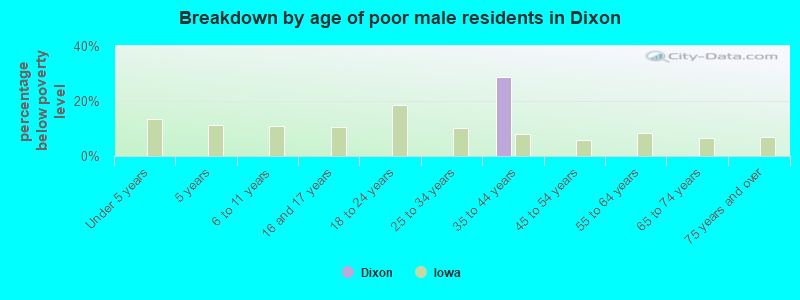
- Breakdown by age of poor male residents in Dixon,IA (percentage below poverty level)
- 0.0%Under 5 years
- 0.0%5 years
- 0.0%6 to 11 years
- 0.0%16 and 17 years
- 0.0%18 to 24 years
- 0.0%25 to 34 years
- 28.6%35 to 44 years
- 0.0%45 to 54 years
- 0.0%55 to 64 years
- 0.0%65 to 74 years
- 0.0%75 years and over
Poverty by race and place of birth in Dixon, IA
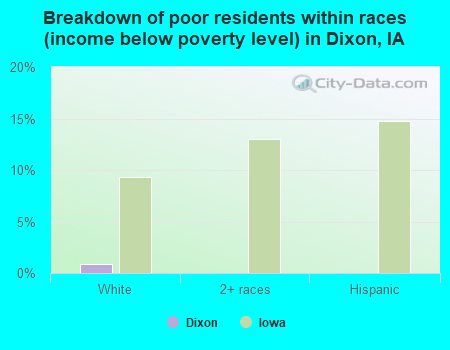
- Breakdown of poor residents within races in Dixon, IA (%)
- 0.9%White
- 0.0%2+ races
- 0.0%Hispanic
- Breakdown of poor residents within races in Dixon, IA (absolute numbers)
- 2White
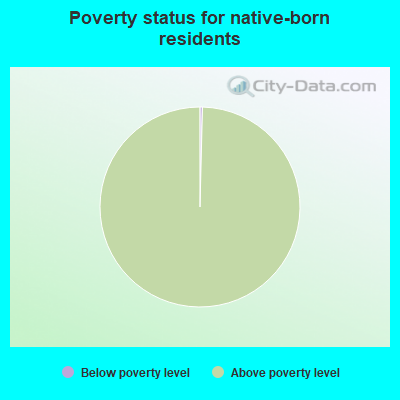
- 0.4%Below poverty level
- 99.6%Above poverty level
Poverty in families in Dixon, IA
Poverty rate among high school graduates:
| Dixon: | 1.4% |
| Iowa: | 7.9% |
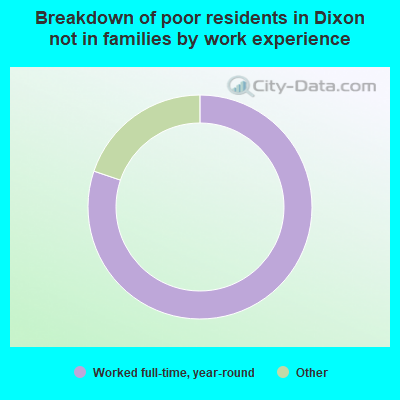
- 100.0%Worked full-time, year-round
- 0.0%Worked part-time
- 0.0%Did not work
Other data
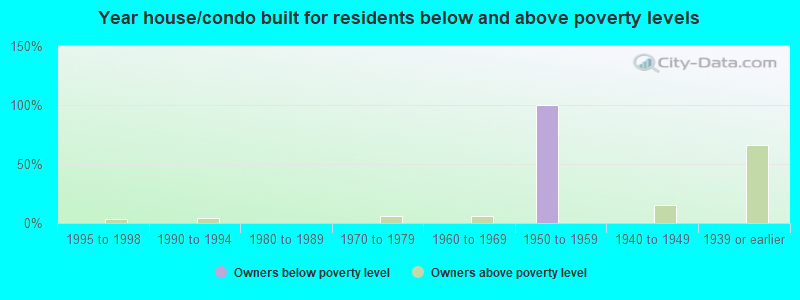
- Owners below poverty level
- 0.0%1999 to 2000
- 0.0%1995 to 1998
- 0.0%1990 to 1994
- 0.0%1980 to 1989
- 0.0%1970 to 1979
- 0.0%1960 to 1969
- 100.0%1950 to 1959
- 0.0%1940 to 1949
- 0.0%1939 or earlier
- Owners above poverty level
- 0.0%1999 to 2000
- 2.8%1995 to 1998
- 4.2%1990 to 1994
- 0.0%1980 to 1989
- 5.6%1970 to 1979
- 5.6%1960 to 1969
- 0.0%1950 to 1959
- 15.5%1940 to 1949
- 66.2%1939 or earlier