Harwinton, Connecticut (CT) Poverty Rate Data
Information about poor and low-income residents

Recent posts about poverty in Harwinton, Connecticut on our local forum with over 2,400,000 registered users:
 | Connecticut TOWN TOURNAMENT V (2022) (831 replies) |
| Connecticut's Republican Party - Will it change with the times? (1046 replies) |
| Recommendations for small(ish) towns that might come close to this? (33 replies) |
| Please help! Is Connecticut for us? (110 replies) |
| Working in Farmington, looking for a good small town/city near the water (32 replies) |
| Economic Climate in CT (18750 replies) |
2.7% of Harwinton, CT residents had an income below the poverty level in 2022, which was 263.7% less than the poverty level of 9.8% across the entire state of Connecticut. Taking into account residents not living in families, 10.5% of high school graduates and 51.8% of non high school graduates live in poverty. The poverty rate was 0.0% among disabled males and 7.3% among disabled females. The renting rate among poor residents was 9.7%. For comparison, it was 6.9% among residents with income above the poverty level.
Poverty rates in Harwinton, CT
Residents with income below the poverty level in 2022:
Residents with income below 50% of the poverty level in 2022:
Poverty rate among disabled males:
Poverty rate among disabled females:
Renting rate in this town among poor and not poor residents:
| Harwinton: | 2.7% |
| Whole state: | 9.8% |
| Harwinton: | 1.7% |
| Whole state: | 5.0% |
Poverty rate among disabled males:
| Harwinton: | 0.0% |
| Connecticut: | 10.8% |
Poverty rate among disabled females:
| Harwinton: | 7.3% |
| Connecticut: | 14.8% |
Disability rate in this town among poor females (it is 13.0% among female residents who are not classified as poor):
| Harwinton: | 34.2% |
| Connecticut: | 30.6% |
Renting rate in this town among poor and not poor residents:
| Residents below poverty level: | 9.7% |
| Residents above poverty level: | 6.9% |
Poverty by age in Harwinton, CT
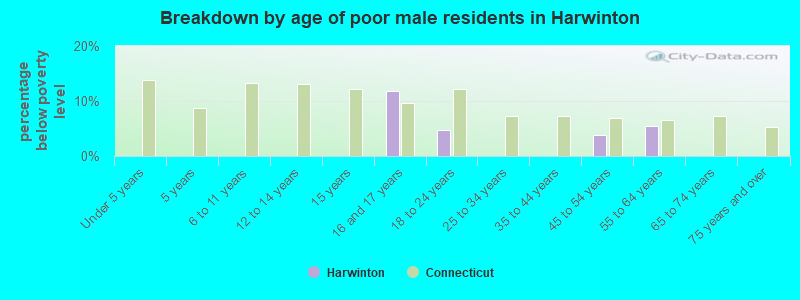
- Breakdown by age of poor male residents in Harwinton,CT (percentage below poverty level)
- 0.0%Under 5 years
- 0.0%5 years
- 0.0%6 to 11 years
- 0.0%12 to 14 years
- 0.0%15 years
- 11.9%16 and 17 years
- 4.6%18 to 24 years
- 0.0%25 to 34 years
- 0.0%35 to 44 years
- 3.8%45 to 54 years
- 5.4%55 to 64 years
- 0.0%65 to 74 years
- 0.0%75 years and over
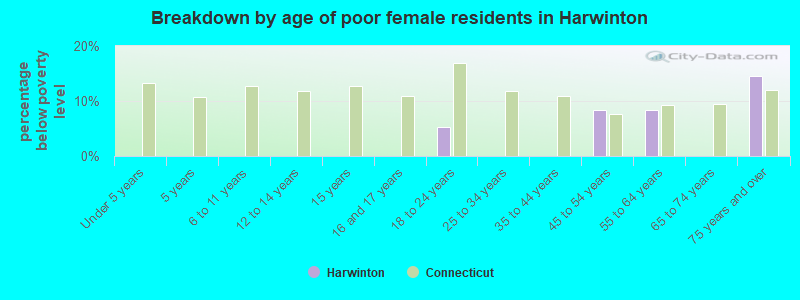
- Breakdown by age of poor female residents in Harwinton,CT (percentage below poverty level)
- 0.0%Under 5 years
- 0.0%5 years
- 0.0%6 to 11 years
- 0.0%12 to 14 years
- 0.0%15 years
- 0.0%16 and 17 years
- 5.3%18 to 24 years
- 0.0%25 to 34 years
- 0.0%35 to 44 years
- 8.3%45 to 54 years
- 8.3%55 to 64 years
- 0.0%65 to 74 years
- 14.6%75 years and over
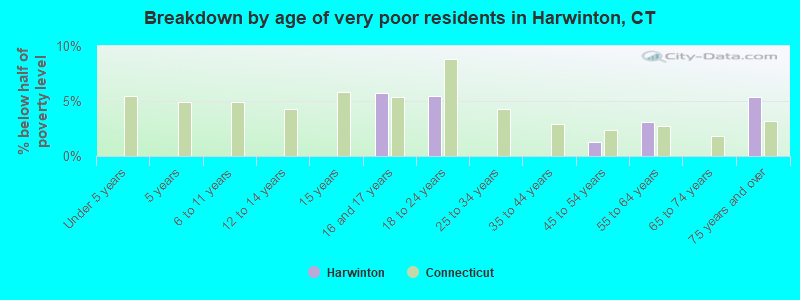
- Breakdown by age of very poor residents in Harwinton,CT (% below half of poverty level)
- 0.0%Under 5 years
- 0.0%5 years
- 0.0%6 to 11 years
- 0.0%12 to 14 years
- 0.0%15 years
- 5.8%16 and 17 years
- 5.4%18 to 24 years
- 0.0%25 to 34 years
- 0.0%35 to 44 years
- 1.2%45 to 54 years
- 3.1%55 to 64 years
- 0.0%65 to 74 years
- 5.3%75 years and over
Poverty by race and place of birth in Harwinton, CT
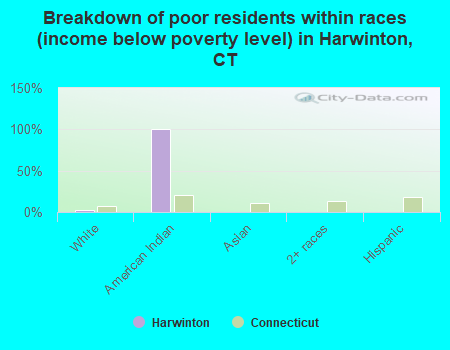
- Breakdown of poor residents within races in Harwinton, CT (%)
- 3.0%White
- 100.0%American Indian
- 0.0%Asian
- 0.0%2+ races
- 0.0%Hispanic
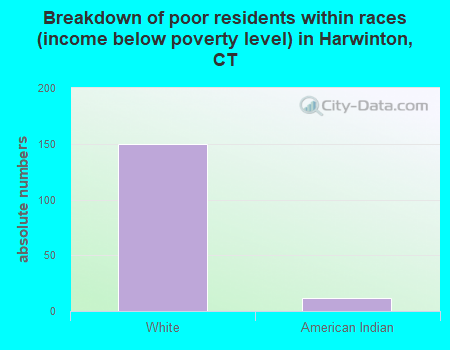
- Breakdown of poor residents within races in Harwinton, CT (absolute numbers)
- 150White
- 12American Indian
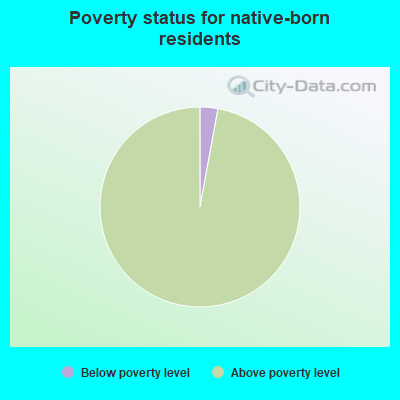
- 2.9%Below poverty level
- 97.1%Above poverty level
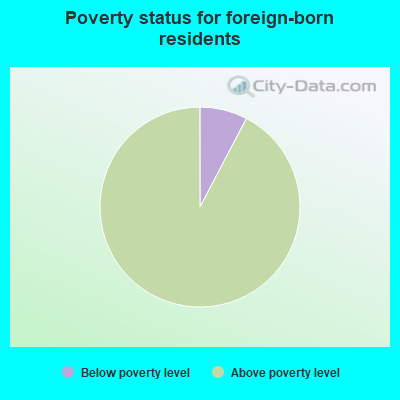
- 7.7%Below poverty level
- 92.3%Above poverty level
Poverty in families in Harwinton, CT
Children below poverty level:
| Harwinton, Connecticut: | 0.0% |
| State: | 12.1% |
Poverty rate among high school graduates not in families:
| Harwinton: | 10.5% |
| Connecticut: | 12.7% |
Poverty rate among people who did not graduate high school not in families:
| Harwinton: | 51.8% |
| Connecticut: | 32.9% |
Other data
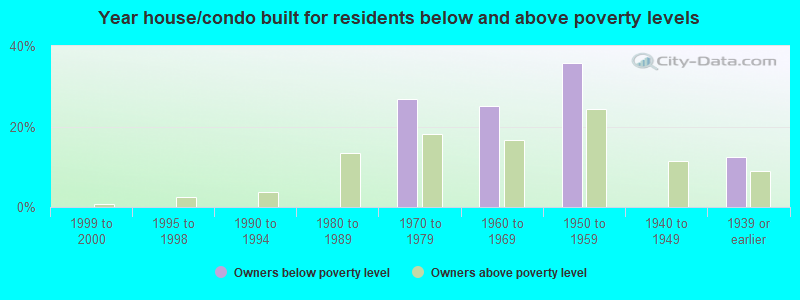
- Owners below poverty level
- 0.0%1999 to 2000
- 0.0%1995 to 1998
- 0.0%1990 to 1994
- 0.0%1980 to 1989
- 26.8%1970 to 1979
- 25.0%1960 to 1969
- 35.7%1950 to 1959
- 0.0%1940 to 1949
- 12.5%1939 or earlier
- Owners above poverty level
- 0.7%1999 to 2000
- 2.6%1995 to 1998
- 3.7%1990 to 1994
- 13.5%1980 to 1989
- 18.1%1970 to 1979
- 16.6%1960 to 1969
- 24.3%1950 to 1959
- 11.6%1940 to 1949
- 8.9%1939 or earlier