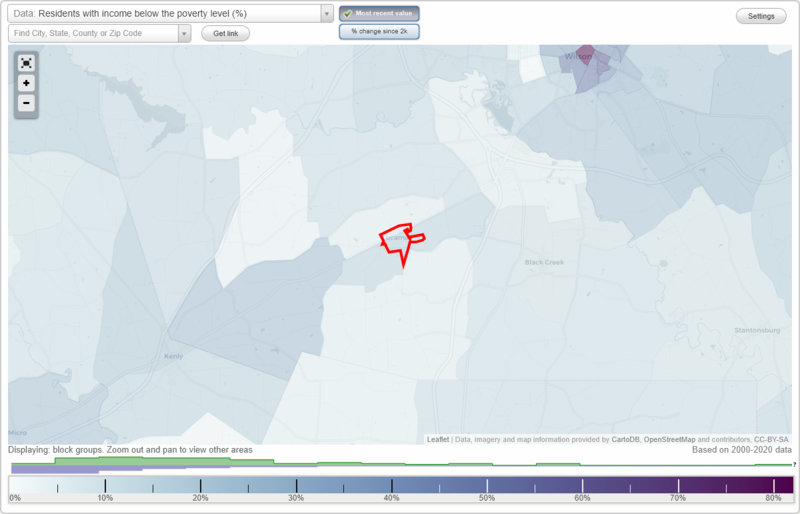
32.6% of Lucama, NC residents had an income below the poverty level in 2022, which was 60.9% greater than the poverty level of 12.8% across the entire state of North Carolina. 22.9% of high school graduates and 44.6% of non high school graduates live in poverty. The poverty rate was 48.9% among disabled residents. The renting rate among poor residents was 81.2%. For comparison, it was 37.1% among residents with income above the poverty level.
Poverty rates in Lucama, NC
Residents with income below the poverty level in 2022:
Lucama:
32.6%
Whole state:
12.8%
Residents with income below 50% of the poverty level in 2022:
Lucama:
8.2%
Whole state:
6.0%
Poverty rate among disabled residents:
Lucama:
48.9%
North Carolina:
20.4%
Disability rate in this town among poor residents (it is 13.3% among residents who are not classified as poor):
Lucama:
26.3%
North Carolina:
22.0%
Renting rate in this town among poor and not poor residents:
Residents below poverty level:
81.2%
Residents above poverty level:
37.1%
Poverty by age in Lucama, NC
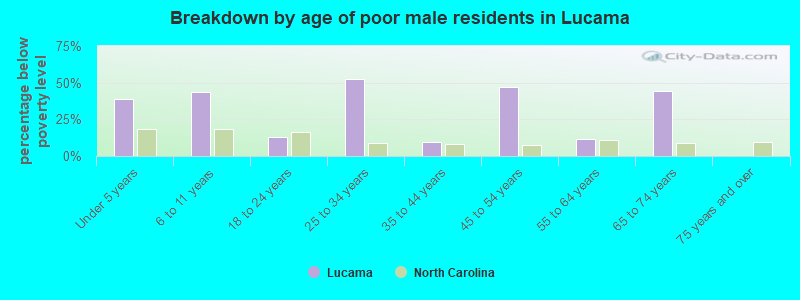
Breakdown by age of poor male residents in Lucama,NC (percentage below poverty level)
38.6%Under 5 years
43.5%6 to 11 years
13.2%18 to 24 years
52.4%25 to 34 years
9.8%35 to 44 years
46.9%45 to 54 years
11.9%55 to 64 years
44.6%65 to 74 years
0.0%75 years and over
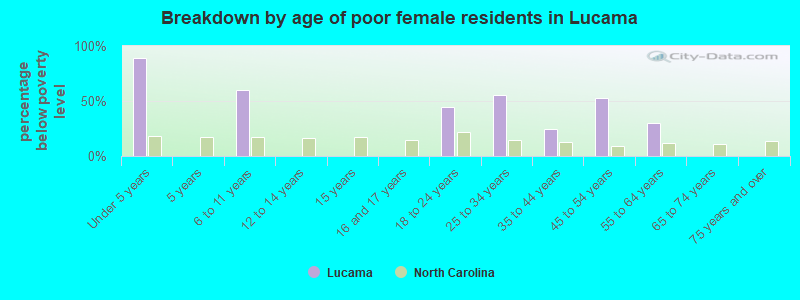
Breakdown by age of poor female residents in Lucama,NC (percentage below poverty level)
89.5%Under 5 years
0.0%5 years
60.3%6 to 11 years
0.0%12 to 14 years
0.0%15 years
0.0%16 and 17 years
44.4%18 to 24 years
55.2%25 to 34 years
24.6%35 to 44 years
52.5%45 to 54 years
30.0%55 to 64 years
0.0%65 to 74 years
0.0%75 years and over
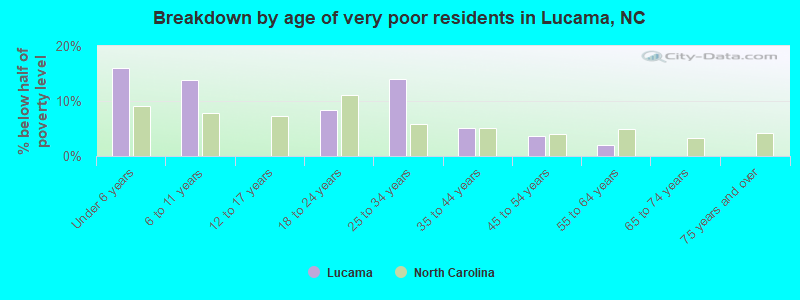
Breakdown by age of very poor residents in Lucama,NC (% below half of poverty level)
16.0%Under 6 years
13.8%6 to 11 years
0.0%12 to 17 years
8.4%18 to 24 years
14.1%25 to 34 years
5.1%35 to 44 years
3.6%45 to 54 years
2.0%55 to 64 years
0.0%65 to 74 years
0.0%75 years and over
Poverty by race and place of birth in Lucama, NC
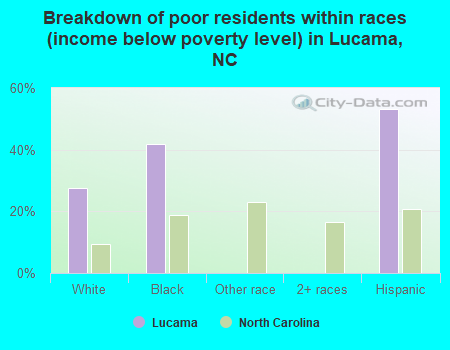
Breakdown of poor residents within races in Lucama, NC (%)
27.7%White
42.0%Black
0.0%Other race
0.0%2+ races
53.1%Hispanic
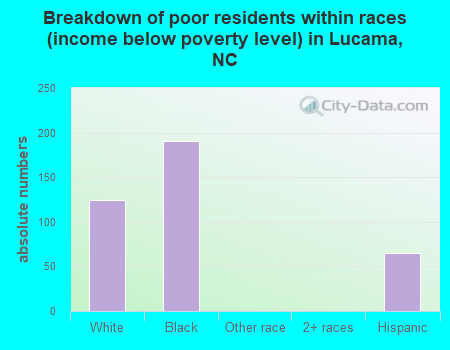
Breakdown of poor residents within races in Lucama, NC (absolute numbers)
124White
191Black
0Other race
02+ races
65Hispanic
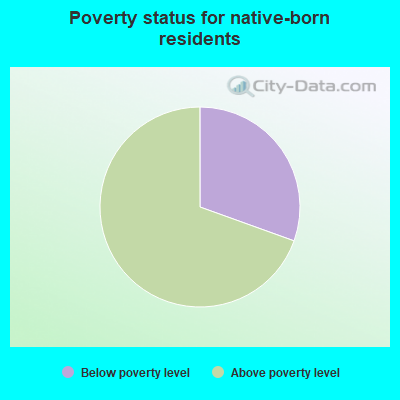
30.5%Below poverty level
69.5%Above poverty level
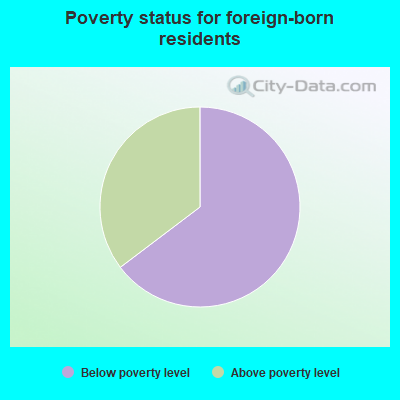
64.7%Below poverty level
35.3%Above poverty level
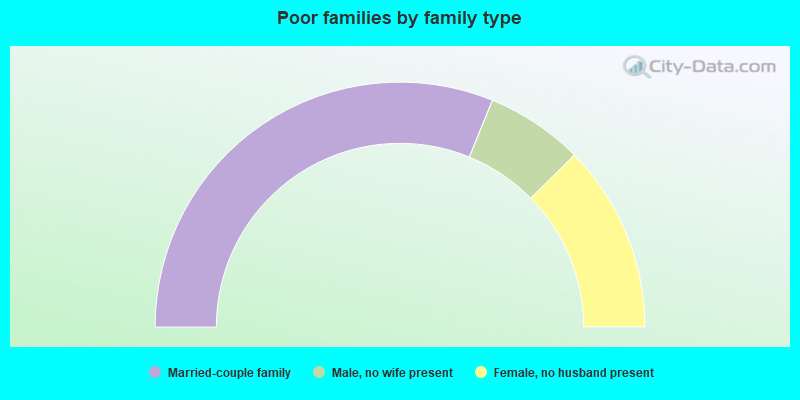
Poverty in families in Lucama, NC
Children below poverty level:
Lucama, North Carolina:
42.5%
State:
16.9%
Poverty rate among high school graduates:
Lucama:
22.9%
North Carolina:
8.9%
Poverty rate among people who did not graduate high school: