Roseland, California (CA) Poverty Rate Data
Information about poor and low-income residents

Recent posts about poverty in Roseland, California on our local forum with over 2,400,000 registered users:
 | Things You Should Know Before Moving to Sonoma County (49 replies) |
| Was West Windsor, Sonoma County dangerous at one point? (2 replies) |
| Looking at Roseland, (2 replies) |
| Considering Oakmont Village in Santa Rosa.............. (9 replies) |
| Love children moving to Petaluma, are we going to hate it??! (22 replies) |
| Where is the cheap safe neighborhood in or around L.A.? (37 replies) |
10.7% of Roseland, CA residents had an income below the poverty level in 2022, which was 13.7% less than the poverty level of 12.2% across the entire state of California. 9.5% of high school graduates and 7.7% of non high school graduates live in poverty. The poverty rate was 27.1% among disabled residents. The renting rate among poor residents was 100.0%. For comparison, it was 33.3% among residents with income above the poverty level.
Poverty rates in Roseland, CA
Residents with income below the poverty level in 2022:
Residents with income below 50% of the poverty level in 2022:
Poverty rate among disabled residents:
Renting rate in this place among poor and not poor residents:
| Roseland: | 10.7% |
| Whole state: | 12.2% |
| Roseland: | 6.5% |
| Whole state: | 6.0% |
Poverty rate among disabled residents:
| Roseland: | 27.1% |
| California: | 19.4% |
Disability rate in this place among poor residents (it is 8.9% among residents who are not classified as poor):
| Roseland: | 27.5% |
| California: | 18.7% |
Renting rate in this place among poor and not poor residents:
| Residents below poverty level: | 100.0% |
| Residents above poverty level: | 33.3% |
Poverty by age in Roseland, CA
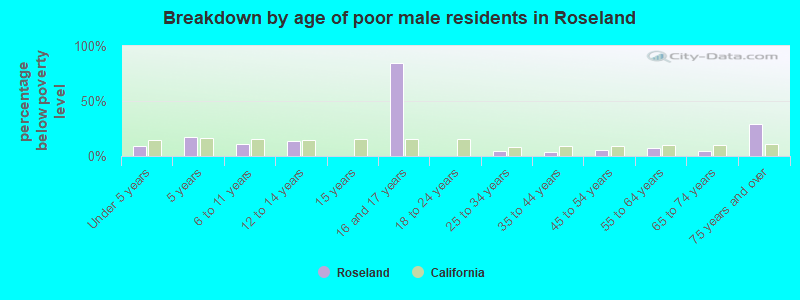
- Breakdown by age of poor male residents in Roseland,CA (percentage below poverty level)
- 9.3%Under 5 years
- 17.0%5 years
- 10.8%6 to 11 years
- 13.4%12 to 14 years
- 0.0%15 years
- 84.9%16 and 17 years
- 0.0%18 to 24 years
- 4.9%25 to 34 years
- 3.8%35 to 44 years
- 5.2%45 to 54 years
- 7.1%55 to 64 years
- 4.8%65 to 74 years
- 28.8%75 years and over
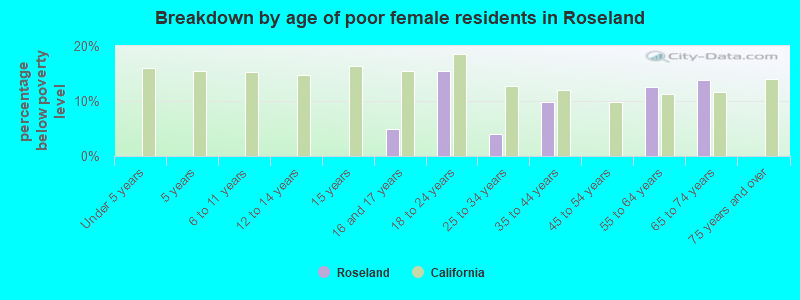
- Breakdown by age of poor female residents in Roseland,CA (percentage below poverty level)
- 0.0%Under 5 years
- 0.0%5 years
- 0.0%6 to 11 years
- 0.0%12 to 14 years
- 0.0%15 years
- 5.0%16 and 17 years
- 15.5%18 to 24 years
- 4.0%25 to 34 years
- 9.8%35 to 44 years
- 0.0%45 to 54 years
- 12.6%55 to 64 years
- 13.8%65 to 74 years
- 0.0%75 years and over
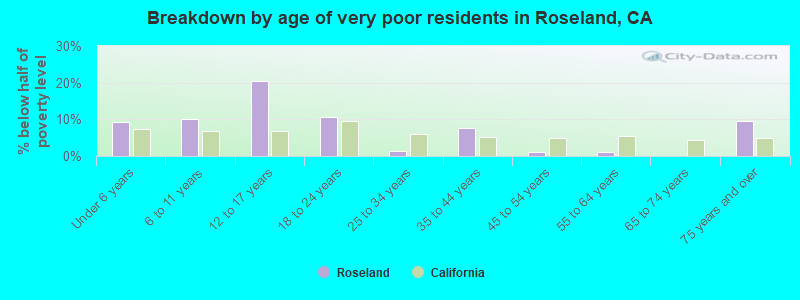
- Breakdown by age of very poor residents in Roseland,CA (% below half of poverty level)
- 9.4%Under 6 years
- 10.2%6 to 11 years
- 20.4%12 to 17 years
- 10.6%18 to 24 years
- 1.2%25 to 34 years
- 7.7%35 to 44 years
- 1.0%45 to 54 years
- 1.1%55 to 64 years
- 0.0%65 to 74 years
- 9.7%75 years and over
Poverty by race and place of birth in Roseland, CA
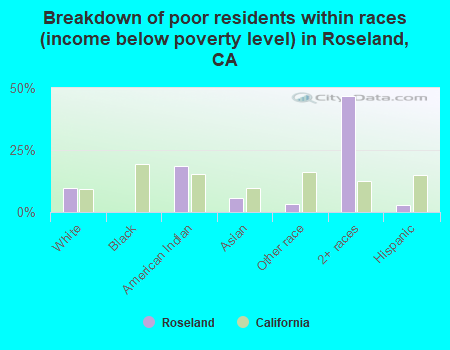
- Breakdown of poor residents within races in Roseland, CA (%)
- 9.6%White
- 0.0%Black
- 18.7%American Indian
- 5.6%Asian
- 3.2%Other race
- 46.8%2+ races
- 2.9%Hispanic
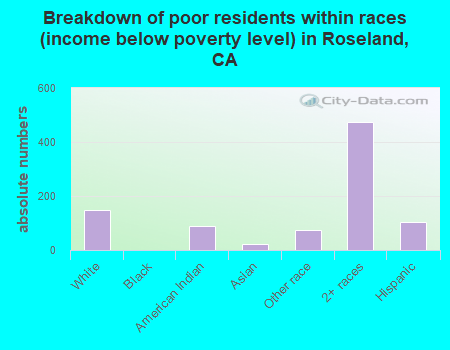
- Breakdown of poor residents within races in Roseland, CA (absolute numbers)
- 150White
- 0Black
- 88American Indian
- 21Asian
- 75Other race
- 4732+ races
- 102Hispanic
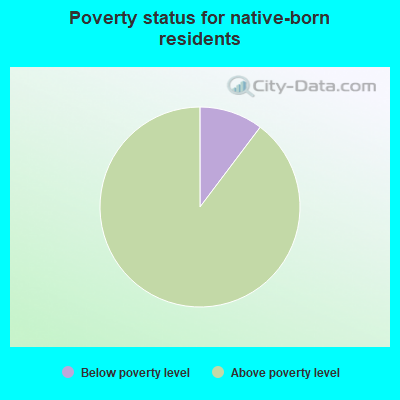
- 10.3%Below poverty level
- 89.7%Above poverty level
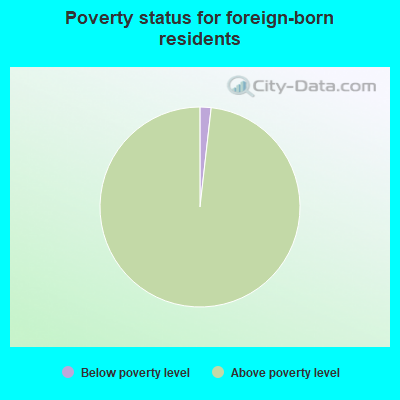
- 1.8%Below poverty level
- 98.2%Above poverty level
Poverty in families in Roseland, CA
Children below poverty level:
| Roseland, California: | 8.7% |
| State: | 15.0% |
Poverty rate among high school graduates:
| Roseland: | 9.5% |
| California: | 8.8% |
Poverty rate among people who did not graduate high school:
| Roseland: | 7.7% |
| California: | 20.4% |
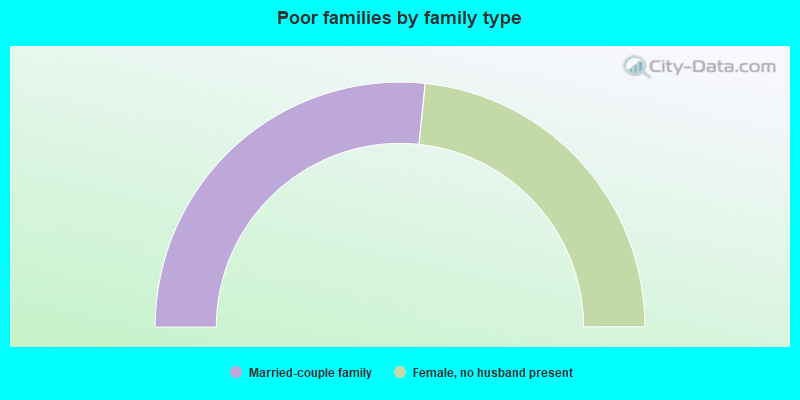
- 53.3%Married-couple family
- 0.0%Male, no wife present
- 46.7%Female, no husband present
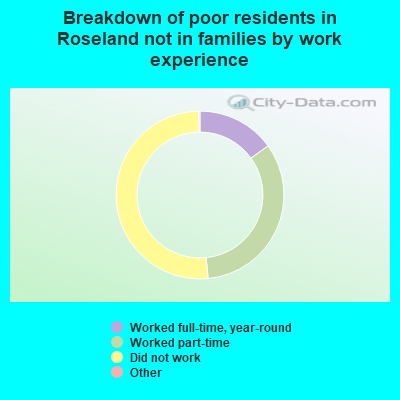
- 15.1%Worked full-time, year-round
- 33.5%Worked part-time
- 51.5%Did not work
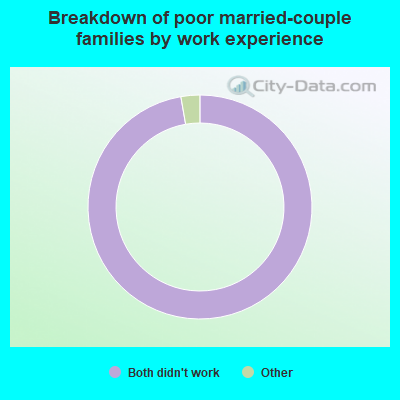
- 0.0%Both worked full-time
- 0.0%One full-time, other part-time
- 0.0%One full-time, other didn't work
- 0.0%Both worked part-time
- 0.0%One part-time, other didn't work
- 100.0%Both didn't work
Other data
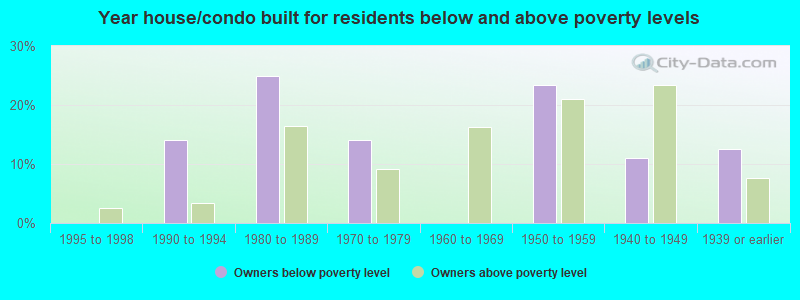
- Owners below poverty level
- 0.0%1999 to 2000
- 0.0%1995 to 1998
- 14.1%1990 to 1994
- 25.0%1980 to 1989
- 14.1%1970 to 1979
- 0.0%1960 to 1969
- 23.4%1950 to 1959
- 10.9%1940 to 1949
- 12.5%1939 or earlier
- Owners above poverty level
- 0.0%1999 to 2000
- 2.6%1995 to 1998
- 3.4%1990 to 1994
- 16.5%1980 to 1989
- 9.2%1970 to 1979
- 16.3%1960 to 1969
- 21.1%1950 to 1959
- 23.4%1940 to 1949
- 7.6%1939 or earlier