Tuftonboro, New Hampshire (NH) Poverty Rate Data
Information about poor and low-income residents

Recent posts about poverty in Tuftonboro, New Hampshire on our local forum with over 2,400,000 registered users:
 | Move to NH - Suggested Areas & Towns? (108 replies) |
| People who live in New Hampshire - what are the pros and cons of living in New Hampshire? (66 replies) |
| Why is N.H. so boring & unchanged? Let's change it! (66 replies) |
| Property tax bill in, ouch! (85 replies) |
| Relocating to rural New England (18 replies) |
| Is it even legal to raise the taxes this much in one year? (72 replies) |
Latest news about poverty in Tuftonboro, NH collected exclusively by city-data.com from local newspapers, TV, and radio stations
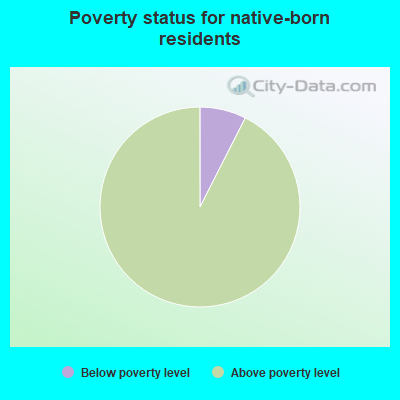
6.4% of Tuftonboro, NH residents had an income below the poverty level in 2022, which was 13.0% less than the poverty level of 7.2% across the entire state of New Hampshire. Taking into account residents not living in families, 12.1% of high school graduates and 62.5% of non high school graduates live in poverty. The poverty rate was 11.0% among disabled males and 6.0% among disabled females. The renting rate among poor residents was 13.1%. For comparison, it was 12.9% among residents with income above the poverty level.
Poverty rates in Tuftonboro, NH
Residents with income below the poverty level in 2022:
Residents with income below 50% of the poverty level in 2022:
Poverty rate among disabled males:
Poverty rate among disabled females:
Renting rate in this town among poor and not poor residents:
| Tuftonboro: | 6.4% |
| Whole state: | 7.2% |
| Tuftonboro: | 2.7% |
| Whole state: | 3.5% |
Poverty rate among disabled males:
| Tuftonboro: | 11.0% |
| New Hampshire: | 9.6% |
Disability rate in this town among poor males (it is 16.3% among male residents who are not classified as poor):
| Tuftonboro: | 32.8% |
| New Hampshire: | 31.9% |
Poverty rate among disabled females:
| Tuftonboro: | 6.0% |
| New Hampshire: | 14.1% |
Disability rate in this town among poor females (it is 16.2% among female residents who are not classified as poor):
| Tuftonboro: | 14.1% |
| New Hampshire: | 31.7% |
Renting rate in this town among poor and not poor residents:
| Residents below poverty level: | 13.1% |
| Residents above poverty level: | 12.9% |
Poverty by age in Tuftonboro, NH
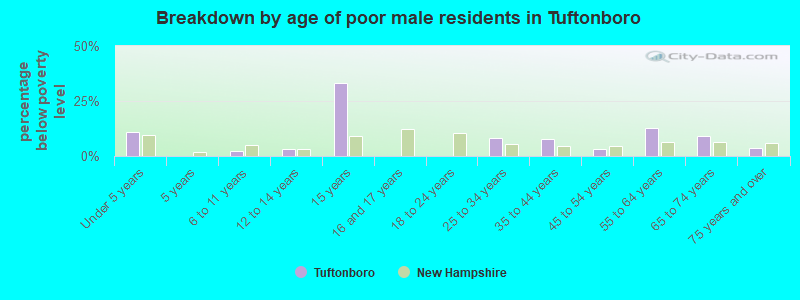
- Breakdown by age of poor male residents in Tuftonboro,NH (percentage below poverty level)
- 10.8%Under 5 years
- 0.0%5 years
- 2.1%6 to 11 years
- 3.2%12 to 14 years
- 33.3%15 years
- 0.0%16 and 17 years
- 0.0%18 to 24 years
- 8.3%25 to 34 years
- 7.8%35 to 44 years
- 3.0%45 to 54 years
- 12.6%55 to 64 years
- 9.1%65 to 74 years
- 3.7%75 years and over
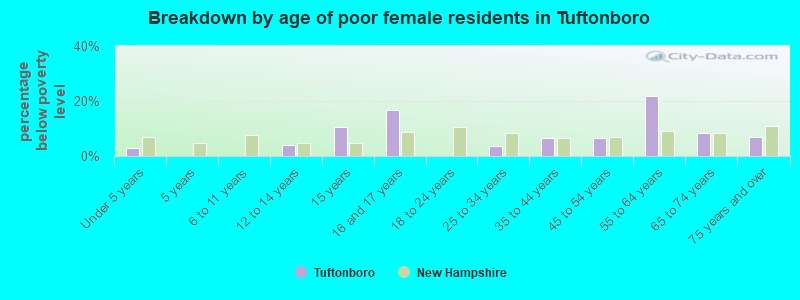
- Breakdown by age of poor female residents in Tuftonboro,NH (percentage below poverty level)
- 2.8%Under 5 years
- 0.0%5 years
- 0.0%6 to 11 years
- 3.8%12 to 14 years
- 10.5%15 years
- 16.7%16 and 17 years
- 0.0%18 to 24 years
- 3.7%25 to 34 years
- 6.6%35 to 44 years
- 6.5%45 to 54 years
- 21.9%55 to 64 years
- 8.2%65 to 74 years
- 7.0%75 years and over
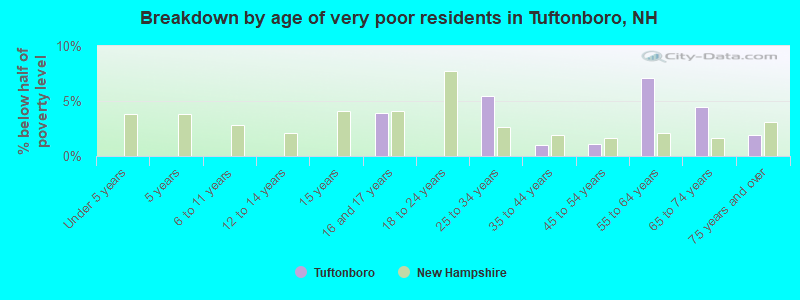
- Breakdown by age of very poor residents in Tuftonboro,NH (% below half of poverty level)
- 0.0%Under 5 years
- 0.0%5 years
- 0.0%6 to 11 years
- 0.0%12 to 14 years
- 0.0%15 years
- 3.9%16 and 17 years
- 0.0%18 to 24 years
- 5.5%25 to 34 years
- 1.0%35 to 44 years
- 1.1%45 to 54 years
- 7.1%55 to 64 years
- 4.5%65 to 74 years
- 1.9%75 years and over
Poverty by race and place of birth in Tuftonboro, NH
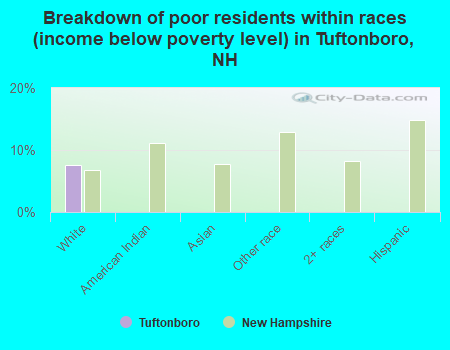
- Breakdown of poor residents within races in Tuftonboro, NH (%)
- 7.5%White
- 0.0%American Indian
- 0.0%Asian
- 0.0%Other race
- 0.0%2+ races
- 0.0%Hispanic
- Breakdown of poor residents within races in Tuftonboro, NH (absolute numbers)
- 163White
- 7.5%Below poverty level
- 92.5%Above poverty level
Poverty in families in Tuftonboro, NH
Children below poverty level:
| Tuftonboro, New Hampshire: | 6.0% |
| State: | 6.3% |
Poverty rate among high school graduates not in families:
| Tuftonboro: | 12.1% |
| New Hampshire: | 13.3% |
Poverty rate among people who did not graduate high school not in families:
| Tuftonboro: | 62.5% |
| New Hampshire: | 32.2% |
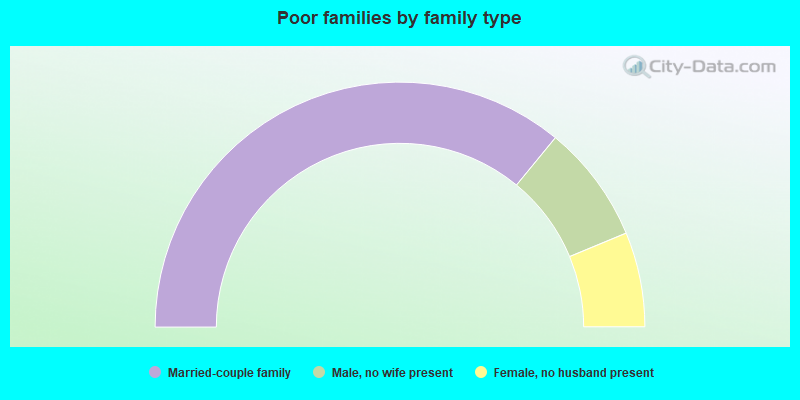
- 71.9%Married-couple family
- 15.6%Male, no wife present
- 12.5%Female, no husband present
Other data
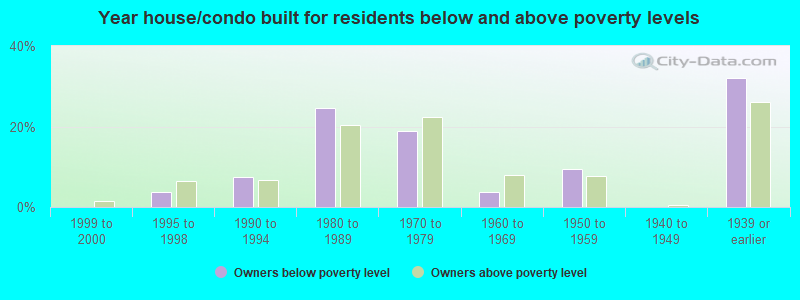
- Owners below poverty level
- 0.0%1999 to 2000
- 3.8%1995 to 1998
- 7.5%1990 to 1994
- 24.5%1980 to 1989
- 18.9%1970 to 1979
- 3.8%1960 to 1969
- 9.4%1950 to 1959
- 0.0%1940 to 1949
- 32.1%1939 or earlier
- Owners above poverty level
- 1.6%1999 to 2000
- 6.5%1995 to 1998
- 6.8%1990 to 1994
- 20.5%1980 to 1989
- 22.4%1970 to 1979
- 8.0%1960 to 1969
- 7.7%1950 to 1959
- 0.5%1940 to 1949
- 26.0%1939 or earlier