Races in Agua Dulce, California (CA) Detailed Stats
Data:
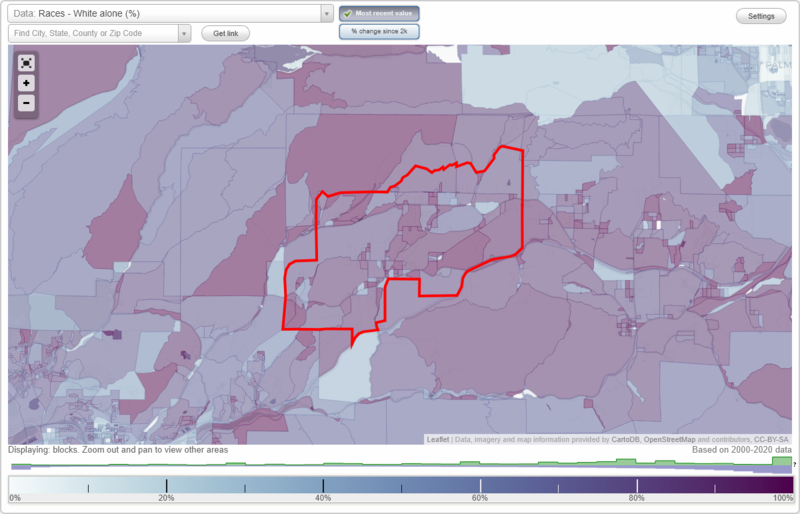
Races - White alone (%)
Races - White alone (% change since 2000)
Races - Black alone (%)
Races - Black alone (% change since 2000)
Races - American Indian alone (%)
Races - American Indian alone (% change since 2000)
Races - Asian alone (%)
Races - Asian alone (% change since 2000)
Races - Hispanic (%)
Races - Hispanic (% change since 2000)
Races - Native Hawaiian and Other Pacific Islander alone (%)
Races - Native Hawaiian and Other Pacific Islander alone (% change since 2000)
Races - Two or more races(%)
Races - Two or more races(% change since 2000)
Races - Other race alone (%)
Races - Other race alone (% change since 2000)
Racial diversity
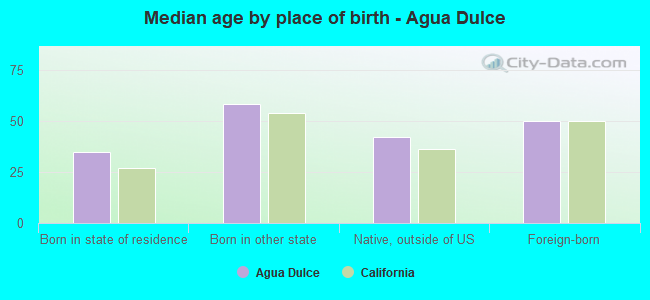
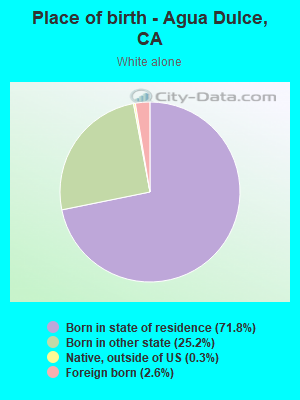
Place of birth - Born in state of residence (%)
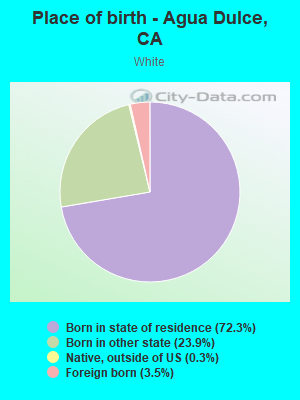
Place of birth - Born in state of residence (%) - White
Place of birth - Born in state of residence (%) - Black or African American
Place of birth - Born in state of residence (%) - Asian
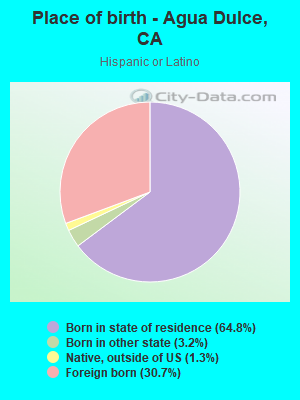
Place of birth - Born in state of residence (%) - Hispanic or Latino
Place of birth - Born in state of residence (%) - American Indian and Alaska Native
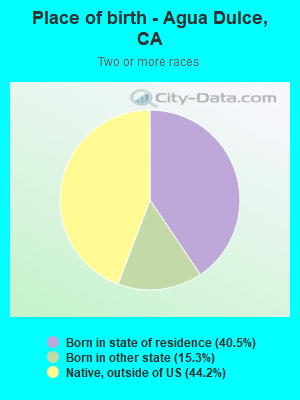
Place of birth - Born in state of residence (%) - Multirace
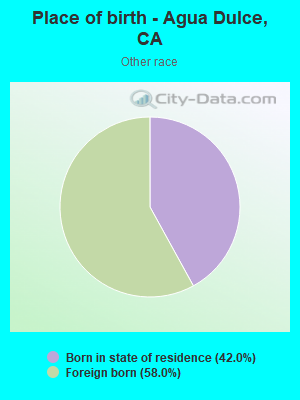
Place of birth - Born in state of residence (%) - Other Race
Place of birth - Born in other state (%)
Place of birth - Born in other state (%) - White
Place of birth - Born in other state (%) - Black or African American
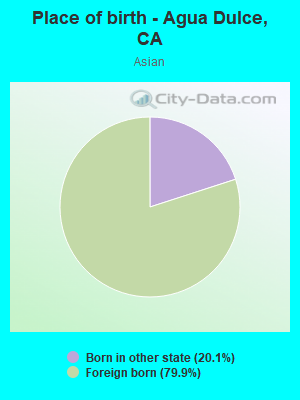
Place of birth - Born in other state (%) - Asian
Place of birth - Born in other state (%) - Hispanic or Latino
Place of birth - Born in other state (%) - American Indian and Alaska Native
Place of birth - Born in other state (%) - Multirace
Place of birth - Born in other state (%) - Other Race
Place of birth - Native, outside of US (%)
Place of birth - Native, outside of US (%) - White
Place of birth - Native, outside of US (%) - Black or African American
Place of birth - Native, outside of US (%) - Asian
Place of birth - Native, outside of US (%) - Hispanic or Latino
Place of birth - Native, outside of US (%) - American Indian and Alaska Native
Place of birth - Native, outside of US (%) - Multirace
Place of birth - Native, outside of US (%) - Other Race
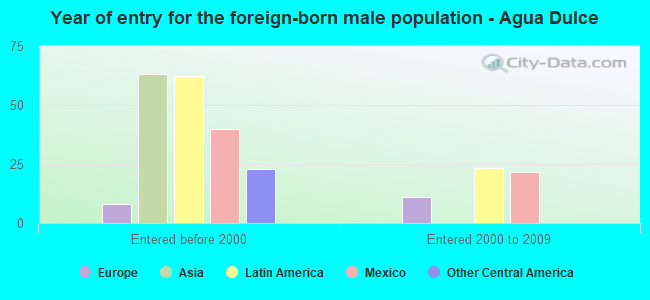
Place of birth - Foreign born (%)
Place of birth - Foreign born (%) - White
Place of birth - Foreign born (%) - Black or African American
Place of birth - Foreign born (%) - Asian
Place of birth - Foreign born (%) - Hispanic or Latino
Place of birth - Foreign born (%) - American Indian and Alaska Native
Place of birth - Foreign born (%) - Multirace
Place of birth - Foreign born (%) - Other Race
Residents speaking English at home (%)
Residents speaking English at home - Born in the United States (%)
Residents speaking English at home - Native, born elsewhere (%)
Residents speaking English at home - Foreign born (%)
Residents speaking Spanish at home (%)
Residents speaking Spanish at home - Born in the United States (%)
Residents speaking Spanish at home - Native, born elsewhere (%)
Residents speaking Spanish at home - Foreign born (%)
Residents speaking other language at home (%)
Residents speaking other language at home - Born in the United States (%)
Residents speaking other language at home - Native, born elsewhere (%)
Residents speaking other language at home - Foreign born (%)
Marital status - Never married (%)
Marital status - Now married (%)
Marital status - Separated (%)
Marital status - Widowed (%)
Marital status - Divorced (%)
Ancestries Reported - Arab (%)
Ancestries Reported - Czech (%)
Ancestries Reported - Danish (%)
Ancestries Reported - Dutch (%)
Ancestries Reported - English (%)
Ancestries Reported - French (%)
Ancestries Reported - French Canadian (%)
Ancestries Reported - German (%)
Ancestries Reported - Greek (%)
Ancestries Reported - Hungarian (%)
Ancestries Reported - Irish (%)
Ancestries Reported - Italian (%)
Ancestries Reported - Lithuanian (%)
Ancestries Reported - Norwegian (%)
Ancestries Reported - Polish (%)
Ancestries Reported - Portuguese (%)
Ancestries Reported - Russian (%)
Ancestries Reported - Scotch-Irish (%)
Ancestries Reported - Scottish (%)
Ancestries Reported - Slovak (%)
Ancestries Reported - Subsaharan African (%)
Ancestries Reported - Swedish (%)
Ancestries Reported - Swiss (%)
Ancestries Reported - Ukrainian (%)
Ancestries Reported - United States (%)
Ancestries Reported - Welsh (%)
Ancestries Reported - West Indian (%)
Ancestries Reported - Other (%)
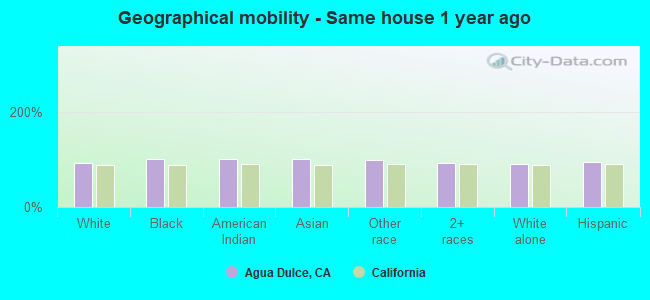
Geographical mobility - Same house 1 year ago (%)
Geographical mobility - Same house 1 year ago (%) - White
Geographical mobility - Same house 1 year ago (%) - Black or African American
Geographical mobility - Same house 1 year ago (%) - Asian
Geographical mobility - Same house 1 year ago (%) - Hispanic or Latino
Geographical mobility - Same house 1 year ago (%) - American Indian and Alaska Native
Geographical mobility - Same house 1 year ago (%) - Multirace
Geographical mobility - Same house 1 year ago (%) - Other Race
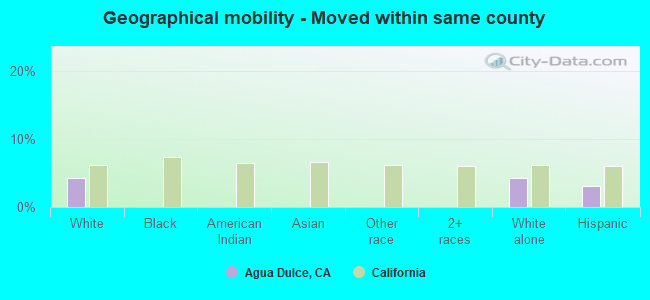
Geographical mobility - Moved within same county (%)
Geographical mobility - Moved within same county (%) - White
Geographical mobility - Moved within same county (%) - Black or African American
Geographical mobility - Moved within same county (%) - Asian
Geographical mobility - Moved within same county (%) - Hispanic or Latino
Geographical mobility - Moved within same county (%) - American Indian and Alaska Native
Geographical mobility - Moved within same county (%) - Multirace
Geographical mobility - Moved within same county (%) - Other Race
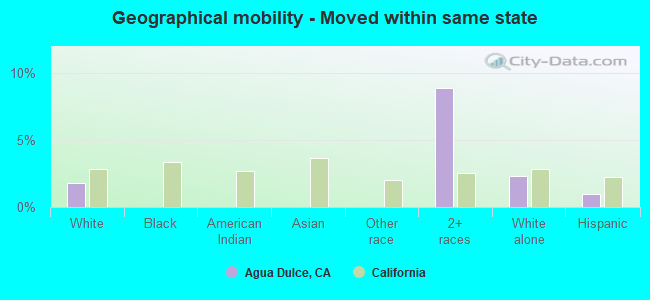
Geographical mobility - Moved from different county within same state (%)
Geographical mobility - Moved from different county within same state (%) - White
Geographical mobility - Moved from different county within same state (%) - Black or African American
Geographical mobility - Moved from different county within same state (%) - Asian
Geographical mobility - Moved from different county within same state (%) - Hispanic or Latino
Geographical mobility - Moved from different county within same state (%) - American Indian and Alaska Native
Geographical mobility - Moved from different county within same state (%) - Multirace
Geographical mobility - Moved from different county within same state (%) - Other Race
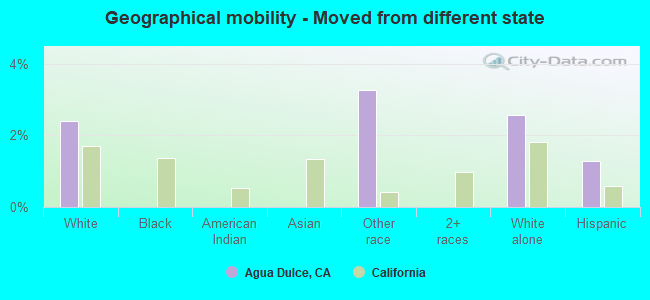
Geographical mobility - Moved from different state (%)
Geographical mobility - Moved from different state (%) - White
Geographical mobility - Moved from different state (%) - Black or African American
Geographical mobility - Moved from different state (%) - Asian
Geographical mobility - Moved from different state (%) - Hispanic or Latino
Geographical mobility - Moved from different state (%) - American Indian and Alaska Native
Geographical mobility - Moved from different state (%) - Multirace
Geographical mobility - Moved from different state (%) - Other Race
Geographical mobility - Moved from abroad (%)
Geographical mobility - Moved from abroad (%) - White
Geographical mobility - Moved from abroad (%) - Black or African American
Geographical mobility - Moved from abroad (%) - Asian
Geographical mobility - Moved from abroad (%) - Hispanic or Latino
Geographical mobility - Moved from abroad (%) - American Indian and Alaska Native
Geographical mobility - Moved from abroad (%) - Multirace
Geographical mobility - Moved from abroad (%) - Other Race
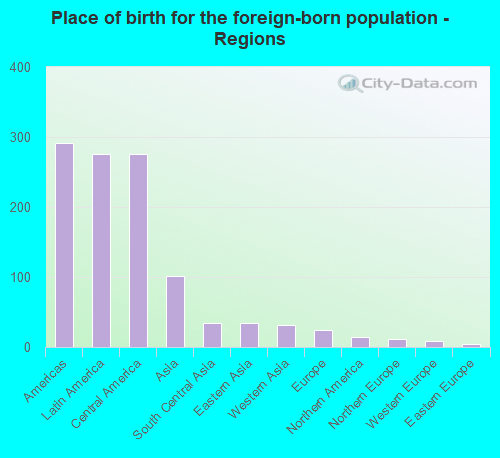
Place of birth for the foreign-born population - Ireland (%)
Place of birth for the foreign-born population - Denmark (%)
Place of birth for the foreign-born population - Norway (%)
Place of birth for the foreign-born population - Sweden (%)
Place of birth for the foreign-born population - United Kingdom (%)
Place of birth for the foreign-born population - England (%)
Place of birth for the foreign-born population - Scotland (%)
Place of birth for the foreign-born population - Other Northern Europe (%)
Place of birth for the foreign-born population - Austria (%)
Place of birth for the foreign-born population - Belgium (%)
Place of birth for the foreign-born population - France (%)
Place of birth for the foreign-born population - Germany (%)
Place of birth for the foreign-born population - Netherlands (%)
Place of birth for the foreign-born population - Switzerland (%)
Place of birth for the foreign-born population - Other Western Europe (%)
Place of birth for the foreign-born population - Greece (%)
Place of birth for the foreign-born population - Italy (%)
Place of birth for the foreign-born population - Portugal (%)
Place of birth for the foreign-born population - Spain (%)
Place of birth for the foreign-born population - Other Southern Europe (%)
Place of birth for the foreign-born population - Albania (%)
Place of birth for the foreign-born population - Belarus (%)
Place of birth for the foreign-born population - Bosnia and Herzegovina (%)
Place of birth for the foreign-born population - Bulgaria (%)
Place of birth for the foreign-born population - Croatia (%)
Place of birth for the foreign-born population - Czechoslovakia (%)
Place of birth for the foreign-born population - Hungary (%)
Place of birth for the foreign-born population - Latvia (%)
Place of birth for the foreign-born population - Lithuania (%)
Place of birth for the foreign-born population - North Macedonia (Macedonia) (%)
Place of birth for the foreign-born population - Moldova (%)
Place of birth for the foreign-born population - Poland (%)
Place of birth for the foreign-born population - Romania (%)
Place of birth for the foreign-born population - Russia (%)
Place of birth for the foreign-born population - Serbia (%)
Place of birth for the foreign-born population - Ukraine (%)
Place of birth for the foreign-born population - Other Eastern Europe (%)
Place of birth for the foreign-born population - China (%)
Place of birth for the foreign-born population - Hong Kong (%)
Place of birth for the foreign-born population - Taiwan (%)
Place of birth for the foreign-born population - Japan (%)
Place of birth for the foreign-born population - Korea (%)
Place of birth for the foreign-born population - Other Eastern Asia (%)
Place of birth for the foreign-born population - Afghanistan (%)
Place of birth for the foreign-born population - Bangladesh (%)
Place of birth for the foreign-born population - India (%)
Place of birth for the foreign-born population - Iran (%)
Place of birth for the foreign-born population - Kazakhstan (%)
Place of birth for the foreign-born population - Nepal (%)
Place of birth for the foreign-born population - Pakistan (%)
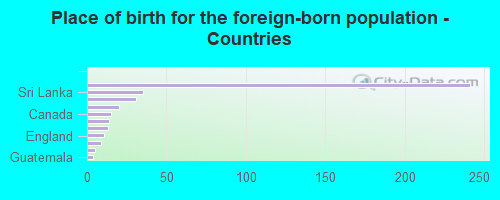
Place of birth for the foreign-born population - Sri Lanka (%)
Place of birth for the foreign-born population - Uzbekistan (%)
Place of birth for the foreign-born population - Other South Central Asia (%)
Place of birth for the foreign-born population - Burma (%)
Place of birth for the foreign-born population - Cambodia (%)
Place of birth for the foreign-born population - Indonesia (%)
Place of birth for the foreign-born population - Laos (%)
Place of birth for the foreign-born population - Malaysia (%)
Place of birth for the foreign-born population - Philippines (%)
Place of birth for the foreign-born population - Singapore (%)
Place of birth for the foreign-born population - Thailand (%)
Place of birth for the foreign-born population - Vietnam (%)
Place of birth for the foreign-born population - Other South Eastern Asia (%)
Place of birth for the foreign-born population - Armenia (%)
Place of birth for the foreign-born population - Iraq (%)
Place of birth for the foreign-born population - Israel (%)
Place of birth for the foreign-born population - Jordan (%)
Place of birth for the foreign-born population - Kuwait (%)
Place of birth for the foreign-born population - Lebanon (%)
Place of birth for the foreign-born population - Saudi Arabia (%)
Place of birth for the foreign-born population - Syria (%)
Place of birth for the foreign-born population - Turkey (%)
Place of birth for the foreign-born population - Yemen (%)
Place of birth for the foreign-born population - Other Western Asia (%)
Place of birth for the foreign-born population - Eritrea (%)
Place of birth for the foreign-born population - Ethiopia (%)
Place of birth for the foreign-born population - Kenya (%)
Place of birth for the foreign-born population - Somalia (%)
Place of birth for the foreign-born population - Uganda (%)
Place of birth for the foreign-born population - Zimbabwe (%)
Place of birth for the foreign-born population - Other Eastern Africa (%)
Place of birth for the foreign-born population - Cameroon (%)
Place of birth for the foreign-born population - Congo (%)
Place of birth for the foreign-born population - Democratic Republic of Congo (Zaire) (%)
Place of birth for the foreign-born population - Other Middle Africa (%)
Place of birth for the foreign-born population - Egypt (%)
Place of birth for the foreign-born population - Morocco (%)
Place of birth for the foreign-born population - Sudan (%)
Place of birth for the foreign-born population - Other Northern Africa (%)
Place of birth for the foreign-born population - South Africa (%)
Place of birth for the foreign-born population - Other Southern Africa (%)
Place of birth for the foreign-born population - Cabo Verde (%)
Place of birth for the foreign-born population - Ghana (%)
Place of birth for the foreign-born population - Liberia (%)
Place of birth for the foreign-born population - Nigeria (%)
Place of birth for the foreign-born population - Senegal (%)
Place of birth for the foreign-born population - Sierra Leone (%)
Place of birth for the foreign-born population - Other Western Africa (%)
Place of birth for the foreign-born population - Australia (%)
Place of birth for the foreign-born population - New Zealand (%)
Place of birth for the foreign-born population - Fiji (%)
Place of birth for the foreign-born population - Micronesia (%)
Place of birth for the foreign-born population - Bahamas (%)
Place of birth for the foreign-born population - Barbados (%)
Place of birth for the foreign-born population - Cuba (%)
Place of birth for the foreign-born population - Dominica (%)
Place of birth for the foreign-born population - Dominican Republic (%)
Place of birth for the foreign-born population - Grenada (%)
Place of birth for the foreign-born population - Haiti (%)
Place of birth for the foreign-born population - Jamaica (%)
Place of birth for the foreign-born population - St. Vincent and the Grenadines (%)
Place of birth for the foreign-born population - Trinidad and Tobago (%)
Place of birth for the foreign-born population - West Indies (%)
Place of birth for the foreign-born population - Other Caribbean (%)
Place of birth for the foreign-born population - Belize (%)
Place of birth for the foreign-born population - Costa Rica (%)
Place of birth for the foreign-born population - El Salvador (%)
Place of birth for the foreign-born population - Guatemala (%)
Place of birth for the foreign-born population - Honduras (%)
Place of birth for the foreign-born population - Mexico (%)
Place of birth for the foreign-born population - Nicaragua (%)
Place of birth for the foreign-born population - Panama (%)
Place of birth for the foreign-born population - Other Central America (%)
Place of birth for the foreign-born population - Argentina (%)
Place of birth for the foreign-born population - Bolivia (%)
Place of birth for the foreign-born population - Brazil (%)
Place of birth for the foreign-born population - Chile (%)
Place of birth for the foreign-born population - Colombia (%)
Place of birth for the foreign-born population - Ecuador (%)
Place of birth for the foreign-born population - Guyana (%)
Place of birth for the foreign-born population - Peru (%)
Place of birth for the foreign-born population - Uruguay (%)
Place of birth for the foreign-born population - Venezuela (%)
Place of birth for the foreign-born population - Other South America (%)
Place of birth for the foreign-born population - Canada (%)
Place of birth for the foreign-born population - Other Northern America (%)
Place of birth for the foreign-born population - Other (%)
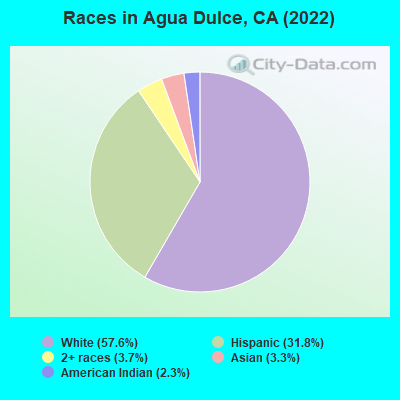
According to 2022 data, the most numerous races in Agua Dulce, CA are Hispanic (858 residents), White alone (2,490 residents), and Asian alone (95 residents). 84.2% of Agua Dulce residents speak English at home.
Race distribution in Agua Dulce 2,490 66.7% White alone 858 23.0% Hispanic 97 2.6% American Indian alone 95 2.5% Asian alone 42 1.1% Two or more races
2000 2022
15,816,790 46.7% White alone 10,966,556 32.4% Hispanic 3,648,860 10.8% Asian alone 2,181,926 6.4% Black alone 903,115 2.7% Two or more races 178,984 0.5% American Indian alone 103,736 0.3% Native Hawaiian and Other 71,681 0.2% Other race alone
15,732,184 40.3% Hispanic 13,160,426 33.7% White alone 5,957,867 15.3% Asian alone 2,025,218 5.2% Black alone 1,663,222 4.3% Two or more races 251,618 0.6% Other race alone 135,777 0.3% Native Hawaiian and Other 103,030 0.3% American Indian alone
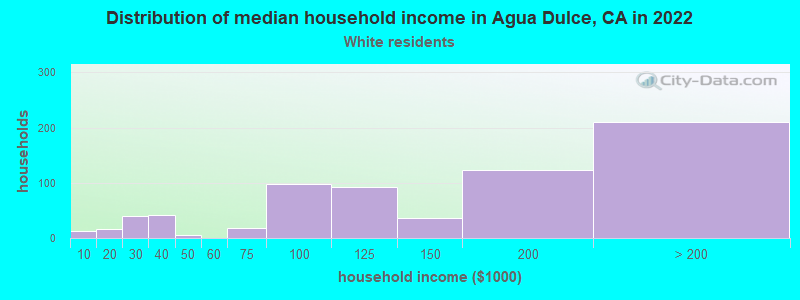
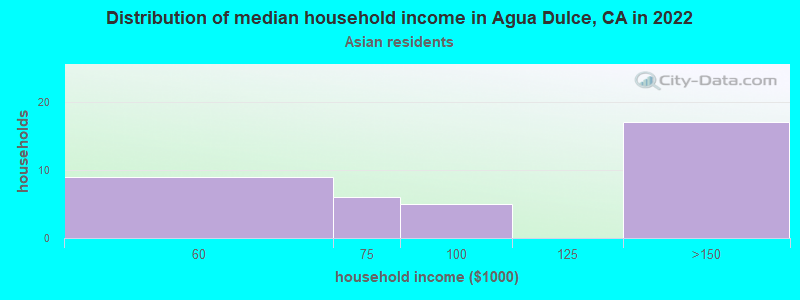
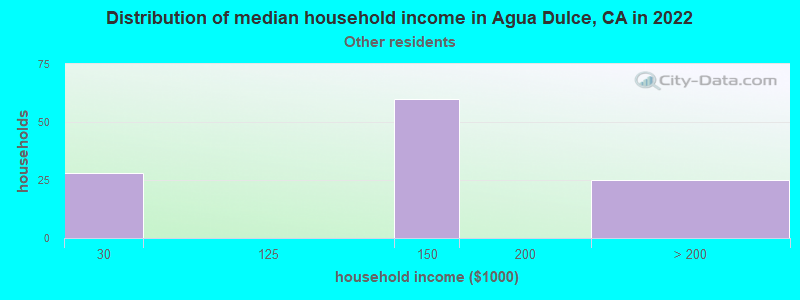
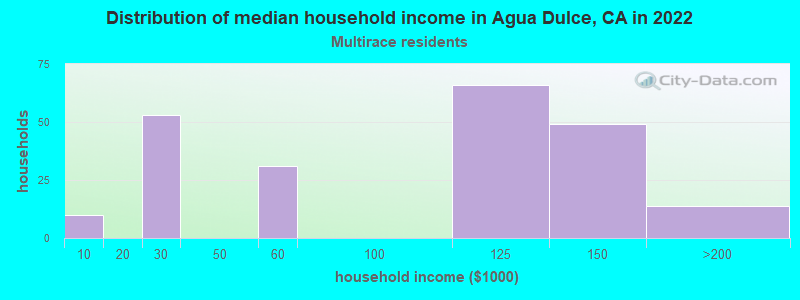
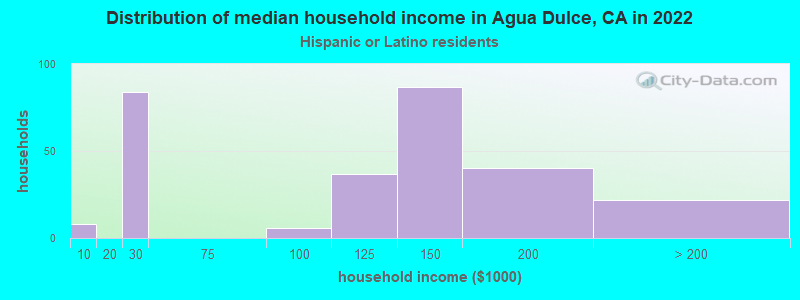
Income and house value in Agua Dulce Median household income in 2022 $135,003 White non-Hispanic householders$87,218 Asian householders$199,255 Two or more races householders$150,403 Hispanic or Latino race householders
Median age by race in Agua Dulce
50.4 Median age for White residents55.9 47.5 27.8 Median age for American Indian / Alaska Native residents60.8 Median age for Asian residents66.2 60.6 18.2 Median age for Other race residents17.2 18.1 38.3 Median age for Two or more races residents53.0 Median age for White alone residents56.9 47.1 32.1 Median age for Hispanic or Latino residents30.9 32.3
Owner/renter occupied households by race in Agua Dulce
House owners and renters - White residents 836 97.1% Owner occupied25 2.9% Renter occupiedHouse owners and renters - American Indian / Alaska Native residents 37 100.0% Renter occupiedHouse owners and renters - Asian residents 39 81.9% Owner occupied9 18.1% Renter occupiedHouse owners and renters - Other race residents 74 100.0% Owner occupiedHouse owners and renters - Two or more races residents 28 39.6% Owner occupied42 60.4% Renter occupiedHouse owners and renters - White alone residents 818 96.7% Owner occupied28 3.3% Renter occupiedHouse owners and renters - Hispanic or Latino residents 151 100.0% Owner occupied
Language usage in Agua Dulce
English speakers - Total 84.2% of residents of Agua Dulce speak English at home.
13.4% of residents speak Spanish at home 329 70.1% Speak English very well140 29.9% Speak English less than very well2.7% of residents speak other language at home 48 50.0% Speak English very well48 50.0% Speak English less than very well
English speakers - Born in the United States 96.5% of residents of Agua Dulce speak English at home.
3.2% of residents speak other language at home 8 34.8% Speak English very well15 65.2% Speak English less than very well
English speakers - Native, born elsewhere 76.2% of residents of Agua Dulce speak English at home.
19.0% of residents speak other language at home 8 100.0% Speak English very well
English speakers - Foreign-born 38.3% of residents of Agua Dulce speak English at home.
55.1% of residents speak Spanish at home 100 44.2% Speak English very well126 55.8% Speak English less than very well8.0% of residents speak other language at home 33 100.0% Speak English less than very well
White (Caucasian) - Speak only English Native:
95.7% (2,341)Foreign-born:
76.9% (72)
White (Caucasian) - Speak another language Native:
6.5% (158)Foreign-born:
39.0% (36)
Asian - Speak only English Native:
54.6% (10)Foreign-born:
80.9% (61)
Asian - Speak another language Native:
45.2% (9)Foreign-born:
26.7% (20)
Other race - Speak only English Native:
18.4% (14)Foreign-born:
4.2% (9)
Other race - Speak another language Native:
79.7% (62)Foreign-born:
95.4% (194)
White alone - Speak only English Native:
97.9% (2,299)Foreign-born:
75.9% (50)
White alone - Speak another language Native:
1.9% (45)Foreign-born:
21.2% (14)
Hispanic or Latino - Speak only English Native:
41.2% (179)Foreign-born:
16.7% (43)
Hispanic or Latino - Speak another language Native:
58.8% (255)Foreign-born:
85.7% (222)
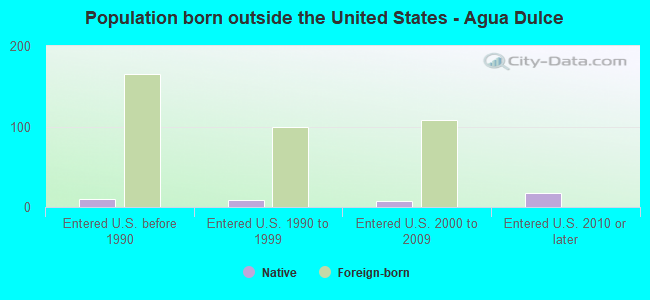
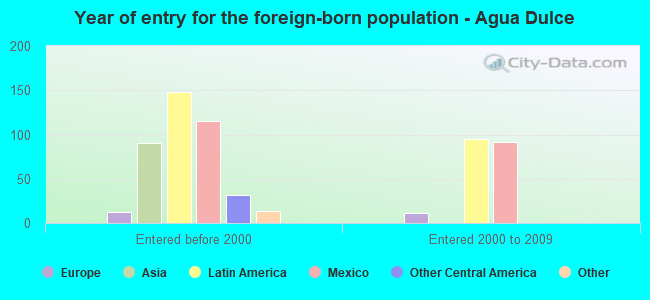
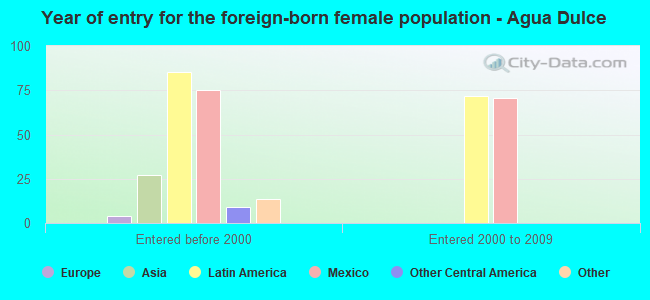
Foreign-born residents in Agua Dulce
Marital status for residents in Agua Dulce Marital status - White (Caucasian) population 15 years and over
Males 19.5% Never married64.4% Now married1.7% Separated1.6% Widowed12.7% DivorcedFemales 21.6% Never married65.1% Now married0.7% Separated6.9% Widowed5.7% DivorcedWomen who gave birth in the past 12 months Now married:
85.2% (41)Unmarried:
14.8% (7)
Women who did not give birth in the past 12 months Now married:
50.0% (230)Unmarried:
50.0% (230)
Marital status - American Indian / Alaska Native population 15 years and over
Males 100.0% Never married0.0% Now married0.0% Separated0.0% Widowed0.0% DivorcedFemales 100.0% Never married0.0% Now married0.0% Separated0.0% Widowed0.0% DivorcedMarital status - Asian population 15 years and over
Males 43.2% Never married22.7% Now married0.0% Separated0.0% Widowed34.1% DivorcedFemales 0.0% Never married40.4% Now married0.0% Separated0.0% Widowed59.6% DivorcedWomen who did not give birth in the past 12 months Now married:
0.0% (0)Unmarried:
100.0% (8)
Marital status - Other race population 15 years and over
Males 19.0% Never married81.0% Now married0.0% Separated0.0% Widowed0.0% DivorcedFemales 27.5% Never married72.5% Now married0.0% Separated0.0% Widowed0.0% DivorcedWomen who did not give birth in the past 12 months Now married:
70.6% (78)Unmarried:
29.4% (32)
Marital status - Two or more races population 15 years and over
Males 69.0% Never married31.0% Now married0.0% Separated0.0% Widowed0.0% DivorcedFemales 38.1% Never married61.9% Now married0.0% Separated0.0% Widowed0.0% DivorcedWomen who did not give birth in the past 12 months Now married:
61.9% (38)Unmarried:
38.1% (24)
Marital status - White alone, not Hispanic / Latino population 15 years and over
Males 18.2% Never married63.8% Now married2.0% Separated1.9% Widowed14.0% DivorcedFemales 21.9% Never married64.4% Now married0.8% Separated7.8% Widowed5.2% DivorcedWomen who gave birth in the past 12 months Now married:
100.0% (47)Unmarried:
0.0% (0)
Women who did not give birth in the past 12 months Now married:
46.8% (218)Unmarried:
53.2% (248)
Marital status - Hispanic or Latino population 15 years and over
Males 28.2% Never married68.7% Now married0.0% Separated0.0% Widowed3.2% DivorcedFemales 22.4% Never married72.0% Now married0.0% Separated0.0% Widowed5.6% DivorcedWomen who gave birth in the past 12 months Now married:
0.0% (0)Unmarried:
100.0% (9)
Women who did not give birth in the past 12 months Now married:
72.3% (133)Unmarried:
27.7% (51)
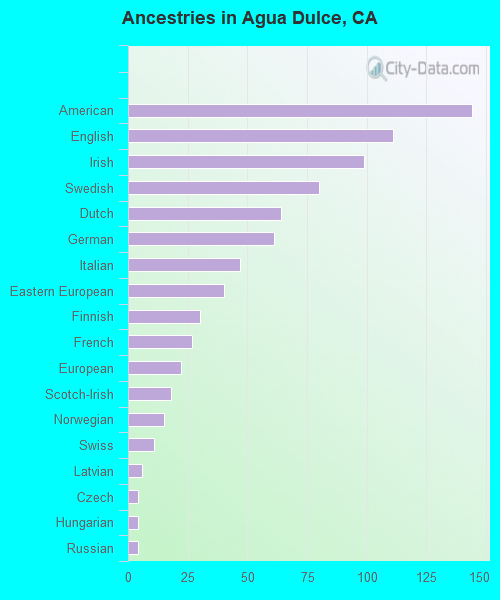
Ancestries in Agua Dulce
144 8.6% American111 6.6% English99 5.9% Irish80 4.8% Swedish64 3.8% Dutch61 3.6% German47 2.8% Italian40 2.4% Eastern European30 1.8% Finnish27 1.6% French22 1.3% European18 1.1% Scotch-Irish15 0.9% Norwegian11 0.7% Swiss6 0.4% Latvian4 0.2% Czech4 0.2% Hungarian4 0.2% Russian
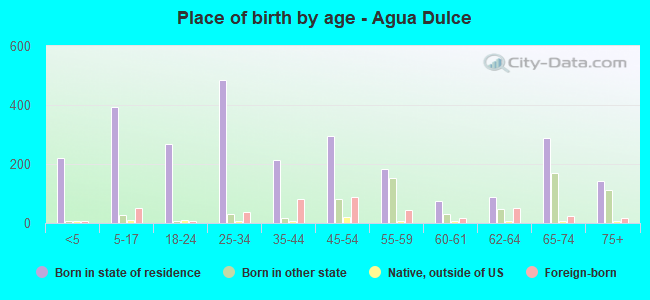
Children Nativity (place of birth) in Agua Dulce
Children under 6 years - Living with two parents Both parents native 152 100.0% NativeBoth parents foreign-born 50 100.0% NativeOne native, one foreign-born parent 14 100.0% NativeChildren under 6 years - Living with one parent Native parent 16 100.0% NativeChildren 6 to 17 years - Living with two parents Both parents native 168 100.0% NativeBoth parents foreign-born 50 50.7% Native49 49.3% Foreign-bornOne native, one foreign-born parent 50 100.0% NativeChildren 6 to 17 years - Living with one parent Native parent 74 100.0% Native
Grandparents responsible for own grandchildren in Agua Dulce
Grandparents (30 to 59 years) White / Caucasian 67 100.0% Not responsible for grandchildrenWhite alone, not Hispanic / Latino 60 100.0% Not responsible for grandchildrenHispanic or Latino 8 100.0% Not responsible for grandchildrenGrandparents (60 years and over) White / Caucasian 27 39.1% Responsible for grandchildren43 60.9% Not responsible for grandchildrenWhite alone, not Hispanic / Latino 34 50.9% Responsible for grandchildren32 49.1% Not responsible for grandchildrenHispanic or Latino 25 100.0% Not responsible for grandchildren