Races in Alford, Massachusetts (MA) Detailed Stats
Ancestries, Foreign-born residents, place of birth

Recent posts about races in Alford, Massachusetts on our local forum with over 2,400,000 registered users:
 | Is it possible to escape hunters, ATVs and noise in a rural area? (278 replies) |
| Mattapan (25 replies) |
| Fisher cat in MA? (65 replies) |
4.5% of Alford, MA residents are foreign-born (4.5% born in Europe), which is 299.0% less than the foreign-born rate of 18.0% across the entire state of Massachusetts.
Race distribution in Alford

- 39599.0%White alone
- 30.8%Black alone
- 10.3%Two or more races
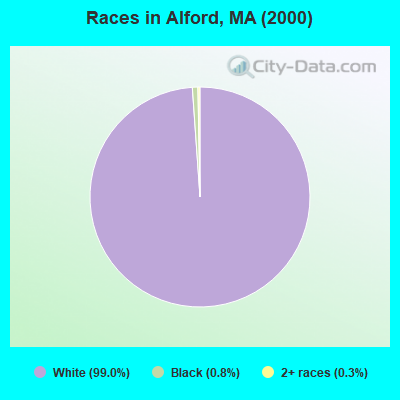
2000
2022
-
- 5,198,35981.9%White alone
- 428,7296.8%Hispanic
- 318,3295.0%Black alone
- 236,7863.7%Asian alone
- 110,3381.7%Two or more races
- 43,5860.7%Other race alone
- 11,2640.2%American Indian alone
- 1,7060.03%Native Hawaiian and Other
Pacific Islander alone

-
- 4,676,62767.0%White alone
- 911,03813.0%Hispanic
- 501,4637.2%Asian alone
- 459,7406.6%Black alone
- 341,8894.9%Two or more races
- 84,4031.2%Other race alone
- 5,8380.08%American Indian alone
- 9760.01%Native Hawaiian and Other
Pacific Islander alone

Income and house value in Alford
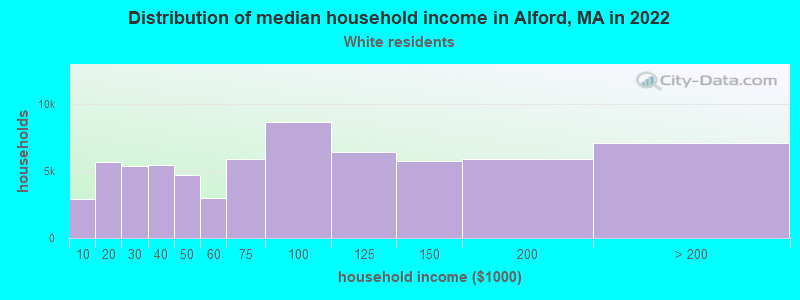
- Median household income in 2022
- $97,278White non-Hispanic householders
- Median 2022 house value
- $711,068White Non-Hispanic householders
Household income for White non-Hispanic householders
Foreign-born residents in Alford
18 residents are foreign born (4.5% Europe).
| This city: | 4.5% |
| Massachusetts: | 12.2% |
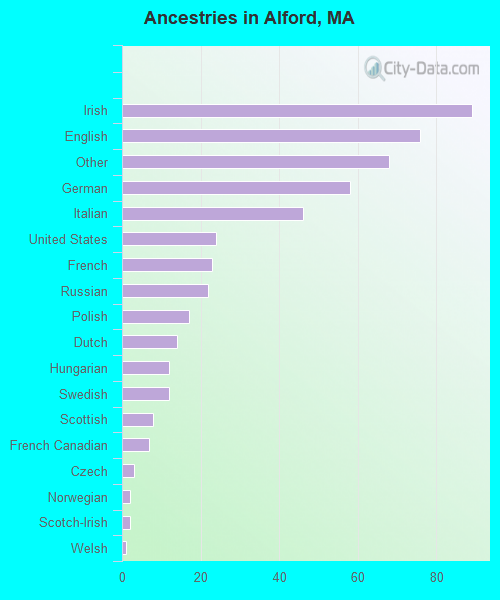
Ancestries in Alford

- 8918.4%Irish
- 7615.7%English
- 6814.0%Other
- 5812.0%German
- 469.5%Italian
- 245.0%United States
- 234.8%French
- 224.5%Russian
- 173.5%Polish
- 142.9%Dutch
- 122.5%Hungarian
- 122.5%Swedish
- 81.7%Scottish
- 71.4%French Canadian
- 30.6%Czech
- 20.4%Norwegian
- 20.4%Scotch-Irish
- 10.2%Welsh
Zip codes: 01230.