Races in Alum Rock, California (CA) Detailed Stats
Data:
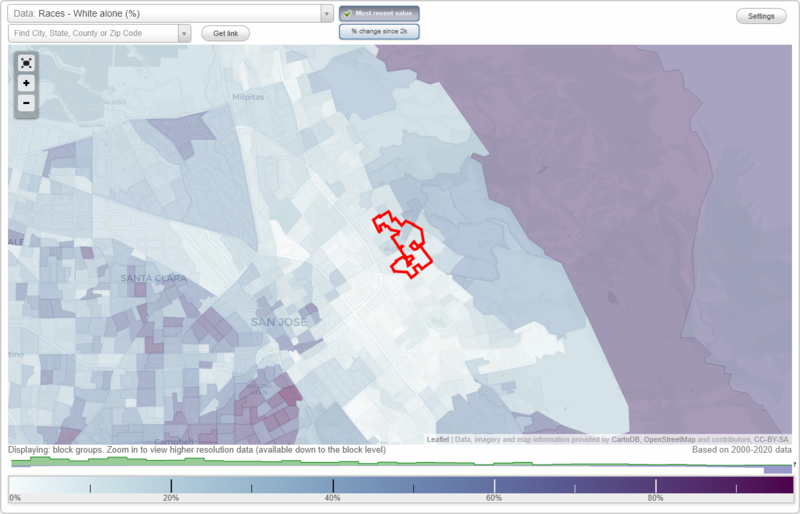
Races - White alone (%)
Races - White alone (% change since 2000)
Races - Black alone (%)
Races - Black alone (% change since 2000)
Races - American Indian alone (%)
Races - American Indian alone (% change since 2000)
Races - Asian alone (%)
Races - Asian alone (% change since 2000)
Races - Hispanic (%)
Races - Hispanic (% change since 2000)
Races - Native Hawaiian and Other Pacific Islander alone (%)
Races - Native Hawaiian and Other Pacific Islander alone (% change since 2000)
Races - Two or more races(%)
Races - Two or more races(% change since 2000)
Races - Other race alone (%)
Races - Other race alone (% change since 2000)
Racial diversity
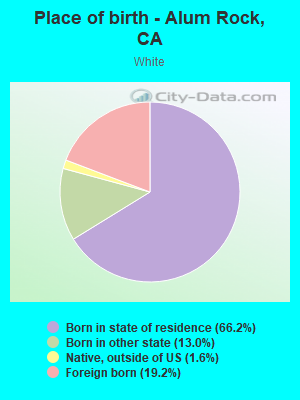
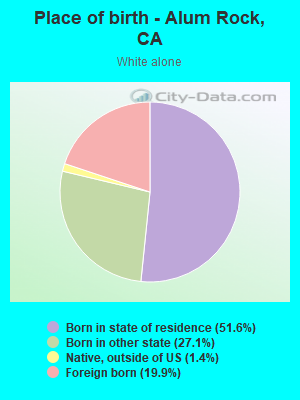
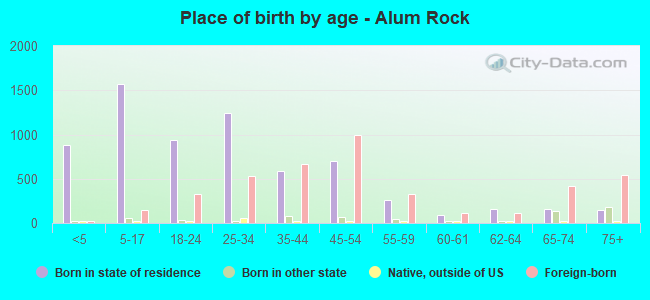
Place of birth - Born in state of residence (%)
Place of birth - Born in state of residence (%) - White
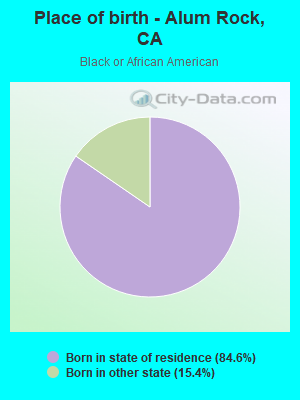
Place of birth - Born in state of residence (%) - Black or African American
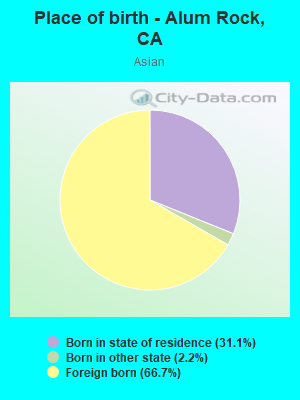
Place of birth - Born in state of residence (%) - Asian
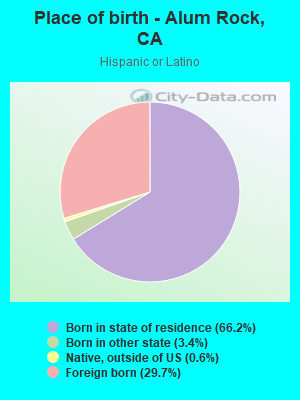
Place of birth - Born in state of residence (%) - Hispanic or Latino
Place of birth - Born in state of residence (%) - American Indian and Alaska Native
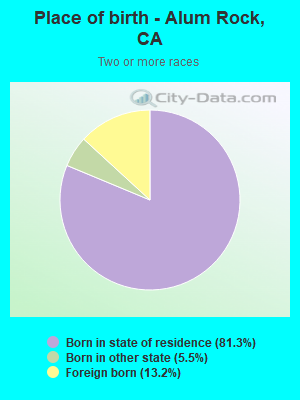
Place of birth - Born in state of residence (%) - Multirace
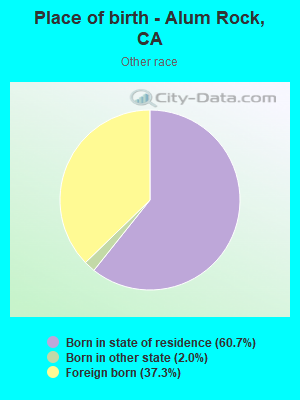
Place of birth - Born in state of residence (%) - Other Race
Place of birth - Born in other state (%)
Place of birth - Born in other state (%) - White
Place of birth - Born in other state (%) - Black or African American
Place of birth - Born in other state (%) - Asian
Place of birth - Born in other state (%) - Hispanic or Latino
Place of birth - Born in other state (%) - American Indian and Alaska Native
Place of birth - Born in other state (%) - Multirace
Place of birth - Born in other state (%) - Other Race
Place of birth - Native, outside of US (%)
Place of birth - Native, outside of US (%) - White
Place of birth - Native, outside of US (%) - Black or African American
Place of birth - Native, outside of US (%) - Asian
Place of birth - Native, outside of US (%) - Hispanic or Latino
Place of birth - Native, outside of US (%) - American Indian and Alaska Native
Place of birth - Native, outside of US (%) - Multirace
Place of birth - Native, outside of US (%) - Other Race
Place of birth - Foreign born (%)
Place of birth - Foreign born (%) - White
Place of birth - Foreign born (%) - Black or African American
Place of birth - Foreign born (%) - Asian
Place of birth - Foreign born (%) - Hispanic or Latino
Place of birth - Foreign born (%) - American Indian and Alaska Native
Place of birth - Foreign born (%) - Multirace
Place of birth - Foreign born (%) - Other Race
Residents speaking English at home (%)
Residents speaking English at home - Born in the United States (%)
Residents speaking English at home - Native, born elsewhere (%)
Residents speaking English at home - Foreign born (%)
Residents speaking Spanish at home (%)
Residents speaking Spanish at home - Born in the United States (%)
Residents speaking Spanish at home - Native, born elsewhere (%)
Residents speaking Spanish at home - Foreign born (%)
Residents speaking other language at home (%)
Residents speaking other language at home - Born in the United States (%)
Residents speaking other language at home - Native, born elsewhere (%)
Residents speaking other language at home - Foreign born (%)
Marital status - Never married (%)
Marital status - Now married (%)
Marital status - Separated (%)
Marital status - Widowed (%)
Marital status - Divorced (%)
Ancestries Reported - Arab (%)
Ancestries Reported - Czech (%)
Ancestries Reported - Danish (%)
Ancestries Reported - Dutch (%)
Ancestries Reported - English (%)
Ancestries Reported - French (%)
Ancestries Reported - French Canadian (%)
Ancestries Reported - German (%)
Ancestries Reported - Greek (%)
Ancestries Reported - Hungarian (%)
Ancestries Reported - Irish (%)
Ancestries Reported - Italian (%)
Ancestries Reported - Lithuanian (%)
Ancestries Reported - Norwegian (%)
Ancestries Reported - Polish (%)
Ancestries Reported - Portuguese (%)
Ancestries Reported - Russian (%)
Ancestries Reported - Scotch-Irish (%)
Ancestries Reported - Scottish (%)
Ancestries Reported - Slovak (%)
Ancestries Reported - Subsaharan African (%)
Ancestries Reported - Swedish (%)
Ancestries Reported - Swiss (%)
Ancestries Reported - Ukrainian (%)
Ancestries Reported - United States (%)
Ancestries Reported - Welsh (%)
Ancestries Reported - West Indian (%)
Ancestries Reported - Other (%)
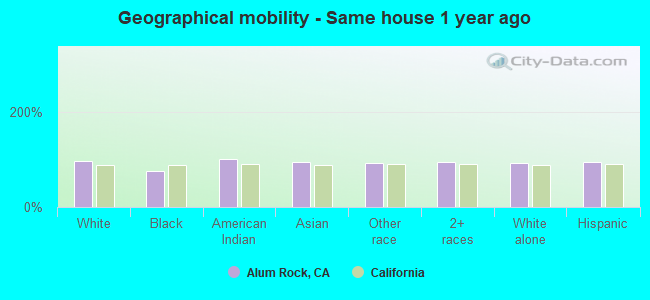
Geographical mobility - Same house 1 year ago (%)
Geographical mobility - Same house 1 year ago (%) - White
Geographical mobility - Same house 1 year ago (%) - Black or African American
Geographical mobility - Same house 1 year ago (%) - Asian
Geographical mobility - Same house 1 year ago (%) - Hispanic or Latino
Geographical mobility - Same house 1 year ago (%) - American Indian and Alaska Native
Geographical mobility - Same house 1 year ago (%) - Multirace
Geographical mobility - Same house 1 year ago (%) - Other Race
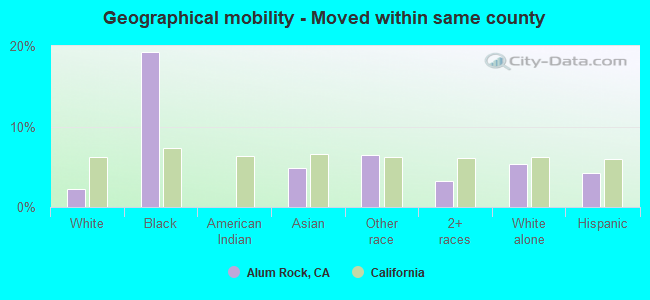
Geographical mobility - Moved within same county (%)
Geographical mobility - Moved within same county (%) - White
Geographical mobility - Moved within same county (%) - Black or African American
Geographical mobility - Moved within same county (%) - Asian
Geographical mobility - Moved within same county (%) - Hispanic or Latino
Geographical mobility - Moved within same county (%) - American Indian and Alaska Native
Geographical mobility - Moved within same county (%) - Multirace
Geographical mobility - Moved within same county (%) - Other Race
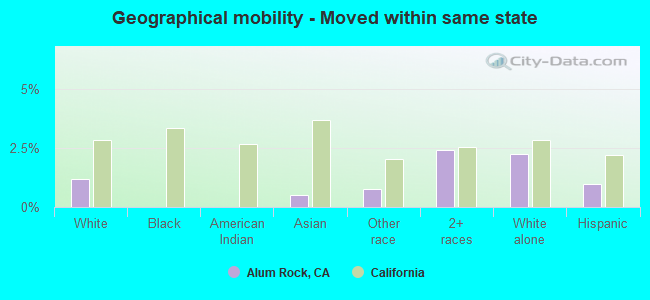
Geographical mobility - Moved from different county within same state (%)
Geographical mobility - Moved from different county within same state (%) - White
Geographical mobility - Moved from different county within same state (%) - Black or African American
Geographical mobility - Moved from different county within same state (%) - Asian
Geographical mobility - Moved from different county within same state (%) - Hispanic or Latino
Geographical mobility - Moved from different county within same state (%) - American Indian and Alaska Native
Geographical mobility - Moved from different county within same state (%) - Multirace
Geographical mobility - Moved from different county within same state (%) - Other Race
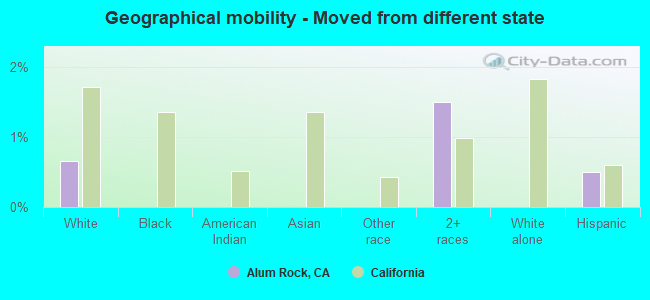
Geographical mobility - Moved from different state (%)
Geographical mobility - Moved from different state (%) - White
Geographical mobility - Moved from different state (%) - Black or African American
Geographical mobility - Moved from different state (%) - Asian
Geographical mobility - Moved from different state (%) - Hispanic or Latino
Geographical mobility - Moved from different state (%) - American Indian and Alaska Native
Geographical mobility - Moved from different state (%) - Multirace
Geographical mobility - Moved from different state (%) - Other Race
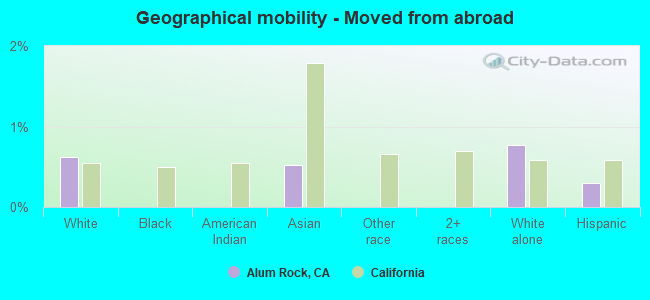
Geographical mobility - Moved from abroad (%)
Geographical mobility - Moved from abroad (%) - White
Geographical mobility - Moved from abroad (%) - Black or African American
Geographical mobility - Moved from abroad (%) - Asian
Geographical mobility - Moved from abroad (%) - Hispanic or Latino
Geographical mobility - Moved from abroad (%) - American Indian and Alaska Native
Geographical mobility - Moved from abroad (%) - Multirace
Geographical mobility - Moved from abroad (%) - Other Race
Place of birth for the foreign-born population - Ireland (%)
Place of birth for the foreign-born population - Denmark (%)
Place of birth for the foreign-born population - Norway (%)
Place of birth for the foreign-born population - Sweden (%)
Place of birth for the foreign-born population - United Kingdom (%)
Place of birth for the foreign-born population - England (%)
Place of birth for the foreign-born population - Scotland (%)
Place of birth for the foreign-born population - Other Northern Europe (%)
Place of birth for the foreign-born population - Austria (%)
Place of birth for the foreign-born population - Belgium (%)
Place of birth for the foreign-born population - France (%)
Place of birth for the foreign-born population - Germany (%)
Place of birth for the foreign-born population - Netherlands (%)
Place of birth for the foreign-born population - Switzerland (%)
Place of birth for the foreign-born population - Other Western Europe (%)
Place of birth for the foreign-born population - Greece (%)
Place of birth for the foreign-born population - Italy (%)
Place of birth for the foreign-born population - Portugal (%)
Place of birth for the foreign-born population - Spain (%)
Place of birth for the foreign-born population - Other Southern Europe (%)
Place of birth for the foreign-born population - Albania (%)
Place of birth for the foreign-born population - Belarus (%)
Place of birth for the foreign-born population - Bosnia and Herzegovina (%)
Place of birth for the foreign-born population - Bulgaria (%)
Place of birth for the foreign-born population - Croatia (%)
Place of birth for the foreign-born population - Czechoslovakia (%)
Place of birth for the foreign-born population - Hungary (%)
Place of birth for the foreign-born population - Latvia (%)
Place of birth for the foreign-born population - Lithuania (%)
Place of birth for the foreign-born population - North Macedonia (Macedonia) (%)
Place of birth for the foreign-born population - Moldova (%)
Place of birth for the foreign-born population - Poland (%)
Place of birth for the foreign-born population - Romania (%)
Place of birth for the foreign-born population - Russia (%)
Place of birth for the foreign-born population - Serbia (%)
Place of birth for the foreign-born population - Ukraine (%)
Place of birth for the foreign-born population - Other Eastern Europe (%)
Place of birth for the foreign-born population - China (%)
Place of birth for the foreign-born population - Hong Kong (%)
Place of birth for the foreign-born population - Taiwan (%)
Place of birth for the foreign-born population - Japan (%)
Place of birth for the foreign-born population - Korea (%)
Place of birth for the foreign-born population - Other Eastern Asia (%)
Place of birth for the foreign-born population - Afghanistan (%)
Place of birth for the foreign-born population - Bangladesh (%)
Place of birth for the foreign-born population - India (%)
Place of birth for the foreign-born population - Iran (%)
Place of birth for the foreign-born population - Kazakhstan (%)
Place of birth for the foreign-born population - Nepal (%)
Place of birth for the foreign-born population - Pakistan (%)
Place of birth for the foreign-born population - Sri Lanka (%)
Place of birth for the foreign-born population - Uzbekistan (%)
Place of birth for the foreign-born population - Other South Central Asia (%)
Place of birth for the foreign-born population - Burma (%)
Place of birth for the foreign-born population - Cambodia (%)
Place of birth for the foreign-born population - Indonesia (%)
Place of birth for the foreign-born population - Laos (%)
Place of birth for the foreign-born population - Malaysia (%)
Place of birth for the foreign-born population - Philippines (%)
Place of birth for the foreign-born population - Singapore (%)
Place of birth for the foreign-born population - Thailand (%)
Place of birth for the foreign-born population - Vietnam (%)
Place of birth for the foreign-born population - Other South Eastern Asia (%)
Place of birth for the foreign-born population - Armenia (%)
Place of birth for the foreign-born population - Iraq (%)
Place of birth for the foreign-born population - Israel (%)
Place of birth for the foreign-born population - Jordan (%)
Place of birth for the foreign-born population - Kuwait (%)
Place of birth for the foreign-born population - Lebanon (%)
Place of birth for the foreign-born population - Saudi Arabia (%)
Place of birth for the foreign-born population - Syria (%)
Place of birth for the foreign-born population - Turkey (%)
Place of birth for the foreign-born population - Yemen (%)
Place of birth for the foreign-born population - Other Western Asia (%)
Place of birth for the foreign-born population - Eritrea (%)
Place of birth for the foreign-born population - Ethiopia (%)
Place of birth for the foreign-born population - Kenya (%)
Place of birth for the foreign-born population - Somalia (%)
Place of birth for the foreign-born population - Uganda (%)
Place of birth for the foreign-born population - Zimbabwe (%)
Place of birth for the foreign-born population - Other Eastern Africa (%)
Place of birth for the foreign-born population - Cameroon (%)
Place of birth for the foreign-born population - Congo (%)
Place of birth for the foreign-born population - Democratic Republic of Congo (Zaire) (%)
Place of birth for the foreign-born population - Other Middle Africa (%)
Place of birth for the foreign-born population - Egypt (%)
Place of birth for the foreign-born population - Morocco (%)
Place of birth for the foreign-born population - Sudan (%)
Place of birth for the foreign-born population - Other Northern Africa (%)
Place of birth for the foreign-born population - South Africa (%)
Place of birth for the foreign-born population - Other Southern Africa (%)
Place of birth for the foreign-born population - Cabo Verde (%)
Place of birth for the foreign-born population - Ghana (%)
Place of birth for the foreign-born population - Liberia (%)
Place of birth for the foreign-born population - Nigeria (%)
Place of birth for the foreign-born population - Senegal (%)
Place of birth for the foreign-born population - Sierra Leone (%)
Place of birth for the foreign-born population - Other Western Africa (%)
Place of birth for the foreign-born population - Australia (%)
Place of birth for the foreign-born population - New Zealand (%)
Place of birth for the foreign-born population - Fiji (%)
Place of birth for the foreign-born population - Micronesia (%)
Place of birth for the foreign-born population - Bahamas (%)
Place of birth for the foreign-born population - Barbados (%)
Place of birth for the foreign-born population - Cuba (%)
Place of birth for the foreign-born population - Dominica (%)
Place of birth for the foreign-born population - Dominican Republic (%)
Place of birth for the foreign-born population - Grenada (%)
Place of birth for the foreign-born population - Haiti (%)
Place of birth for the foreign-born population - Jamaica (%)
Place of birth for the foreign-born population - St. Vincent and the Grenadines (%)
Place of birth for the foreign-born population - Trinidad and Tobago (%)
Place of birth for the foreign-born population - West Indies (%)
Place of birth for the foreign-born population - Other Caribbean (%)
Place of birth for the foreign-born population - Belize (%)
Place of birth for the foreign-born population - Costa Rica (%)
Place of birth for the foreign-born population - El Salvador (%)
Place of birth for the foreign-born population - Guatemala (%)
Place of birth for the foreign-born population - Honduras (%)
Place of birth for the foreign-born population - Mexico (%)
Place of birth for the foreign-born population - Nicaragua (%)
Place of birth for the foreign-born population - Panama (%)
Place of birth for the foreign-born population - Other Central America (%)
Place of birth for the foreign-born population - Argentina (%)
Place of birth for the foreign-born population - Bolivia (%)
Place of birth for the foreign-born population - Brazil (%)
Place of birth for the foreign-born population - Chile (%)
Place of birth for the foreign-born population - Colombia (%)
Place of birth for the foreign-born population - Ecuador (%)
Place of birth for the foreign-born population - Guyana (%)
Place of birth for the foreign-born population - Peru (%)
Place of birth for the foreign-born population - Uruguay (%)
Place of birth for the foreign-born population - Venezuela (%)
Place of birth for the foreign-born population - Other South America (%)
Place of birth for the foreign-born population - Canada (%)
Place of birth for the foreign-born population - Other Northern America (%)
Place of birth for the foreign-born population - Other (%)
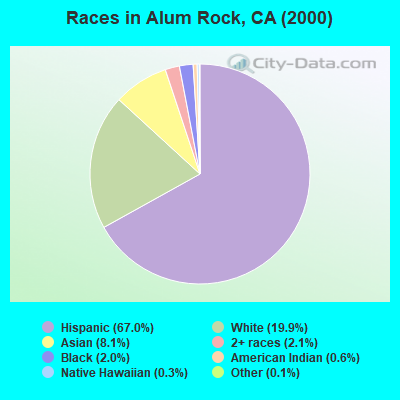
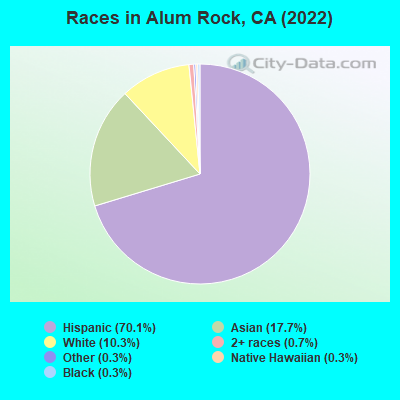
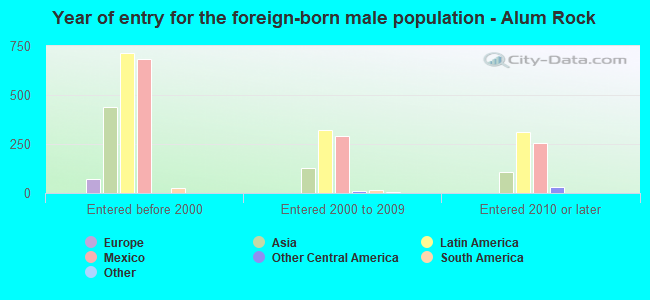
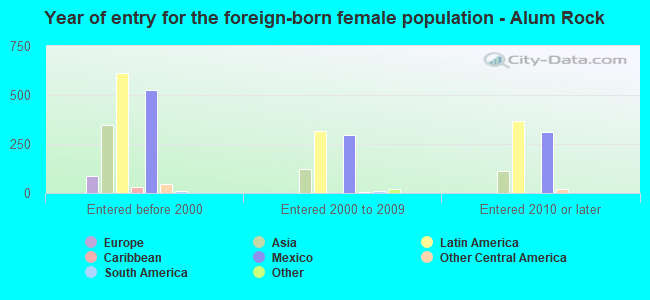
According to 2022 data, the most numerous races in Alum Rock, CA are Hispanic (8,285 residents), White alone (943 residents), and Asian alone (1,994 residents). 35.7% of Alum Rock residents speak English at home. 35.7% of Alum Rock, CA residents are foreign-born (22.4% born in Latin America, 11.0% born in Asia), which is 27.1% greater than the foreign-born rate of 26.0% across the entire state of California.
Race distribution in Alum Rock
2000 2022
15,816,790 46.7% White alone 10,966,556 32.4% Hispanic 3,648,860 10.8% Asian alone 2,181,926 6.4% Black alone 903,115 2.7% Two or more races 178,984 0.5% American Indian alone 103,736 0.3% Native Hawaiian and Other 71,681 0.2% Other race alone
15,732,184 40.3% Hispanic 13,160,426 33.7% White alone 5,957,867 15.3% Asian alone 2,025,218 5.2% Black alone 1,663,222 4.3% Two or more races 251,618 0.6% Other race alone 135,777 0.3% Native Hawaiian and Other 103,030 0.3% American Indian alone
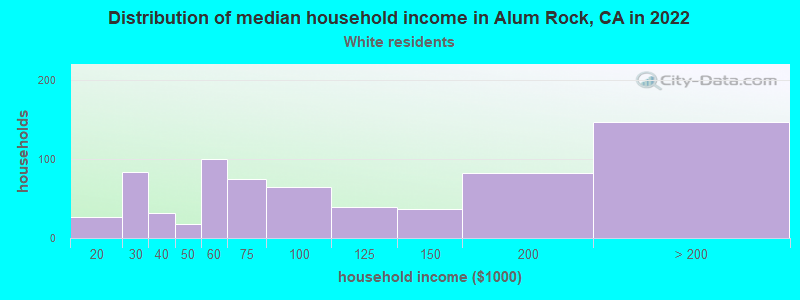
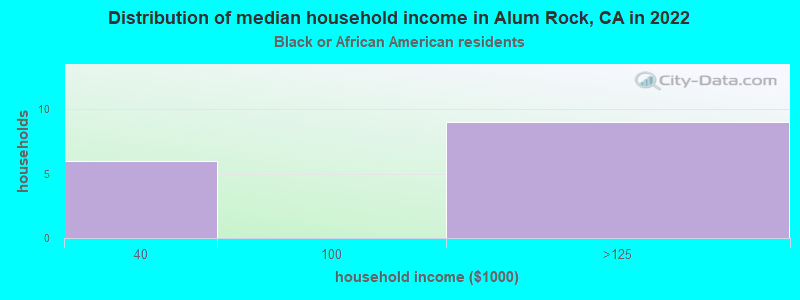
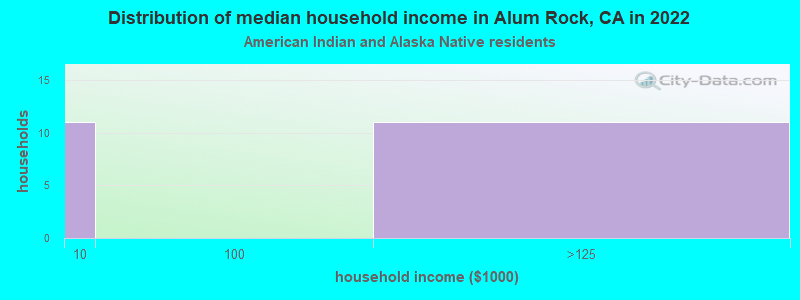
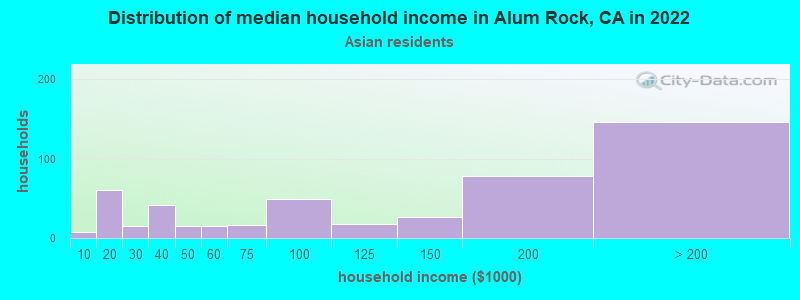
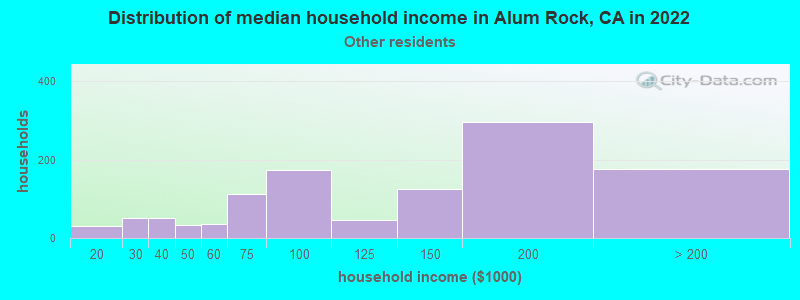
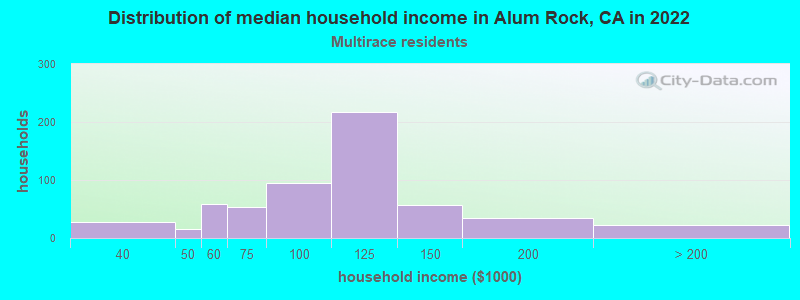
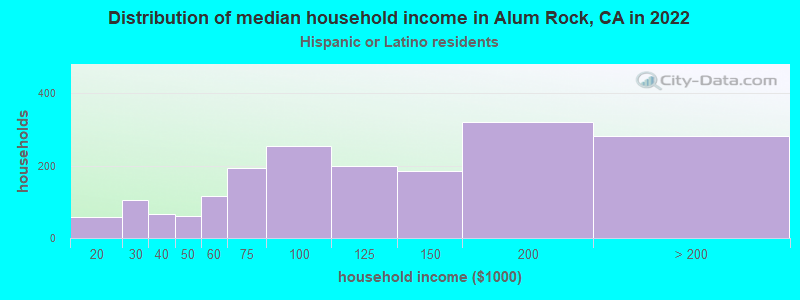
Income and house value in Alum Rock Median household income in 2022 $80,518 White non-Hispanic householders$91,542 Black householders$15,003 American Indian and Alaska Native householders$132,249 Asian householders$124,799 Some other race householdersover $200,000 Two or more races householders$120,923 Hispanic or Latino race householdersMedian 2022 house value $987,286 White Non-Hispanic householders$714,460 Black or African American householders$809,841 American Indian or Alaska Native householders $997,005 Asian householders$991,246 Some other race householdersover $1,000,000 Two or more races householders$991,966 Hispanic or Latino householders
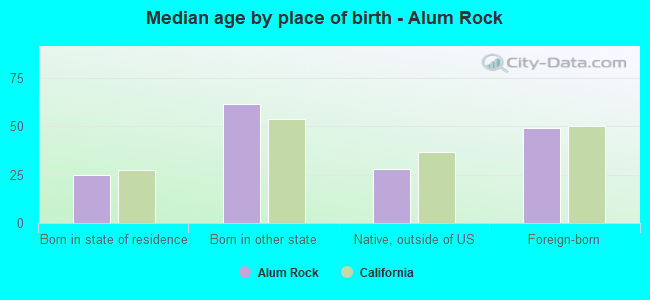
Median age by race in Alum Rock
42.8 Median age for White residents43.7 42.3 40.9 Median age for Black or African American residents50.0 21.0 52.8 Median age for American Indian / Alaska Native residents46.1 Median age for Asian residents43.5 49.6 57.3 Median age for Native Hawaiian / Pacific Islander residents30.4 Median age for Other race residents28.1 32.5 25.6 Median age for Two or more races residents32.6 22.6 56.3 Median age for White alone residents59.0 55.3 31.0 Median age for Hispanic or Latino residents30.5 31.5
Owner/renter occupied households by race in Alum Rock
House owners and renters - White residents 777 88.9% Owner occupied97 11.1% Renter occupiedHouse owners and renters - Black or African American residents 16 23.8% Owner occupied52 76.2% Renter occupiedHouse owners and renters - American Indian / Alaska Native residents 13 35.9% Owner occupied23 64.1% Renter occupiedHouse owners and renters - Asian residents 486 83.1% Owner occupied99 16.9% Renter occupiedHouse owners and renters - Other race residents 493 50.3% Owner occupied487 49.7% Renter occupiedHouse owners and renters - Two or more races residents 188 86.0% Owner occupied31 14.0% Renter occupiedHouse owners and renters - White alone residents 323 90.9% Owner occupied32 9.1% Renter occupiedHouse owners and renters - Hispanic or Latino residents 1,142 66.1% Owner occupied584 33.9% Renter occupied
Language usage in Alum Rock
English speakers - Total 35.7% of residents of Alum Rock speak English at home.
47.5% of residents speak Spanish at home 2,790 55.3% Speak English very well2,259 44.7% Speak English less than very well16.0% of residents speak other language at home 703 41.3% Speak English very well1,000 58.7% Speak English less than very well
English speakers - Born in the United States 61.3% of residents of Alum Rock speak English at home.
32.7% of residents speak Spanish at home 177 83.9% Speak English very well34 16.1% Speak English less than very well6.3% of residents speak other language at home 41 100.0% Speak English very well
English speakers - Native, born elsewhere 98.4% of residents of Alum Rock speak English at home.
1.6% of residents speak Spanish at home 1 100.0% Speak English less than very well
English speakers - Foreign-born 5.1% of residents of Alum Rock speak English at home.
58.8% of residents speak Spanish at home 511 21.5% Speak English very well1,861 78.5% Speak English less than very well34.1% of residents speak other language at home 423 30.7% Speak English very well954 69.3% Speak English less than very well
White (Caucasian) - Speak only English Native:
73.3% (1,659)Foreign-born:
13.4% (79)
White (Caucasian) - Speak another language Native:
25.2% (571)Foreign-born:
86.4% (509)
Asian - Speak only English Native:
56.0% (319)Foreign-born:
6.0% (81)
Asian - Speak another language Native:
43.9% (250)Foreign-born:
93.2% (1,242)
Other race - Speak only English Native:
38.0% (997)Foreign-born:
2.5% (44)
Other race - Speak another language Native:
62.9% (1,650)Foreign-born:
96.3% (1,694)
Two or more races - Speak another language Native:
76.4% (1,006)Foreign-born:
100.0% (232)
White alone - Speak only English Native:
87.6% (610)Foreign-born:
13.6% (29)
White alone - Speak another language Native:
13.0% (90)Foreign-born:
88.7% (186)
Hispanic or Latino - Speak only English Native:
47.9% (2,463)Foreign-born:
3.9% (96)
Hispanic or Latino - Speak another language Native:
52.5% (2,697)Foreign-born:
95.7% (2,339)
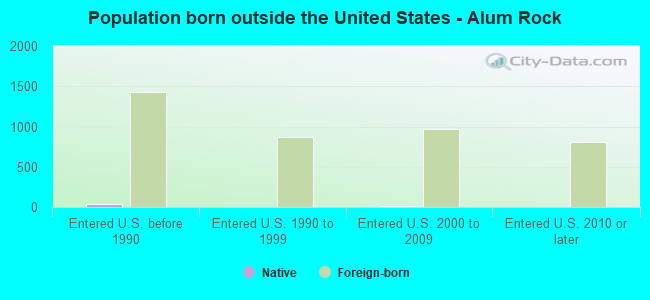
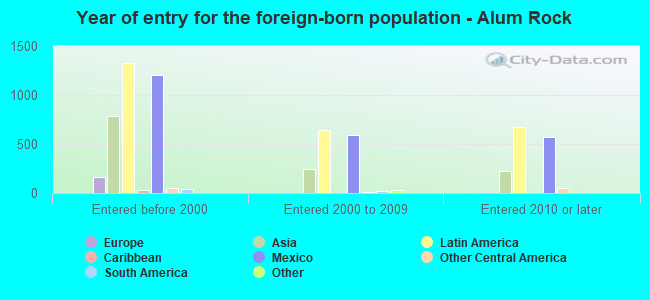
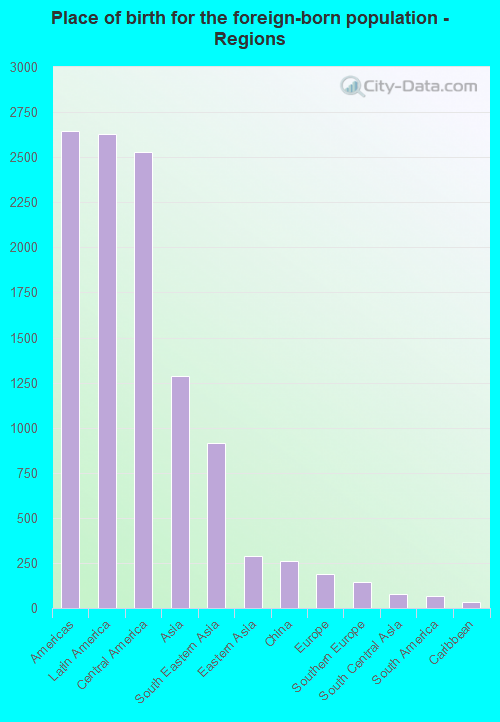
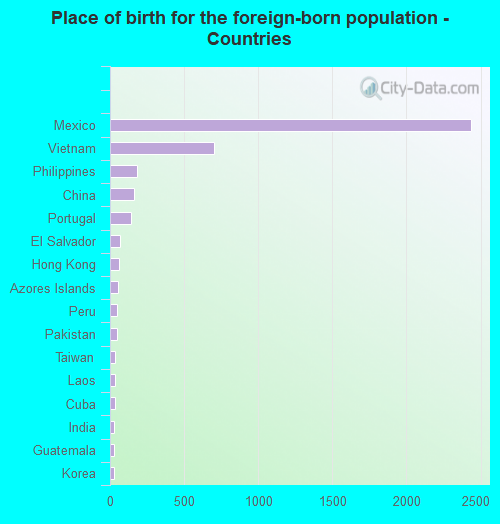
Foreign-born residents in Alum Rock 4,128 residents are foreign born (22.4% Latin America , 11.0% Asia ).
This city:
35.7%California:
100.0%
Marital status for residents in Alum Rock Marital status - White (Caucasian) population 15 years and over
Males 36.3% Never married45.6% Now married0.8% Separated3.9% Widowed13.3% DivorcedFemales 27.0% Never married46.7% Now married2.2% Separated13.8% Widowed10.4% DivorcedWomen who gave birth in the past 12 months Now married:
100.0% (31)Unmarried:
0.0% (0)
Women who did not give birth in the past 12 months Now married:
48.2% (267)Unmarried:
51.8% (287)
Marital status - Black or African American population 15 years and over
Males 17.8% Never married71.2% Now married5.5% Separated0.0% Widowed5.5% DivorcedFemales 55.6% Never married17.3% Now married0.0% Separated4.9% Widowed22.2% DivorcedWomen who did not give birth in the past 12 months Now married:
25.5% (13)Unmarried:
74.5% (38)
Marital status - American Indian / Alaska Native population 15 years and over
Males 0.0% Never married0.0% Now married0.0% Separated0.0% Widowed100.0% DivorcedFemales 27.7% Never married0.0% Now married0.0% Separated0.0% Widowed72.3% DivorcedWomen who did not give birth in the past 12 months Now married:
0.0% (0)Unmarried:
100.0% (49)
Marital status - Asian population 15 years and over
Males 47.3% Never married38.3% Now married0.9% Separated3.4% Widowed10.1% DivorcedFemales 21.0% Never married65.1% Now married1.3% Separated6.7% Widowed5.8% DivorcedWomen who gave birth in the past 12 months Now married:
0.0% (0)Unmarried:
100.0% (5)
Women who did not give birth in the past 12 months Now married:
66.8% (228)Unmarried:
33.2% (114)
Marital status - Other race population 15 years and over
Males 50.7% Never married42.4% Now married1.8% Separated0.7% Widowed4.5% DivorcedFemales 40.1% Never married40.2% Now married6.5% Separated8.1% Widowed5.1% DivorcedWomen who gave birth in the past 12 months Now married:
91.5% (102)Unmarried:
8.5% (9)
Women who did not give birth in the past 12 months Now married:
39.8% (511)Unmarried:
60.2% (774)
Marital status - Two or more races population 15 years and over
Males 73.9% Never married15.8% Now married0.0% Separated0.0% Widowed10.3% DivorcedFemales 69.8% Never married30.2% Now married0.0% Separated0.0% Widowed0.0% DivorcedWomen who gave birth in the past 12 months Now married:
100.0% (34)Unmarried:
0.0% (0)
Women who did not give birth in the past 12 months Now married:
13.5% (68)Unmarried:
86.5% (435)
Marital status - White alone, not Hispanic / Latino population 15 years and over
Males 30.2% Never married50.4% Now married0.0% Separated3.0% Widowed16.5% DivorcedFemales 19.5% Never married45.2% Now married1.3% Separated27.0% Widowed7.0% DivorcedWomen who did not give birth in the past 12 months Now married:
66.1% (71)Unmarried:
33.9% (36)
Marital status - Hispanic or Latino population 15 years and over
Males 46.8% Never married41.9% Now married1.5% Separated2.0% Widowed7.8% DivorcedFemales 38.9% Never married40.8% Now married4.9% Separated8.0% Widowed7.4% DivorcedWomen who gave birth in the past 12 months Now married:
93.6% (145)Unmarried:
6.4% (10)
Women who did not give birth in the past 12 months Now married:
38.6% (787)Unmarried:
61.4% (1,253)
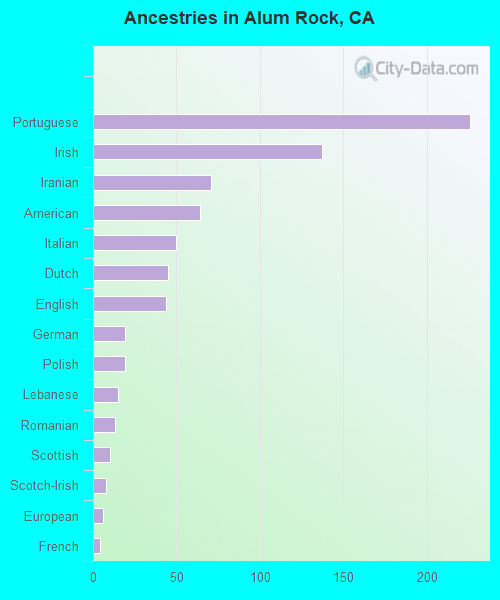
Ancestries in Alum Rock
206 2.4% Portuguese64 0.7% European58 0.7% English53 0.6% American24 0.3% Irish15 0.2% Croatian15 0.2% Dutch12 0.1% German11 0.1% Italian6 0.07% Canadian6 0.07% Swedish4 0.05% Polish4 0.05% Ukrainian3 0.03% Egyptian3 0.03% Czech3 0.03% Greek3 0.03% Iranian3 0.03% Scottish
Children Nativity (place of birth) in Alum Rock
Children under 6 years - Living with two parents Both parents native 233 100.0% NativeBoth parents foreign-born 197 99.7% Native1 0.3% Foreign-bornOne native, one foreign-born parent 250 100.0% NativeChildren under 6 years - Living with one parent Native parent 264 99.8% Native0 0.2% Foreign-bornForeign-born parent 97 70.5% Native41 29.5% Foreign-bornChildren 6 to 17 years - Living with two parents Both parents native 374 100.0% NativeBoth parents foreign-born 383 92.5% Native31 7.5% Foreign-bornOne native, one foreign-born parent 160 100.0% NativeChildren 6 to 17 years - Living with one parent Native parent 179 100.0% NativeForeign-born parent 216 56.8% Native165 43.2% Foreign-born
Grandparents responsible for own grandchildren in Alum Rock
Grandparents (30 to 59 years) White / Caucasian 59 100.0% Not responsible for grandchildrenAsian 5 100.0% Not responsible for grandchildrenOther race 32 100.0% Not responsible for grandchildrenWhite alone, not Hispanic / Latino 5 100.0% Not responsible for grandchildrenHispanic or Latino 107 100.0% Not responsible for grandchildrenGrandparents (60 years and over) White / Caucasian 51 100.0% Not responsible for grandchildrenAsian 49 100.0% Not responsible for grandchildrenOther race 20 13.4% Responsible for grandchildren132 86.6% Not responsible for grandchildrenWhite alone, not Hispanic / Latino 35 100.0% Not responsible for grandchildrenHispanic or Latino 26 13.6% Responsible for grandchildren164 86.4% Not responsible for grandchildren