Races in Anchorage, Alaska (AK) Detailed Stats
Data:
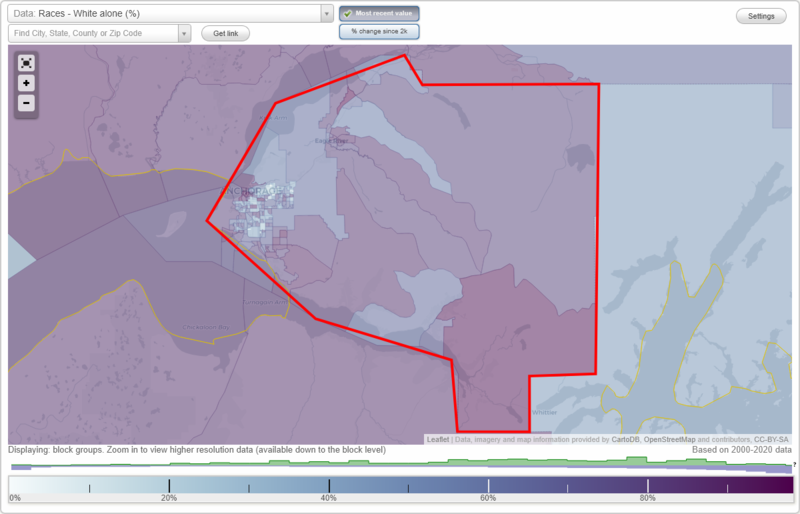
Races - White alone (%)
Races - White alone (% change since 2000)
Races - Black alone (%)
Races - Black alone (% change since 2000)
Races - American Indian alone (%)
Races - American Indian alone (% change since 2000)
Races - Asian alone (%)
Races - Asian alone (% change since 2000)
Races - Hispanic (%)
Races - Hispanic (% change since 2000)
Races - Native Hawaiian and Other Pacific Islander alone (%)
Races - Native Hawaiian and Other Pacific Islander alone (% change since 2000)
Races - Two or more races(%)
Races - Two or more races(% change since 2000)
Races - Other race alone (%)
Races - Other race alone (% change since 2000)
Racial diversity
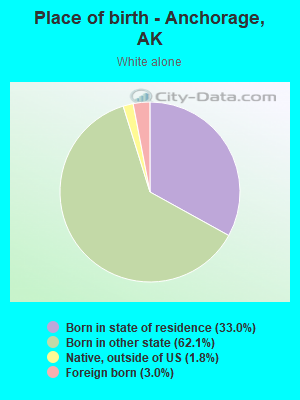
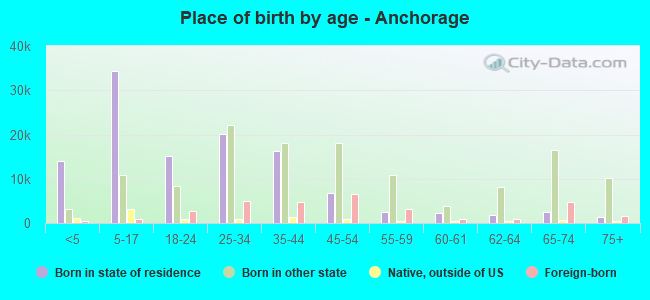
Place of birth - Born in state of residence (%)
Place of birth - Born in state of residence (%) - White
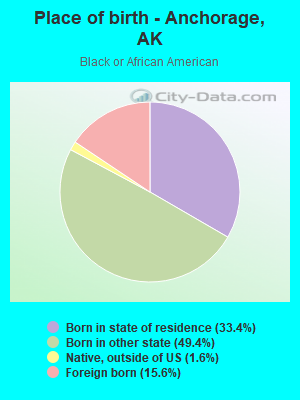
Place of birth - Born in state of residence (%) - Black or African American
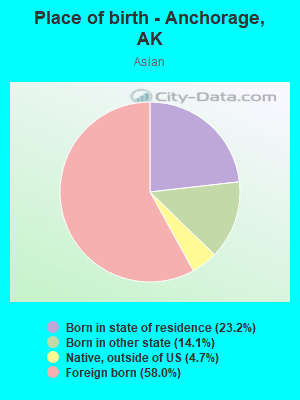
Place of birth - Born in state of residence (%) - Asian
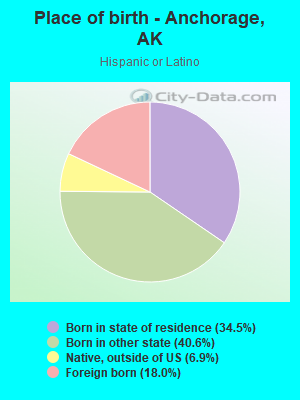
Place of birth - Born in state of residence (%) - Hispanic or Latino
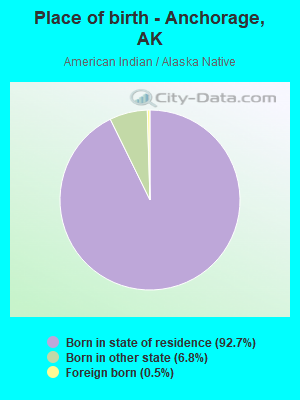
Place of birth - Born in state of residence (%) - American Indian and Alaska Native
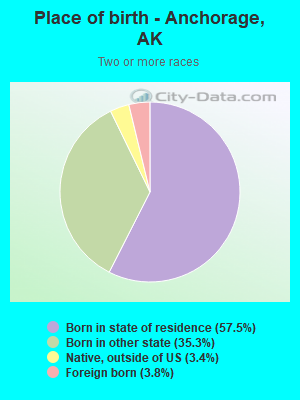
Place of birth - Born in state of residence (%) - Multirace
Place of birth - Born in state of residence (%) - Other Race
Place of birth - Born in other state (%)
Place of birth - Born in other state (%) - White
Place of birth - Born in other state (%) - Black or African American
Place of birth - Born in other state (%) - Asian
Place of birth - Born in other state (%) - Hispanic or Latino
Place of birth - Born in other state (%) - American Indian and Alaska Native
Place of birth - Born in other state (%) - Multirace
Place of birth - Born in other state (%) - Other Race
Place of birth - Native, outside of US (%)
Place of birth - Native, outside of US (%) - White
Place of birth - Native, outside of US (%) - Black or African American
Place of birth - Native, outside of US (%) - Asian
Place of birth - Native, outside of US (%) - Hispanic or Latino
Place of birth - Native, outside of US (%) - American Indian and Alaska Native
Place of birth - Native, outside of US (%) - Multirace
Place of birth - Native, outside of US (%) - Other Race
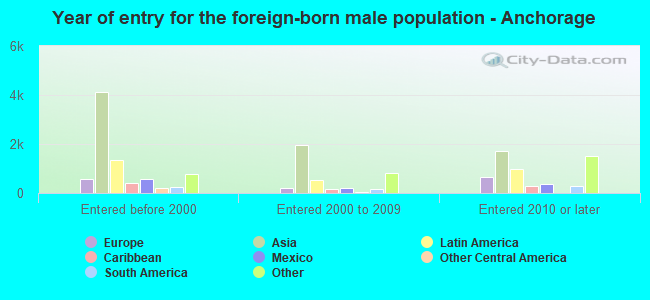
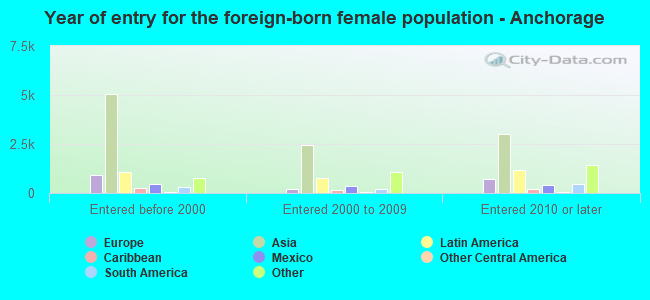
Place of birth - Foreign born (%)
Place of birth - Foreign born (%) - White
Place of birth - Foreign born (%) - Black or African American
Place of birth - Foreign born (%) - Asian
Place of birth - Foreign born (%) - Hispanic or Latino
Place of birth - Foreign born (%) - American Indian and Alaska Native
Place of birth - Foreign born (%) - Multirace
Place of birth - Foreign born (%) - Other Race
Residents speaking English at home (%)
Residents speaking English at home - Born in the United States (%)
Residents speaking English at home - Native, born elsewhere (%)
Residents speaking English at home - Foreign born (%)
Residents speaking Spanish at home (%)
Residents speaking Spanish at home - Born in the United States (%)
Residents speaking Spanish at home - Native, born elsewhere (%)
Residents speaking Spanish at home - Foreign born (%)
Residents speaking other language at home (%)
Residents speaking other language at home - Born in the United States (%)
Residents speaking other language at home - Native, born elsewhere (%)
Residents speaking other language at home - Foreign born (%)
Marital status - Never married (%)
Marital status - Now married (%)
Marital status - Separated (%)
Marital status - Widowed (%)
Marital status - Divorced (%)
Ancestries Reported - Arab (%)
Ancestries Reported - Czech (%)
Ancestries Reported - Danish (%)
Ancestries Reported - Dutch (%)
Ancestries Reported - English (%)
Ancestries Reported - French (%)
Ancestries Reported - French Canadian (%)
Ancestries Reported - German (%)
Ancestries Reported - Greek (%)
Ancestries Reported - Hungarian (%)
Ancestries Reported - Irish (%)
Ancestries Reported - Italian (%)
Ancestries Reported - Lithuanian (%)
Ancestries Reported - Norwegian (%)
Ancestries Reported - Polish (%)
Ancestries Reported - Portuguese (%)
Ancestries Reported - Russian (%)
Ancestries Reported - Scotch-Irish (%)
Ancestries Reported - Scottish (%)
Ancestries Reported - Slovak (%)
Ancestries Reported - Subsaharan African (%)
Ancestries Reported - Swedish (%)
Ancestries Reported - Swiss (%)
Ancestries Reported - Ukrainian (%)
Ancestries Reported - United States (%)
Ancestries Reported - Welsh (%)
Ancestries Reported - West Indian (%)
Ancestries Reported - Other (%)
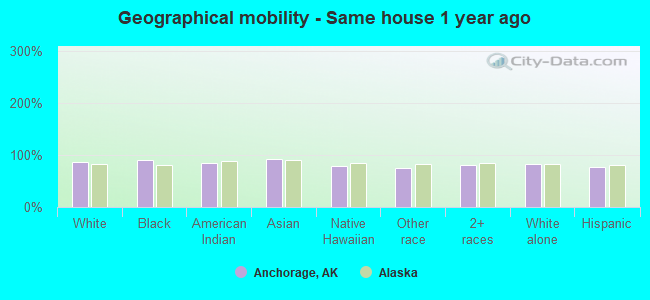
Geographical mobility - Same house 1 year ago (%)
Geographical mobility - Same house 1 year ago (%) - White
Geographical mobility - Same house 1 year ago (%) - Black or African American
Geographical mobility - Same house 1 year ago (%) - Asian
Geographical mobility - Same house 1 year ago (%) - Hispanic or Latino
Geographical mobility - Same house 1 year ago (%) - American Indian and Alaska Native
Geographical mobility - Same house 1 year ago (%) - Multirace
Geographical mobility - Same house 1 year ago (%) - Other Race
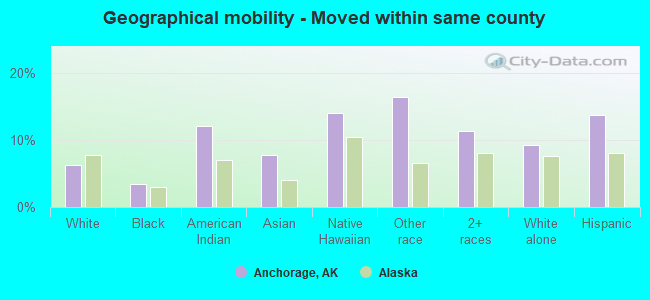
Geographical mobility - Moved within same county (%)
Geographical mobility - Moved within same county (%) - White
Geographical mobility - Moved within same county (%) - Black or African American
Geographical mobility - Moved within same county (%) - Asian
Geographical mobility - Moved within same county (%) - Hispanic or Latino
Geographical mobility - Moved within same county (%) - American Indian and Alaska Native
Geographical mobility - Moved within same county (%) - Multirace
Geographical mobility - Moved within same county (%) - Other Race
Geographical mobility - Moved from different county within same state (%)
Geographical mobility - Moved from different county within same state (%) - White
Geographical mobility - Moved from different county within same state (%) - Black or African American
Geographical mobility - Moved from different county within same state (%) - Asian
Geographical mobility - Moved from different county within same state (%) - Hispanic or Latino
Geographical mobility - Moved from different county within same state (%) - American Indian and Alaska Native
Geographical mobility - Moved from different county within same state (%) - Multirace
Geographical mobility - Moved from different county within same state (%) - Other Race
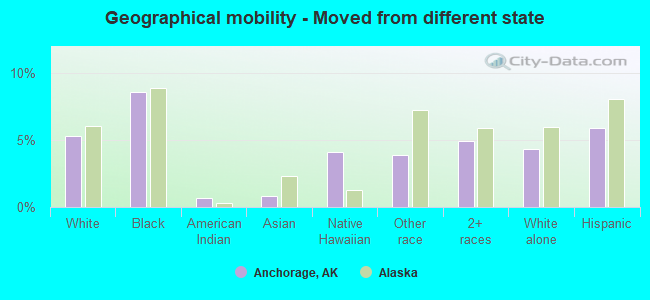
Geographical mobility - Moved from different state (%)
Geographical mobility - Moved from different state (%) - White
Geographical mobility - Moved from different state (%) - Black or African American
Geographical mobility - Moved from different state (%) - Asian
Geographical mobility - Moved from different state (%) - Hispanic or Latino
Geographical mobility - Moved from different state (%) - American Indian and Alaska Native
Geographical mobility - Moved from different state (%) - Multirace
Geographical mobility - Moved from different state (%) - Other Race
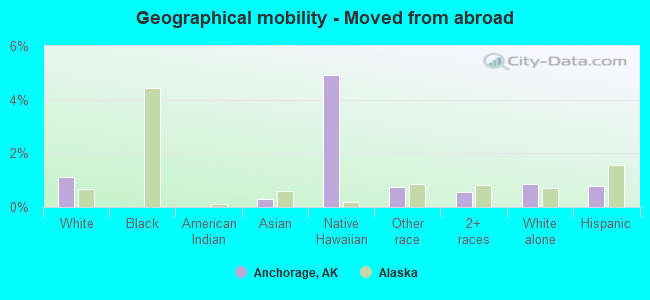
Geographical mobility - Moved from abroad (%)
Geographical mobility - Moved from abroad (%) - White
Geographical mobility - Moved from abroad (%) - Black or African American
Geographical mobility - Moved from abroad (%) - Asian
Geographical mobility - Moved from abroad (%) - Hispanic or Latino
Geographical mobility - Moved from abroad (%) - American Indian and Alaska Native
Geographical mobility - Moved from abroad (%) - Multirace
Geographical mobility - Moved from abroad (%) - Other Race
Place of birth for the foreign-born population - Ireland (%)
Place of birth for the foreign-born population - Denmark (%)
Place of birth for the foreign-born population - Norway (%)
Place of birth for the foreign-born population - Sweden (%)
Place of birth for the foreign-born population - United Kingdom (%)
Place of birth for the foreign-born population - England (%)
Place of birth for the foreign-born population - Scotland (%)
Place of birth for the foreign-born population - Other Northern Europe (%)
Place of birth for the foreign-born population - Austria (%)
Place of birth for the foreign-born population - Belgium (%)
Place of birth for the foreign-born population - France (%)
Place of birth for the foreign-born population - Germany (%)
Place of birth for the foreign-born population - Netherlands (%)
Place of birth for the foreign-born population - Switzerland (%)
Place of birth for the foreign-born population - Other Western Europe (%)
Place of birth for the foreign-born population - Greece (%)
Place of birth for the foreign-born population - Italy (%)
Place of birth for the foreign-born population - Portugal (%)
Place of birth for the foreign-born population - Spain (%)
Place of birth for the foreign-born population - Other Southern Europe (%)
Place of birth for the foreign-born population - Albania (%)
Place of birth for the foreign-born population - Belarus (%)
Place of birth for the foreign-born population - Bosnia and Herzegovina (%)
Place of birth for the foreign-born population - Bulgaria (%)
Place of birth for the foreign-born population - Croatia (%)
Place of birth for the foreign-born population - Czechoslovakia (%)
Place of birth for the foreign-born population - Hungary (%)
Place of birth for the foreign-born population - Latvia (%)
Place of birth for the foreign-born population - Lithuania (%)
Place of birth for the foreign-born population - North Macedonia (Macedonia) (%)
Place of birth for the foreign-born population - Moldova (%)
Place of birth for the foreign-born population - Poland (%)
Place of birth for the foreign-born population - Romania (%)
Place of birth for the foreign-born population - Russia (%)
Place of birth for the foreign-born population - Serbia (%)
Place of birth for the foreign-born population - Ukraine (%)
Place of birth for the foreign-born population - Other Eastern Europe (%)
Place of birth for the foreign-born population - China (%)
Place of birth for the foreign-born population - Hong Kong (%)
Place of birth for the foreign-born population - Taiwan (%)
Place of birth for the foreign-born population - Japan (%)
Place of birth for the foreign-born population - Korea (%)
Place of birth for the foreign-born population - Other Eastern Asia (%)
Place of birth for the foreign-born population - Afghanistan (%)
Place of birth for the foreign-born population - Bangladesh (%)
Place of birth for the foreign-born population - India (%)
Place of birth for the foreign-born population - Iran (%)
Place of birth for the foreign-born population - Kazakhstan (%)
Place of birth for the foreign-born population - Nepal (%)
Place of birth for the foreign-born population - Pakistan (%)
Place of birth for the foreign-born population - Sri Lanka (%)
Place of birth for the foreign-born population - Uzbekistan (%)
Place of birth for the foreign-born population - Other South Central Asia (%)
Place of birth for the foreign-born population - Burma (%)
Place of birth for the foreign-born population - Cambodia (%)
Place of birth for the foreign-born population - Indonesia (%)
Place of birth for the foreign-born population - Laos (%)
Place of birth for the foreign-born population - Malaysia (%)
Place of birth for the foreign-born population - Philippines (%)
Place of birth for the foreign-born population - Singapore (%)
Place of birth for the foreign-born population - Thailand (%)
Place of birth for the foreign-born population - Vietnam (%)
Place of birth for the foreign-born population - Other South Eastern Asia (%)
Place of birth for the foreign-born population - Armenia (%)
Place of birth for the foreign-born population - Iraq (%)
Place of birth for the foreign-born population - Israel (%)
Place of birth for the foreign-born population - Jordan (%)
Place of birth for the foreign-born population - Kuwait (%)
Place of birth for the foreign-born population - Lebanon (%)
Place of birth for the foreign-born population - Saudi Arabia (%)
Place of birth for the foreign-born population - Syria (%)
Place of birth for the foreign-born population - Turkey (%)
Place of birth for the foreign-born population - Yemen (%)
Place of birth for the foreign-born population - Other Western Asia (%)
Place of birth for the foreign-born population - Eritrea (%)
Place of birth for the foreign-born population - Ethiopia (%)
Place of birth for the foreign-born population - Kenya (%)
Place of birth for the foreign-born population - Somalia (%)
Place of birth for the foreign-born population - Uganda (%)
Place of birth for the foreign-born population - Zimbabwe (%)
Place of birth for the foreign-born population - Other Eastern Africa (%)
Place of birth for the foreign-born population - Cameroon (%)
Place of birth for the foreign-born population - Congo (%)
Place of birth for the foreign-born population - Democratic Republic of Congo (Zaire) (%)
Place of birth for the foreign-born population - Other Middle Africa (%)
Place of birth for the foreign-born population - Egypt (%)
Place of birth for the foreign-born population - Morocco (%)
Place of birth for the foreign-born population - Sudan (%)
Place of birth for the foreign-born population - Other Northern Africa (%)
Place of birth for the foreign-born population - South Africa (%)
Place of birth for the foreign-born population - Other Southern Africa (%)
Place of birth for the foreign-born population - Cabo Verde (%)
Place of birth for the foreign-born population - Ghana (%)
Place of birth for the foreign-born population - Liberia (%)
Place of birth for the foreign-born population - Nigeria (%)
Place of birth for the foreign-born population - Senegal (%)
Place of birth for the foreign-born population - Sierra Leone (%)
Place of birth for the foreign-born population - Other Western Africa (%)
Place of birth for the foreign-born population - Australia (%)
Place of birth for the foreign-born population - New Zealand (%)
Place of birth for the foreign-born population - Fiji (%)
Place of birth for the foreign-born population - Micronesia (%)
Place of birth for the foreign-born population - Bahamas (%)
Place of birth for the foreign-born population - Barbados (%)
Place of birth for the foreign-born population - Cuba (%)
Place of birth for the foreign-born population - Dominica (%)
Place of birth for the foreign-born population - Dominican Republic (%)
Place of birth for the foreign-born population - Grenada (%)
Place of birth for the foreign-born population - Haiti (%)
Place of birth for the foreign-born population - Jamaica (%)
Place of birth for the foreign-born population - St. Vincent and the Grenadines (%)
Place of birth for the foreign-born population - Trinidad and Tobago (%)
Place of birth for the foreign-born population - West Indies (%)
Place of birth for the foreign-born population - Other Caribbean (%)
Place of birth for the foreign-born population - Belize (%)
Place of birth for the foreign-born population - Costa Rica (%)
Place of birth for the foreign-born population - El Salvador (%)
Place of birth for the foreign-born population - Guatemala (%)
Place of birth for the foreign-born population - Honduras (%)
Place of birth for the foreign-born population - Mexico (%)
Place of birth for the foreign-born population - Nicaragua (%)
Place of birth for the foreign-born population - Panama (%)
Place of birth for the foreign-born population - Other Central America (%)
Place of birth for the foreign-born population - Argentina (%)
Place of birth for the foreign-born population - Bolivia (%)
Place of birth for the foreign-born population - Brazil (%)
Place of birth for the foreign-born population - Chile (%)
Place of birth for the foreign-born population - Colombia (%)
Place of birth for the foreign-born population - Ecuador (%)
Place of birth for the foreign-born population - Guyana (%)
Place of birth for the foreign-born population - Peru (%)
Place of birth for the foreign-born population - Uruguay (%)
Place of birth for the foreign-born population - Venezuela (%)
Place of birth for the foreign-born population - Other South America (%)
Place of birth for the foreign-born population - Canada (%)
Place of birth for the foreign-born population - Other Northern America (%)
Place of birth for the foreign-born population - Other (%)
Latest news about races in Anchorage, AK collected exclusively by city-data.com from local newspapers, TV, and radio stations
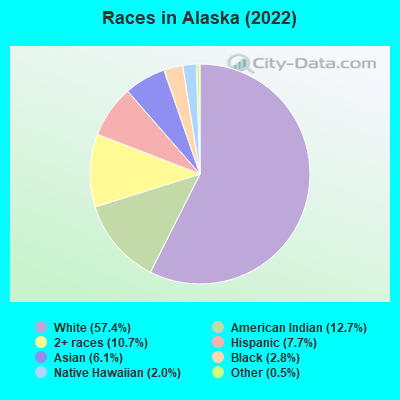
According to 2022 data, the most numerous races in Anchorage, AK are White alone (157,387 residents), American Indian alone (24,206 residents), and Two or more races (28,173 residents). 82.6% of Anchorage residents speak English at home. 11.3% of Anchorage, AK residents are foreign-born (6.2% born in Asia, 2.1% born in Latin America), which is 38.1% greater than the foreign-born rate of 7.0% across the entire state of Alaska.
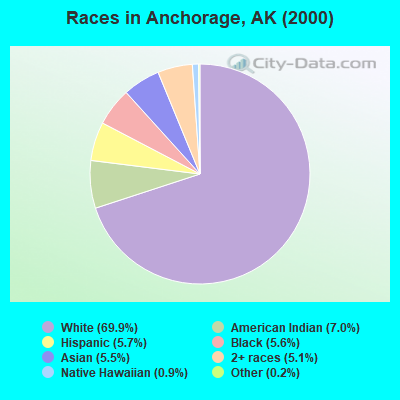
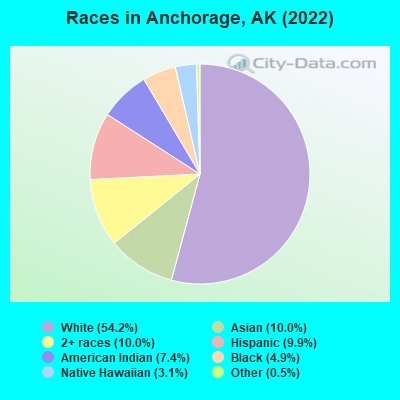
Race distribution in Anchorage
2000 2022
181,982 69.9% White alone 18,326 7.0% American Indian alone 14,799 5.7% Hispanic 14,667 5.6% Black alone 14,208 5.5% Asian alone 13,383 5.1% Two or more races 2,335 0.9% Native Hawaiian and Other 583 0.2% Other race alone
157,387 54.8% White alone 28,563 9.9% Hispanic 28,173 9.8% Two or more races 26,708 9.3% Asian alone 24,206 8.4% American Indian alone 14,309 5.0% Black alone 9,760 3.4% Native Hawaiian and Other 510 0.2% Other race alone
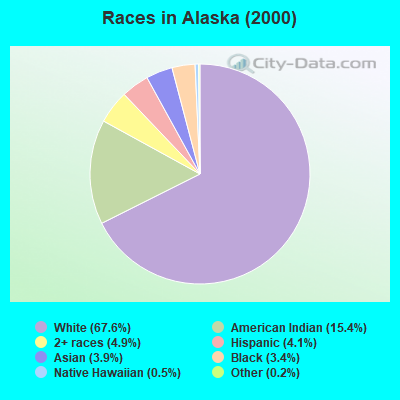
2000 2022
423,788 67.6% White alone 96,505 15.4% American Indian alone 30,454 4.9% Two or more races 25,852 4.1% Hispanic 24,741 3.9% Asian alone 21,073 3.4% Black alone 3,181 0.5% Native Hawaiian and Other 1,338 0.2% Other race alone
421,104 57.4% White alone 93,294 12.7% American Indian alone 78,552 10.7% Two or more races 56,491 7.7% Hispanic 44,905 6.1% Asian alone 20,664 2.8% Black alone 14,539 2.0% Native Hawaiian and Other 4,034 0.5% Other race alone
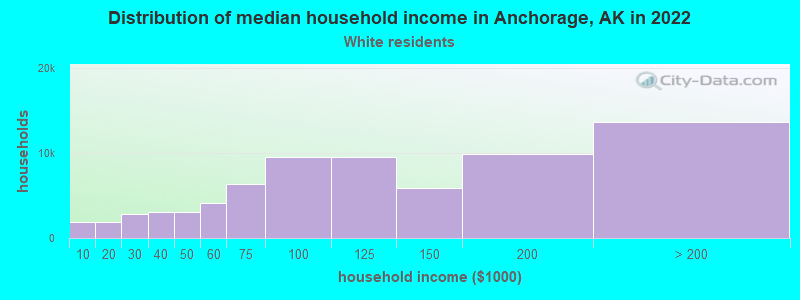
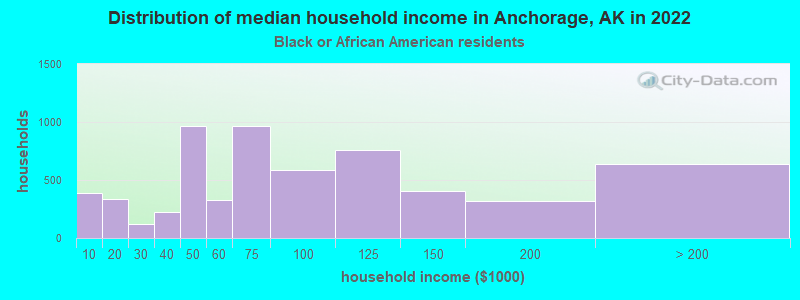
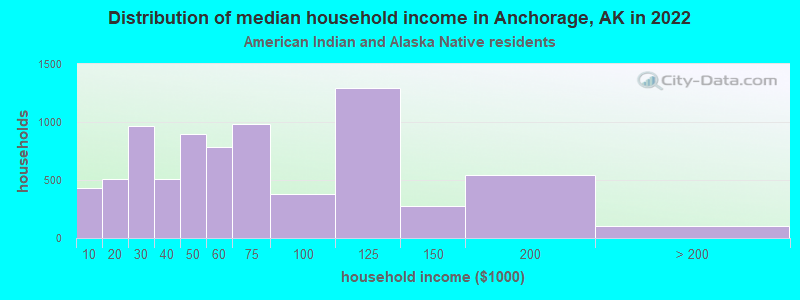
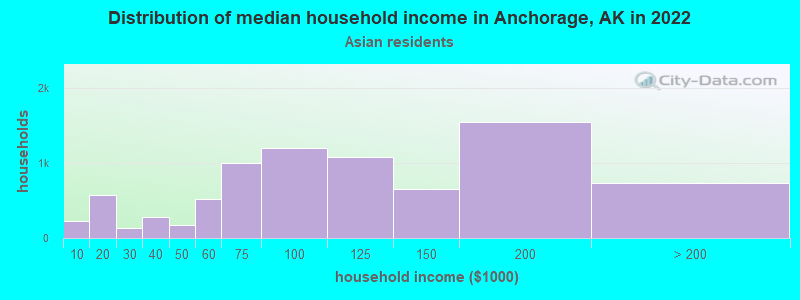
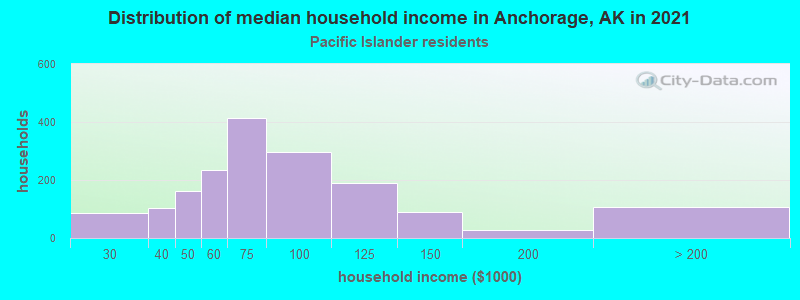
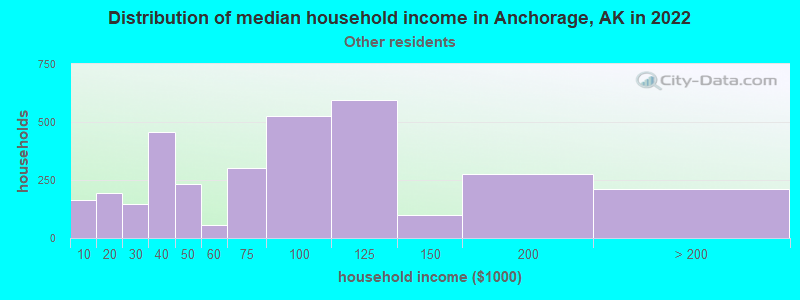
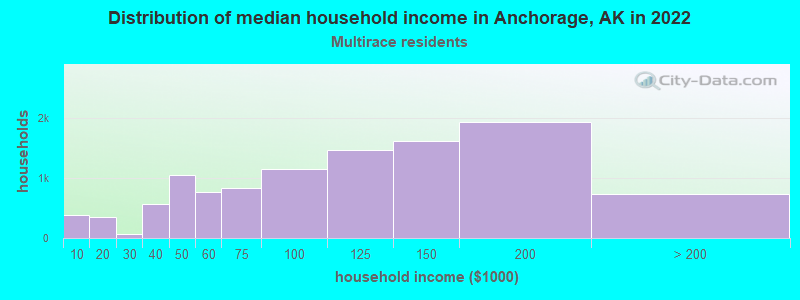
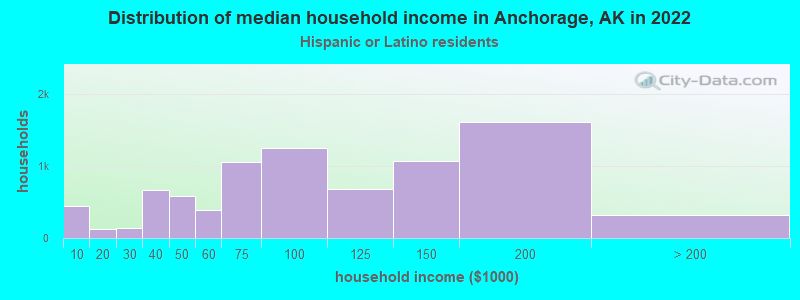
Income and house value in Anchorage Median household income in 2022 $103,153 White non-Hispanic householders$79,006 Black householders$51,663 American Indian and Alaska Native householders$102,492 Asian householders$71,859 Native Hawaiian and other Pacific Islander householders$68,487 Some other race householders$102,694 Two or more races householders$77,418 Hispanic or Latino race householdersMedian 2022 house value $400,896 White Non-Hispanic householders$365,587 Black or African American householders$322,188 American Indian or Alaska Native householders $390,107 Asian householders$367,794 Native Hawaiian and other Pacific Islander householders$334,938 Some other race householders$358,967 Two or more races householders$354,063 Hispanic or Latino householders
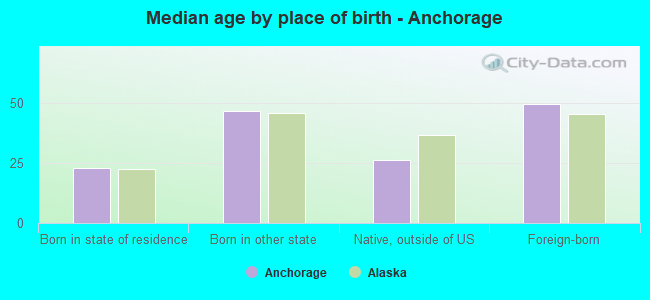
Median age by race in Anchorage
39.9 Median age for White residents39.5 40.9 34.7 Median age for Black or African American residents36.4 29.3 30.9 Median age for American Indian / Alaska Native residents28.0 33.2 40.3 Median age for Asian residents35.7 39.8 27.1 Median age for Native Hawaiian / Pacific Islander residents32.5 26.3 24.0 Median age for Other race residents20.8 32.0 20.5 Median age for Two or more races residents20.0 21.4 41.0 Median age for White alone residents40.1 41.4 27.1 Median age for Hispanic or Latino residents26.5 28.5
Owner/renter occupied households by race in Anchorage
House owners and renters - White residents 50,300 68.5% Owner occupied23,182 31.5% Renter occupiedHouse owners and renters - Black or African American residents 2,536 42.1% Owner occupied3,484 57.9% Renter occupiedHouse owners and renters - American Indian / Alaska Native residents 3,864 40.4% Owner occupied5,697 59.6% Renter occupiedHouse owners and renters - Asian residents 5,885 77.6% Owner occupied1,695 22.4% Renter occupiedHouse owners and renters - Native Hawaiian / Pacific Islander residents 416 20.1% Owner occupied1,649 79.9% Renter occupiedHouse owners and renters - Other race residents 1,229 53.7% Owner occupied1,062 46.3% Renter occupiedHouse owners and renters - Two or more races residents 5,755 58.5% Owner occupied4,083 41.5% Renter occupiedHouse owners and renters - White alone residents 47,175 69.0% Owner occupied21,152 31.0% Renter occupiedHouse owners and renters - Hispanic or Latino residents 5,578 59.3% Owner occupied3,823 40.7% Renter occupied
Language usage in Anchorage
English speakers - Total 82.6% of residents of Anchorage speak English at home.
4.7% of residents speak Spanish at home 9,719 75.1% Speak English very well3,214 24.9% Speak English less than very well12.6% of residents speak other language at home 23,075 67.2% Speak English very well11,249 32.8% Speak English less than very well
English speakers - Born in the United States 93.2% of residents of Anchorage speak English at home.
3.2% of residents speak Spanish at home 3,928 92.3% Speak English very well328 7.7% Speak English less than very well3.7% of residents speak other language at home 3,731 75.5% Speak English very well1,213 24.5% Speak English less than very well
English speakers - Native, born elsewhere 54.9% of residents of Anchorage speak English at home.
13.7% of residents speak Spanish at home 811 68.8% Speak English very well368 31.2% Speak English less than very well31.9% of residents speak other language at home 2,310 83.8% Speak English very well446 16.2% Speak English less than very well
English speakers - Foreign-born 22.6% of residents of Anchorage speak English at home.
13.9% of residents speak Spanish at home 2,331 52.4% Speak English very well2,119 47.6% Speak English less than very well63.3% of residents speak other language at home 11,024 54.3% Speak English very well9,293 45.7% Speak English less than very well
White (Caucasian) - Speak only English Native:
95.1% (146,637)Foreign-born:
44.4% (3,511)
White (Caucasian) - Speak another language Native:
4.8% (7,384)Foreign-born:
56.1% (4,434)
Black or African American - Speak only English Native:
89.2% (10,142)Foreign-born:
37.3% (858)
Black or African American - Speak another language Native:
11.4% (1,299)Foreign-born:
63.3% (1,458)
American Indian / Alaska Native - Speak another language Native:
18.9% (4,227)Foreign-born:
100.0% (116)
Asian - Speak only English Native:
58.9% (6,330)Foreign-born:
16.5% (2,598)
Asian - Speak another language Native:
40.7% (4,367)Foreign-born:
83.6% (13,153)
Native Hawaiian / Pacific Islander - Speak only English Native:
66.1% (3,963)Foreign-born:
4.9% (167)
Native Hawaiian / Pacific Islander - Speak another language Native:
32.6% (1,954)Foreign-born:
100.0% (3,391)
Other race - Speak another language Native:
47.5% (2,939)Foreign-born:
93.8% (1,346)
Two or more races - Speak only English Native:
90.2% (25,558)Foreign-born:
54.5% (611)
Two or more races - Speak another language Native:
9.7% (2,735)Foreign-born:
47.9% (537)
White alone - Speak only English Native:
97.6% (141,586)Foreign-born:
63.9% (3,305)
White alone - Speak another language Native:
2.4% (3,491)Foreign-born:
37.5% (1,940)
Hispanic or Latino - Speak only English Native:
57.0% (11,641)Foreign-born:
8.9% (453)
Hispanic or Latino - Speak another language Native:
42.3% (8,633)Foreign-born:
90.4% (4,604)
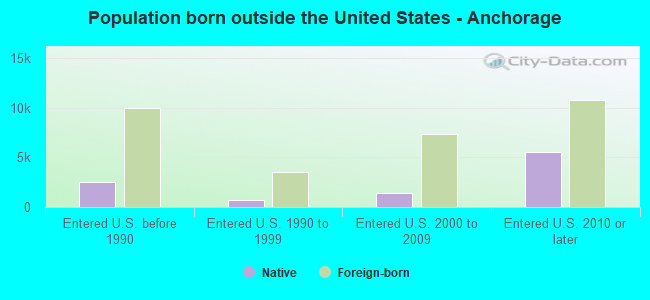
Foreign-born residents in Anchorage 32,488 residents are foreign born (6.2% Asia , 2.1% Latin America ).
This city:
11.3%Alaska:
100.0%
Marital status for residents in Anchorage Marital status - White (Caucasian) population 15 years and over
Males 31.5% Never married52.8% Now married2.2% Separated2.6% Widowed10.9% DivorcedFemales 25.0% Never married54.6% Now married2.2% Separated5.6% Widowed12.6% DivorcedWomen who gave birth in the past 12 months Now married:
88.4% (1,930)Unmarried:
11.6% (253)
Women who did not give birth in the past 12 months Now married:
48.8% (17,722)Unmarried:
51.2% (18,602)
Marital status - Black or African American population 15 years and over
Males 47.6% Never married30.2% Now married2.0% Separated2.1% Widowed18.1% DivorcedFemales 31.1% Never married45.6% Now married2.3% Separated0.9% Widowed20.2% DivorcedWomen who gave birth in the past 12 months Now married:
100.0% (465)Unmarried:
0.0% (0)
Women who did not give birth in the past 12 months Now married:
48.1% (1,659)Unmarried:
51.9% (1,793)
Marital status - American Indian / Alaska Native population 15 years and over
Males 59.9% Never married26.4% Now married1.0% Separated0.9% Widowed11.7% DivorcedFemales 49.8% Never married25.5% Now married3.5% Separated6.4% Widowed14.8% DivorcedWomen who gave birth in the past 12 months Now married:
20.2% (153)Unmarried:
79.8% (606)
Women who did not give birth in the past 12 months Now married:
28.6% (1,727)Unmarried:
71.4% (4,303)
Marital status - Asian population 15 years and over
Males 40.5% Never married38.0% Now married5.3% Separated9.2% Widowed7.0% DivorcedFemales 22.5% Never married58.1% Now married0.0% Separated9.7% Widowed9.7% DivorcedWomen who gave birth in the past 12 months Now married:
89.0% (402)Unmarried:
11.0% (50)
Women who did not give birth in the past 12 months Now married:
61.9% (3,521)Unmarried:
38.1% (2,167)
Marital status - Native Hawaiian / Pacific Islander population 15 years and over
Males 44.6% Never married50.7% Now married0.5% Separated0.0% Widowed4.2% DivorcedFemales 35.3% Never married50.7% Now married4.4% Separated1.5% Widowed8.0% DivorcedWomen who gave birth in the past 12 months Now married:
34.2% (83)Unmarried:
65.8% (160)
Women who did not give birth in the past 12 months Now married:
52.6% (1,131)Unmarried:
47.4% (1,020)
Marital status - Other race population 15 years and over
Males 48.9% Never married39.8% Now married0.5% Separated1.0% Widowed9.8% DivorcedFemales 43.4% Never married41.6% Now married4.8% Separated0.5% Widowed9.7% DivorcedWomen who gave birth in the past 12 months Now married:
68.6% (84)Unmarried:
31.4% (38)
Women who did not give birth in the past 12 months Now married:
37.9% (1,015)Unmarried:
62.1% (1,663)
Marital status - Two or more races population 15 years and over
Males 61.6% Never married36.7% Now married0.0% Separated0.0% Widowed1.7% DivorcedFemales 57.4% Never married34.5% Now married2.1% Separated1.5% Widowed4.6% DivorcedWomen who gave birth in the past 12 months Now married:
100.0% (302)Unmarried:
0.0% (0)
Women who did not give birth in the past 12 months Now married:
28.2% (2,596)Unmarried:
71.8% (6,597)
Marital status - White alone, not Hispanic / Latino population 15 years and over
Males 30.2% Never married53.4% Now married2.4% Separated2.9% Widowed11.1% DivorcedFemales 24.8% Never married54.8% Now married1.9% Separated5.9% Widowed12.6% DivorcedWomen who gave birth in the past 12 months Now married:
87.7% (1,829)Unmarried:
12.3% (256)
Women who did not give birth in the past 12 months Now married:
49.1% (16,270)Unmarried:
50.9% (16,866)
Marital status - Hispanic or Latino population 15 years and over
Males 48.8% Never married41.4% Now married0.0% Separated0.0% Widowed9.8% DivorcedFemales 34.3% Never married50.3% Now married5.5% Separated1.2% Widowed8.6% DivorcedWomen who gave birth in the past 12 months Now married:
100.0% (181)Unmarried:
0.0% (0)
Women who did not give birth in the past 12 months Now married:
41.8% (2,784)Unmarried:
58.2% (3,882)
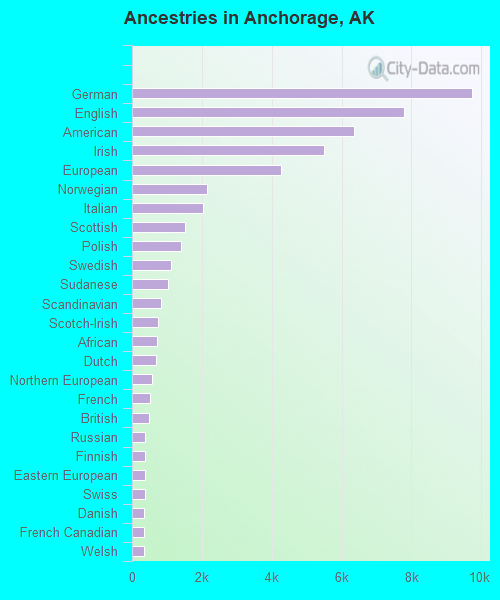
Ancestries in Anchorage
9,057 6.6% German7,245 5.3% American6,140 4.5% English6,002 4.4% European5,320 3.9% Irish2,456 1.8% Norwegian1,698 1.2% Italian1,490 1.1% Scottish1,425 1.0% Sudanese1,331 1.0% Polish936 0.7% Swedish906 0.7% Northern European819 0.6% Scotch-Irish782 0.6% British776 0.6% Scandinavian747 0.5% French738 0.5% Dutch646 0.5% Russian519 0.4% Eastern European491 0.4% French Canadian475 0.3% African414 0.3% Welsh404 0.3% Czech395 0.3% Danish390 0.3% Finnish297 0.2% Ukrainian289 0.2% Swiss288 0.2% Hungarian268 0.2% Nigerian258 0.2% Portuguese225 0.2% Canadian221 0.2% Somali177 0.1% Albanian163 0.1% Jamaican154 0.1% Romanian129 0.09% Iranian121 0.09% Haitian118 0.09% Icelander116 0.08% Czechoslovakian114 0.08% Lithuanian113 0.08% Austrian86 0.06% Liberian85 0.06% Serbian84 0.06% Greek75 0.05% New Zealander73 0.05% German Russian72 0.05% Belgian63 0.05% Australian63 0.05% Turkish56 0.04% Bulgarian55 0.04% Egyptian50 0.04% Croatian44 0.03% Brazilian43 0.03% Slavic43 0.03% West Indian41 0.03% Yugoslavian40 0.03% South African40 0.03% Slovak30 0.02% Belizean28 0.02% Slovene26 0.02% Celtic26 0.02% Lebanese24 0.02% Cajun23 0.02% Trinidadian and Tobagonian22 0.02% Macedonian17 0.01% Armenian16 0.01% British West Indian16 0.01% Luxembourger14 0.01% Latvian8 0.01% Arab
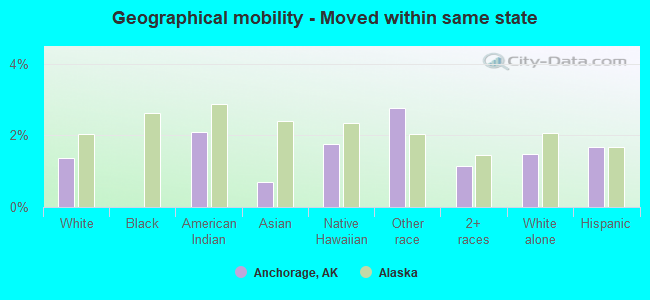
Geographical mobility in Anchorage Same house 1 year ago 145,458 86.2% White (Caucasian)13,242 91.6% Black or African American19,789 84.3% American Indian / Alaska Native24,689 92.3% Asian7,019 78.6% Native Hawaiian / Pacific Islander6,599 74.3% Other race30,043 81.7% Two or more races135,506 83.9% White alone, not Hispanic / Latino21,287 77.2% Hispanic or LatinoMoved within same county 10,634 6.3% White / Caucasian488 3.4% Black or African American2,844 12.1% American Indian / Alaska Native2,061 7.7% Asian1,253 14.0% Native Hawaiian / Pacific Islander1,460 16.4% Other race4,181 11.4% Two or more races14,865 9.2% White alone, not Hispanic / Latino3,772 13.7% Hispanic or LatinoMoved within same state 2,315 1.4% White / Caucasian495 2.1% American Indian / Alaska Native189 0.7% Asian156 1.8% Native Hawaiian / Pacific Islander245 2.8% Other race419 1.1% Two or more races2,408 1.5% White alone, not Hispanic / Latino462 1.7% Hispanic or LatinoMoved from different state 8,910 5.3% White / Caucasian1,240 8.6% Black or African American154 0.7% American Indian / Alaska Native217 0.8% Asian363 4.1% Native Hawaiian / Pacific Islander346 3.9% Other race1,817 4.9% Two or more races7,033 4.4% White alone, not Hispanic / Latino1,620 5.9% Hispanic or LatinoMoved from abroad 1,902 1.1% White85 0.3% Asian440 4.9% Native Hawaiian / Pacific Islander65 0.7% Other race211 0.6% Two or more races1,360 0.8% White alone, not Hispanic / Latino211 0.8% Hispanic or Latino
Children Nativity (place of birth) in Anchorage
Children under 6 years - Living with two parents Both parents native 12,437 100.0% NativeBoth parents foreign-born 1,343 100.0% NativeOne native, one foreign-born parent 2,723 100.0% NativeChildren under 6 years - Living with one parent Native parent 4,101 100.0% NativeForeign-born parent 494 100.0% NativeChildren 6 to 17 years - Living with two parents Both parents native 17,795 100.0% NativeBoth parents foreign-born 5,123 89.2% Native620 10.8% Foreign-bornOne native, one foreign-born parent 4,268 90.9% Native427 9.1% Foreign-bornChildren 6 to 17 years - Living with one parent Native parent 14,170 100.0% NativeForeign-born parent 590 55.2% Native479 44.8% Foreign-born
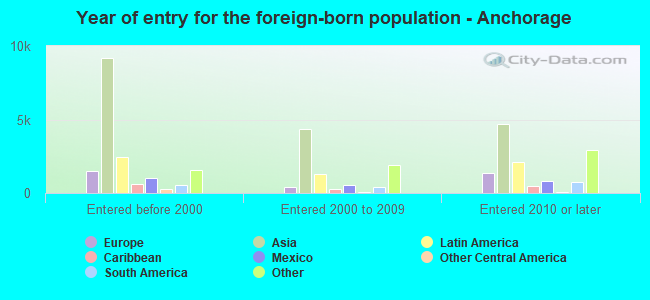
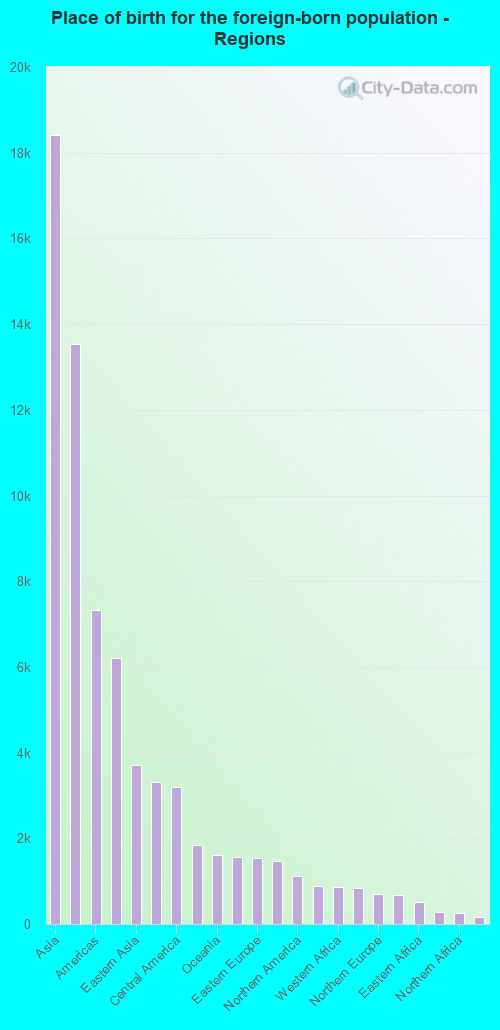
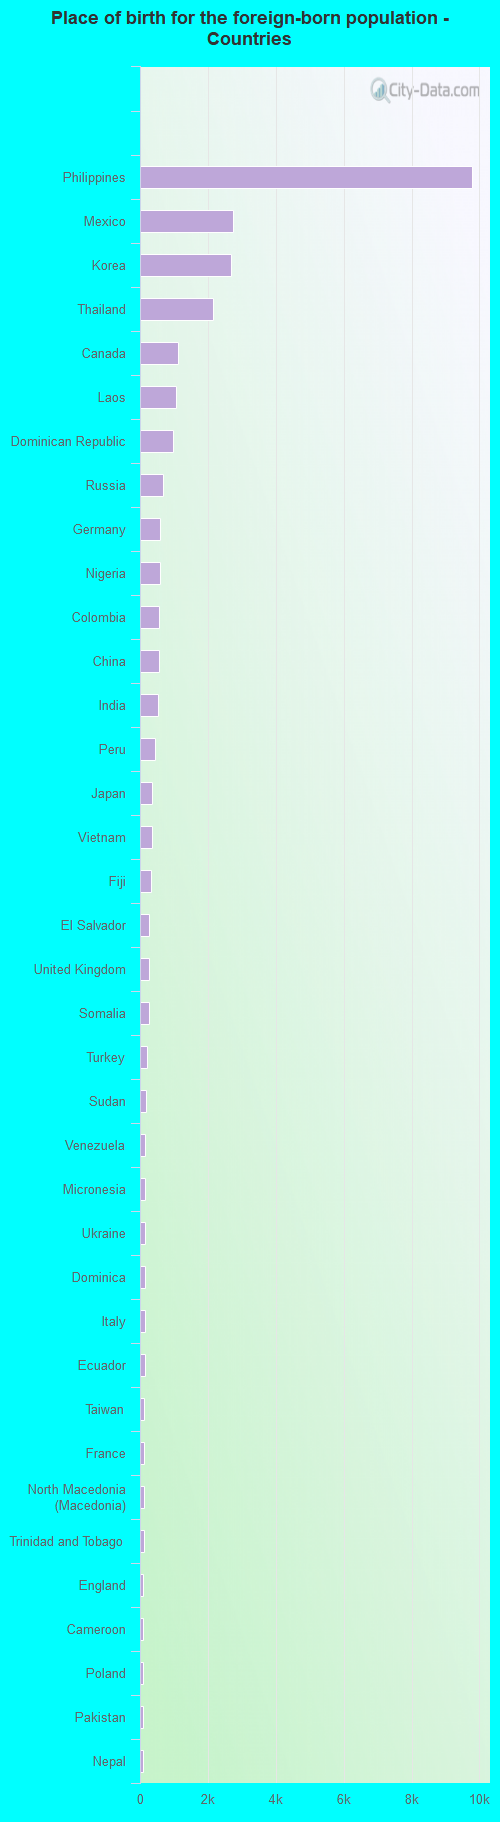
Place of birth for residents in Anchorage 18,406 Asia13,545 South Eastern Asia7,327 Americas6,217 Latin America3,719 Eastern Asia3,312 Europe3,186 Central America1,839 Africa1,602 Oceania1,568 Caribbean1,551 Eastern Europe1,462 South America1,109 Northern America892 Western Europe872 Western Africa839 South Central Asia698 Northern Europe677 China505 Eastern Africa288 Western Asia248 Northern Africa170 Southern Europe97 Middle Africa97 Australia and New Zealand Subregion31 Southern Africa9,791 Philippines2,748 Mexico2,682 Korea2,160 Thailand1,109 Canada1,064 Laos975 Dominican Republic691 Russia580 Germany575 Nigeria554 Colombia545 China539 India452 Peru360 Japan350 Vietnam312 Fiji259 El Salvador257 United Kingdom255 Somalia211 Turkey178 Sudan156 Venezuela156 Micronesia153 Ukraine150 Dominica144 Italy143 Ecuador126 Taiwan124 France112 North Macedonia (Macedonia)108 Trinidad and Tobago101 England97 Cameroon95 Poland94 Pakistan91 Nepal84 Netherlands83 Sweden82 Haiti80 Czechoslovakia76 Ghana75 Norway73 Sierra Leone72 Moldova69 Guatemala68 Ethiopia68 Cuba65 Romania65 Argentina62 Egypt61 Serbia60 West Indies58 Malaysia56 Switzerland55 Australia54 Scotland52 Ireland52 Iran48 Liberia45 Austria45 Bulgaria44 Grenada44 Cambodia41 New Zealand39 Honduras37 Belarus34 Belize31 South Africa31 Brazil29 Indonesia28 Burma26 Jamaica26 Zimbabwe24 Nicaragua18 Spain16 Sri Lanka14 Uganda14 Latvia11 Panama10 Bosnia and Herzegovina9 Lebanon9 Uruguay8 Barbados5 Hong Kong4 Croatia
Grandparents responsible for own grandchildren in Anchorage
Grandparents (30 to 59 years) White / Caucasian 832 82.3% Responsible for grandchildren179 17.7% Not responsible for grandchildrenBlack or African American 51 36.3% Responsible for grandchildren90 63.7% Not responsible for grandchildrenAmerican Indian / Alaska Native 35 22.0% Responsible for grandchildren123 78.0% Not responsible for grandchildrenAsian 40 11.0% Responsible for grandchildren325 89.0% Not responsible for grandchildrenNative Hawaiian / Pacific Islander 76 22.4% Responsible for grandchildren263 77.6% Not responsible for grandchildrenOther race 8 41.1% Responsible for grandchildren11 58.9% Not responsible for grandchildrenTwo or more races 23 31.5% Responsible for grandchildren50 68.5% Not responsible for grandchildrenWhite alone, not Hispanic / Latino 525 74.2% Responsible for grandchildren183 25.8% Not responsible for grandchildrenHispanic or Latino 94 56.3% Responsible for grandchildren73 43.7% Not responsible for grandchildrenGrandparents (60 years and over) White / Caucasian 357 20.0% Responsible for grandchildren1,424 80.0% Not responsible for grandchildrenBlack or African American 56 36.2% Responsible for grandchildren99 63.8% Not responsible for grandchildrenAmerican Indian / Alaska Native 97 27.4% Responsible for grandchildren257 72.6% Not responsible for grandchildrenAsian 57 5.3% Responsible for grandchildren1,020 94.7% Not responsible for grandchildrenNative Hawaiian / Pacific Islander 41 7.9% Responsible for grandchildren473 92.1% Not responsible for grandchildrenOther race 41 100.0% Not responsible for grandchildrenTwo or more races 55 18.2% Responsible for grandchildren248 81.8% Not responsible for grandchildrenWhite alone, not Hispanic / Latino 361 19.9% Responsible for grandchildren1,452 80.1% Not responsible for grandchildrenHispanic or Latino 15 24.6% Responsible for grandchildren45 75.4% Not responsible for grandchildren
Zip codes: 99501 , 99502 , 99503 , 99504 , 99505 , 99506 , 99507 , 99508 , 99513, 99515 , 99516 , 99517 , 99518 , 99540 , 99567 , 99577 , 99587 .