Races in Anderson Mill, Texas (TX) Detailed Stats
Ancestries, Foreign-born residents, place of birth

Recent posts about races in Anderson Mill, Texas on our local forum with over 2,400,000 registered users:
 | Young, liberal couple buying house in NW Austin (67 replies) |
| Another Californian Possibly Moving In... (88 replies) |
| homes in Austin (38 replies) |
| When to Look for a Rental House, and where/how far to live close to town and still have some yard and nature nearby? (9 replies) |
| Canadians in Texas! Round Rock Pests? (29 replies) |
| Looking for a house $300k-400k budget (39 replies) |
8.6% of Anderson Mill, TX residents are foreign-born (4.8% born in Asia, 2.6% born in Latin America), which is 97.2% less than the foreign-born rate of 17.0% across the entire state of Texas.
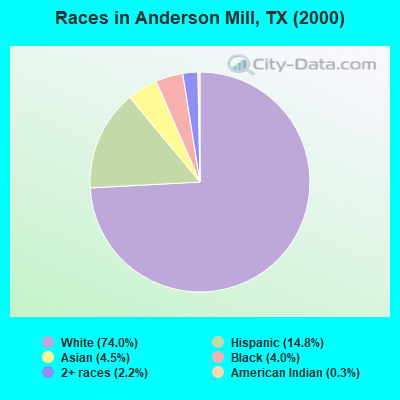
Race distribution in Anderson Mill

- 6,62174.0%White alone
- 1,32314.8%Hispanic
- 4064.5%Asian alone
- 3624.0%Black alone
- 1952.2%Two or more races
- 310.3%American Indian alone
- 80.09%Other race alone
- 70.08%Native Hawaiian and Other
Pacific Islander alone
2000
2022
-
- 10,933,31352.4%White alone
- 6,669,66632.0%Hispanic
- 2,364,25511.3%Black alone
- 554,4452.7%Asian alone
- 230,5671.1%Two or more races
- 68,8590.3%American Indian alone
- 19,9580.10%Other race alone
- 10,7570.05%Native Hawaiian and Other
Pacific Islander alone

-
- 12,070,64240.2%Hispanic
- 11,683,43038.9%White alone
- 3,508,70611.7%Black alone
- 1,608,1735.4%Asian alone
- 956,5603.2%Two or more races
- 125,7630.4%Other race alone
- 47,0230.2%American Indian alone
- 29,2750.10%Native Hawaiian and Other
Pacific Islander alone

Income and house value in Anderson Mill
- Median household income in 2022
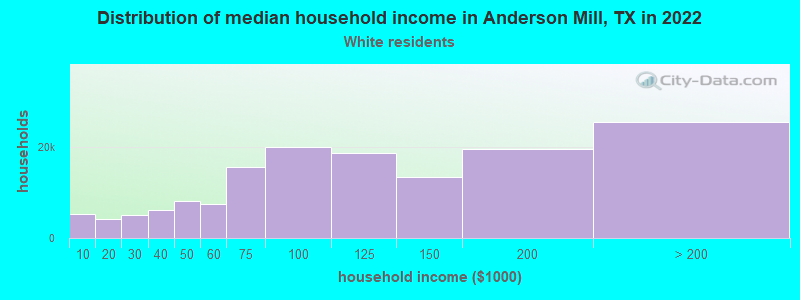
- $92,554White non-Hispanic householders
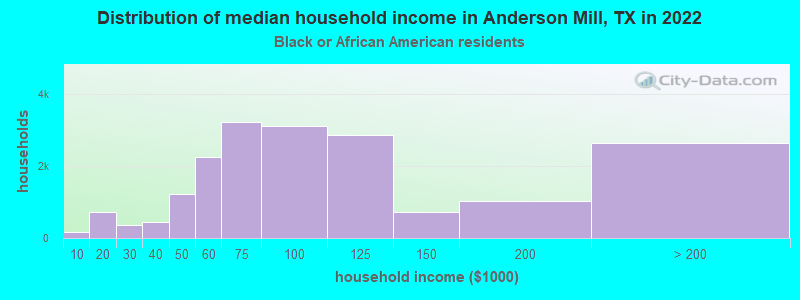
- $91,688Black householders
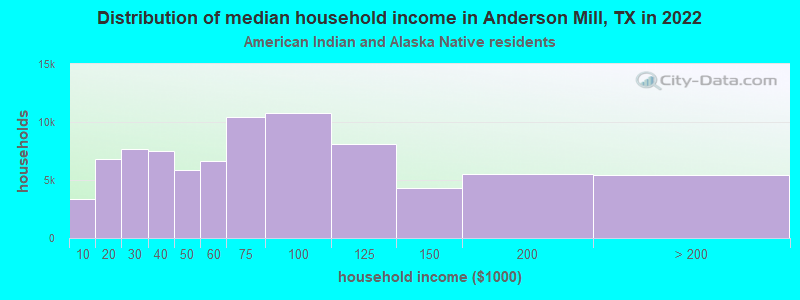
- $110,169American Indian and Alaska Native householders
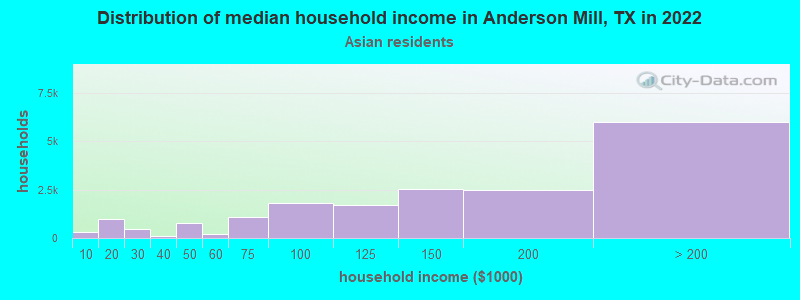
- $107,525Asian householders
- $92,444Some other race householders
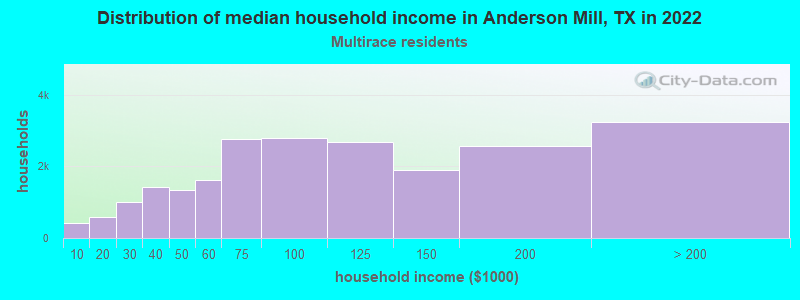
- $64,292Two or more races householders
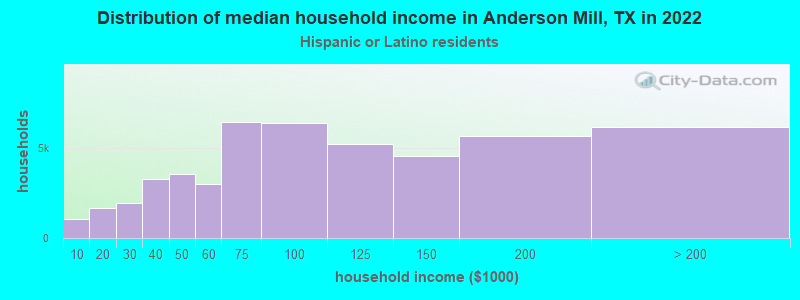
- $82,416Hispanic or Latino race householders
- Median 2022 house value
- $419,047White Non-Hispanic householders
- $392,761Black or African American householders
- $438,857Asian householders
- $369,904Some other race householders
- $369,904Two or more races householders
- $372,952Hispanic or Latino householders
Household income for White non-Hispanic householders
Household income for Black householders
Household income for American Indian and Alaska Native householders
Household income for Asian householders
Household income for Two or more races householders
Household income for Hispanic or Latino race householders
Foreign-born residents in Anderson Mill
772 residents are foreign born (4.8% Asia, 2.6% Latin America).
| This city: | 8.6% |
| Texas: | 13.9% |
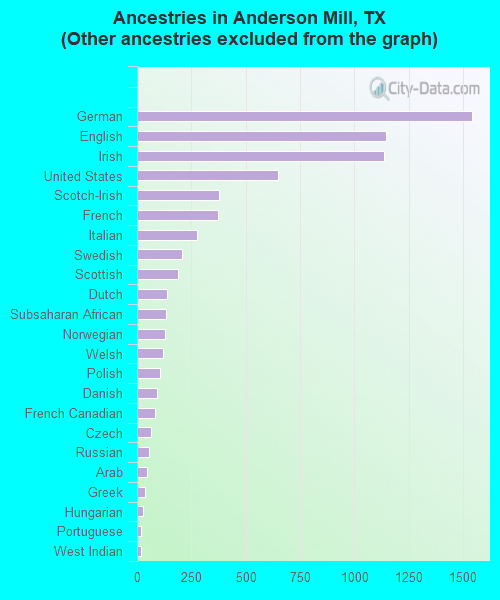
Ancestries in Anderson Mill

- 2,74228.2%Other
- 1,54315.9%German
- 1,14611.8%English
- 1,13811.7%Irish
- 6486.7%United States
- 3783.9%Scotch-Irish
- 3753.9%French
- 2742.8%Italian
- 2082.1%Swedish
- 1891.9%Scottish
- 1371.4%Dutch
- 1351.4%Subsaharan African
- 1301.3%Norwegian
- 1181.2%Welsh
- 1051.1%Polish
- 941.0%Danish
- 850.9%French Canadian
- 630.6%Czech
- 550.6%Russian
- 470.5%Arab
- 350.4%Greek
- 290.3%Hungarian
- 180.2%Portuguese
- 170.2%West Indian
- 100.1%Swiss
- 70.07%Ukrainian
Zip codes: 78750.