Races in Apple Valley, Minnesota (MN) Detailed Stats
Data:
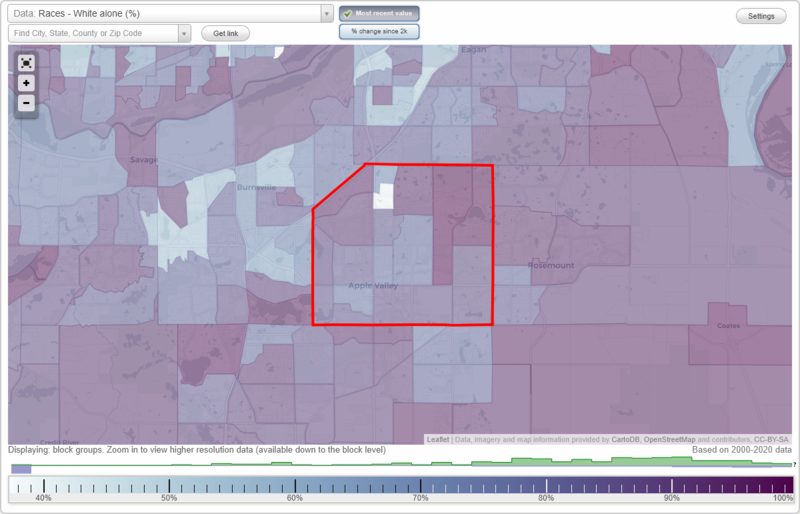
Races - White alone (%)
Races - White alone (% change since 2000)
Races - Black alone (%)
Races - Black alone (% change since 2000)
Races - American Indian alone (%)
Races - American Indian alone (% change since 2000)
Races - Asian alone (%)
Races - Asian alone (% change since 2000)
Races - Hispanic (%)
Races - Hispanic (% change since 2000)
Races - Native Hawaiian and Other Pacific Islander alone (%)
Races - Native Hawaiian and Other Pacific Islander alone (% change since 2000)
Races - Two or more races(%)
Races - Two or more races(% change since 2000)
Races - Other race alone (%)
Races - Other race alone (% change since 2000)
Racial diversity
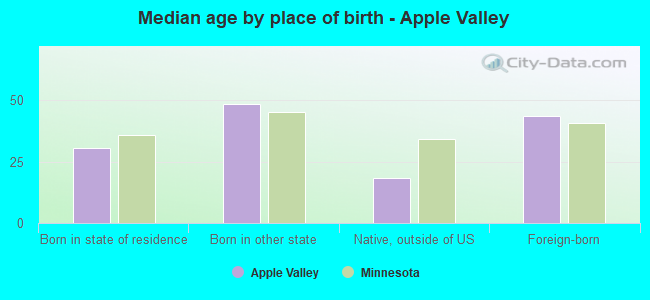
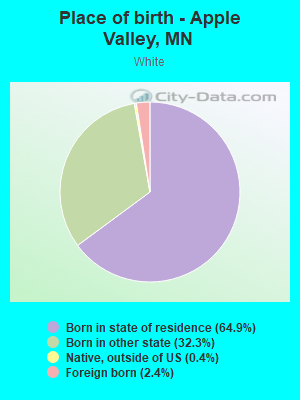
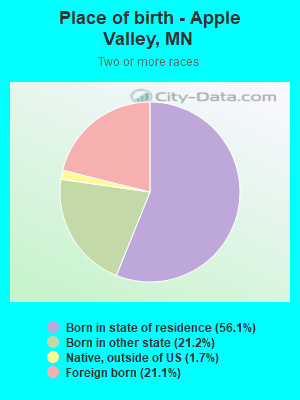
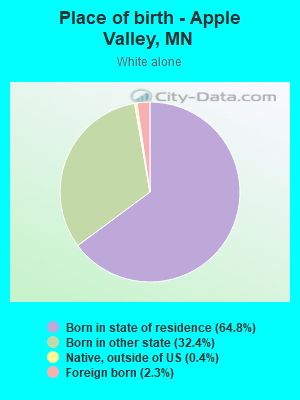
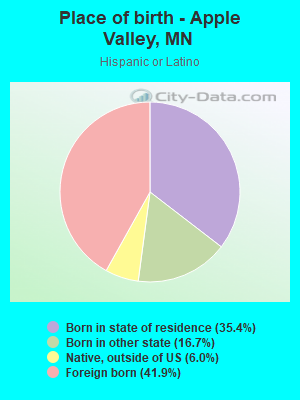
Place of birth - Born in state of residence (%)
Place of birth - Born in state of residence (%) - White
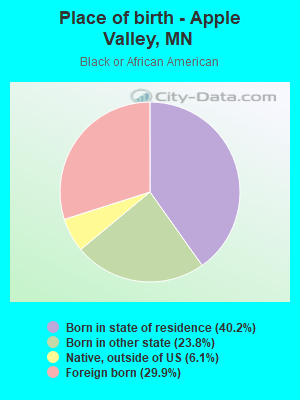
Place of birth - Born in state of residence (%) - Black or African American
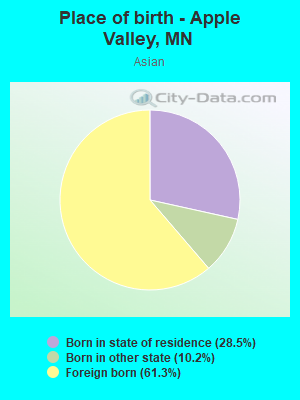
Place of birth - Born in state of residence (%) - Asian
Place of birth - Born in state of residence (%) - Hispanic or Latino
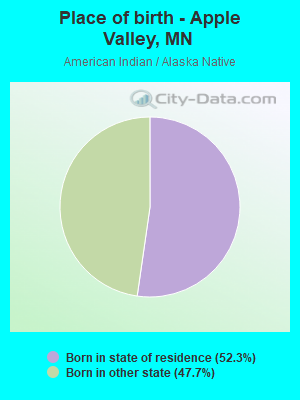
Place of birth - Born in state of residence (%) - American Indian and Alaska Native
Place of birth - Born in state of residence (%) - Multirace
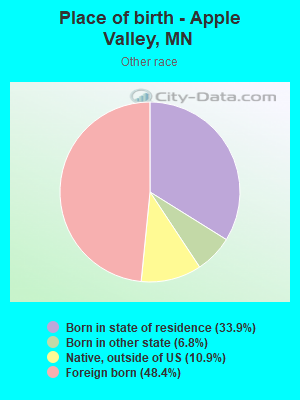
Place of birth - Born in state of residence (%) - Other Race
Place of birth - Born in other state (%)
Place of birth - Born in other state (%) - White
Place of birth - Born in other state (%) - Black or African American
Place of birth - Born in other state (%) - Asian
Place of birth - Born in other state (%) - Hispanic or Latino
Place of birth - Born in other state (%) - American Indian and Alaska Native
Place of birth - Born in other state (%) - Multirace
Place of birth - Born in other state (%) - Other Race
Place of birth - Native, outside of US (%)
Place of birth - Native, outside of US (%) - White
Place of birth - Native, outside of US (%) - Black or African American
Place of birth - Native, outside of US (%) - Asian
Place of birth - Native, outside of US (%) - Hispanic or Latino
Place of birth - Native, outside of US (%) - American Indian and Alaska Native
Place of birth - Native, outside of US (%) - Multirace
Place of birth - Native, outside of US (%) - Other Race
Place of birth - Foreign born (%)
Place of birth - Foreign born (%) - White
Place of birth - Foreign born (%) - Black or African American
Place of birth - Foreign born (%) - Asian
Place of birth - Foreign born (%) - Hispanic or Latino
Place of birth - Foreign born (%) - American Indian and Alaska Native
Place of birth - Foreign born (%) - Multirace
Place of birth - Foreign born (%) - Other Race
Residents speaking English at home (%)
Residents speaking English at home - Born in the United States (%)
Residents speaking English at home - Native, born elsewhere (%)
Residents speaking English at home - Foreign born (%)
Residents speaking Spanish at home (%)
Residents speaking Spanish at home - Born in the United States (%)
Residents speaking Spanish at home - Native, born elsewhere (%)
Residents speaking Spanish at home - Foreign born (%)
Residents speaking other language at home (%)
Residents speaking other language at home - Born in the United States (%)
Residents speaking other language at home - Native, born elsewhere (%)
Residents speaking other language at home - Foreign born (%)
Marital status - Never married (%)
Marital status - Now married (%)
Marital status - Separated (%)
Marital status - Widowed (%)
Marital status - Divorced (%)
Ancestries Reported - Arab (%)
Ancestries Reported - Czech (%)
Ancestries Reported - Danish (%)
Ancestries Reported - Dutch (%)
Ancestries Reported - English (%)
Ancestries Reported - French (%)
Ancestries Reported - French Canadian (%)
Ancestries Reported - German (%)
Ancestries Reported - Greek (%)
Ancestries Reported - Hungarian (%)
Ancestries Reported - Irish (%)
Ancestries Reported - Italian (%)
Ancestries Reported - Lithuanian (%)
Ancestries Reported - Norwegian (%)
Ancestries Reported - Polish (%)
Ancestries Reported - Portuguese (%)
Ancestries Reported - Russian (%)
Ancestries Reported - Scotch-Irish (%)
Ancestries Reported - Scottish (%)
Ancestries Reported - Slovak (%)
Ancestries Reported - Subsaharan African (%)
Ancestries Reported - Swedish (%)
Ancestries Reported - Swiss (%)
Ancestries Reported - Ukrainian (%)
Ancestries Reported - United States (%)
Ancestries Reported - Welsh (%)
Ancestries Reported - West Indian (%)
Ancestries Reported - Other (%)
Geographical mobility - Same house 1 year ago (%)
Geographical mobility - Same house 1 year ago (%) - White
Geographical mobility - Same house 1 year ago (%) - Black or African American
Geographical mobility - Same house 1 year ago (%) - Asian
Geographical mobility - Same house 1 year ago (%) - Hispanic or Latino
Geographical mobility - Same house 1 year ago (%) - American Indian and Alaska Native
Geographical mobility - Same house 1 year ago (%) - Multirace
Geographical mobility - Same house 1 year ago (%) - Other Race
Geographical mobility - Moved within same county (%)
Geographical mobility - Moved within same county (%) - White
Geographical mobility - Moved within same county (%) - Black or African American
Geographical mobility - Moved within same county (%) - Asian
Geographical mobility - Moved within same county (%) - Hispanic or Latino
Geographical mobility - Moved within same county (%) - American Indian and Alaska Native
Geographical mobility - Moved within same county (%) - Multirace
Geographical mobility - Moved within same county (%) - Other Race
Geographical mobility - Moved from different county within same state (%)
Geographical mobility - Moved from different county within same state (%) - White
Geographical mobility - Moved from different county within same state (%) - Black or African American
Geographical mobility - Moved from different county within same state (%) - Asian
Geographical mobility - Moved from different county within same state (%) - Hispanic or Latino
Geographical mobility - Moved from different county within same state (%) - American Indian and Alaska Native
Geographical mobility - Moved from different county within same state (%) - Multirace
Geographical mobility - Moved from different county within same state (%) - Other Race
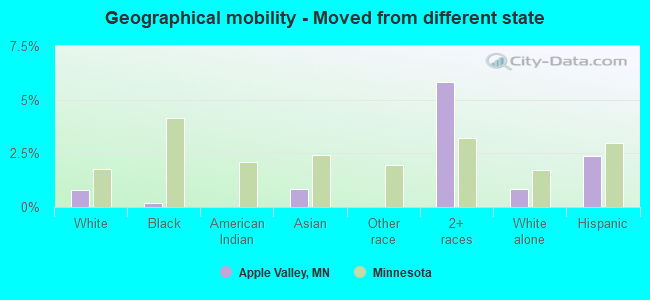
Geographical mobility - Moved from different state (%)
Geographical mobility - Moved from different state (%) - White
Geographical mobility - Moved from different state (%) - Black or African American
Geographical mobility - Moved from different state (%) - Asian
Geographical mobility - Moved from different state (%) - Hispanic or Latino
Geographical mobility - Moved from different state (%) - American Indian and Alaska Native
Geographical mobility - Moved from different state (%) - Multirace
Geographical mobility - Moved from different state (%) - Other Race
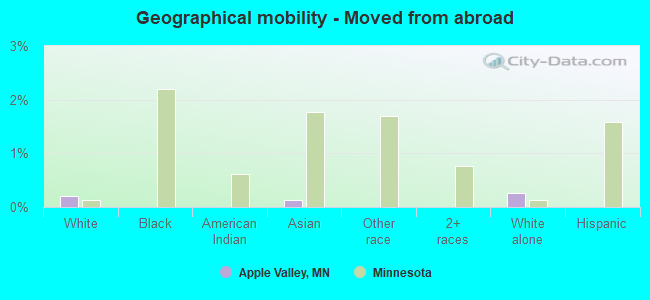
Geographical mobility - Moved from abroad (%)
Geographical mobility - Moved from abroad (%) - White
Geographical mobility - Moved from abroad (%) - Black or African American
Geographical mobility - Moved from abroad (%) - Asian
Geographical mobility - Moved from abroad (%) - Hispanic or Latino
Geographical mobility - Moved from abroad (%) - American Indian and Alaska Native
Geographical mobility - Moved from abroad (%) - Multirace
Geographical mobility - Moved from abroad (%) - Other Race
Place of birth for the foreign-born population - Ireland (%)
Place of birth for the foreign-born population - Denmark (%)
Place of birth for the foreign-born population - Norway (%)
Place of birth for the foreign-born population - Sweden (%)
Place of birth for the foreign-born population - United Kingdom (%)
Place of birth for the foreign-born population - England (%)
Place of birth for the foreign-born population - Scotland (%)
Place of birth for the foreign-born population - Other Northern Europe (%)
Place of birth for the foreign-born population - Austria (%)
Place of birth for the foreign-born population - Belgium (%)
Place of birth for the foreign-born population - France (%)
Place of birth for the foreign-born population - Germany (%)
Place of birth for the foreign-born population - Netherlands (%)
Place of birth for the foreign-born population - Switzerland (%)
Place of birth for the foreign-born population - Other Western Europe (%)
Place of birth for the foreign-born population - Greece (%)
Place of birth for the foreign-born population - Italy (%)
Place of birth for the foreign-born population - Portugal (%)
Place of birth for the foreign-born population - Spain (%)
Place of birth for the foreign-born population - Other Southern Europe (%)
Place of birth for the foreign-born population - Albania (%)
Place of birth for the foreign-born population - Belarus (%)
Place of birth for the foreign-born population - Bosnia and Herzegovina (%)
Place of birth for the foreign-born population - Bulgaria (%)
Place of birth for the foreign-born population - Croatia (%)
Place of birth for the foreign-born population - Czechoslovakia (%)
Place of birth for the foreign-born population - Hungary (%)
Place of birth for the foreign-born population - Latvia (%)
Place of birth for the foreign-born population - Lithuania (%)
Place of birth for the foreign-born population - North Macedonia (Macedonia) (%)
Place of birth for the foreign-born population - Moldova (%)
Place of birth for the foreign-born population - Poland (%)
Place of birth for the foreign-born population - Romania (%)
Place of birth for the foreign-born population - Russia (%)
Place of birth for the foreign-born population - Serbia (%)
Place of birth for the foreign-born population - Ukraine (%)
Place of birth for the foreign-born population - Other Eastern Europe (%)
Place of birth for the foreign-born population - China (%)
Place of birth for the foreign-born population - Hong Kong (%)
Place of birth for the foreign-born population - Taiwan (%)
Place of birth for the foreign-born population - Japan (%)
Place of birth for the foreign-born population - Korea (%)
Place of birth for the foreign-born population - Other Eastern Asia (%)
Place of birth for the foreign-born population - Afghanistan (%)
Place of birth for the foreign-born population - Bangladesh (%)
Place of birth for the foreign-born population - India (%)
Place of birth for the foreign-born population - Iran (%)
Place of birth for the foreign-born population - Kazakhstan (%)
Place of birth for the foreign-born population - Nepal (%)
Place of birth for the foreign-born population - Pakistan (%)
Place of birth for the foreign-born population - Sri Lanka (%)
Place of birth for the foreign-born population - Uzbekistan (%)
Place of birth for the foreign-born population - Other South Central Asia (%)
Place of birth for the foreign-born population - Burma (%)
Place of birth for the foreign-born population - Cambodia (%)
Place of birth for the foreign-born population - Indonesia (%)
Place of birth for the foreign-born population - Laos (%)
Place of birth for the foreign-born population - Malaysia (%)
Place of birth for the foreign-born population - Philippines (%)
Place of birth for the foreign-born population - Singapore (%)
Place of birth for the foreign-born population - Thailand (%)
Place of birth for the foreign-born population - Vietnam (%)
Place of birth for the foreign-born population - Other South Eastern Asia (%)
Place of birth for the foreign-born population - Armenia (%)
Place of birth for the foreign-born population - Iraq (%)
Place of birth for the foreign-born population - Israel (%)
Place of birth for the foreign-born population - Jordan (%)
Place of birth for the foreign-born population - Kuwait (%)
Place of birth for the foreign-born population - Lebanon (%)
Place of birth for the foreign-born population - Saudi Arabia (%)
Place of birth for the foreign-born population - Syria (%)
Place of birth for the foreign-born population - Turkey (%)
Place of birth for the foreign-born population - Yemen (%)
Place of birth for the foreign-born population - Other Western Asia (%)
Place of birth for the foreign-born population - Eritrea (%)
Place of birth for the foreign-born population - Ethiopia (%)
Place of birth for the foreign-born population - Kenya (%)
Place of birth for the foreign-born population - Somalia (%)
Place of birth for the foreign-born population - Uganda (%)
Place of birth for the foreign-born population - Zimbabwe (%)
Place of birth for the foreign-born population - Other Eastern Africa (%)
Place of birth for the foreign-born population - Cameroon (%)
Place of birth for the foreign-born population - Congo (%)
Place of birth for the foreign-born population - Democratic Republic of Congo (Zaire) (%)
Place of birth for the foreign-born population - Other Middle Africa (%)
Place of birth for the foreign-born population - Egypt (%)
Place of birth for the foreign-born population - Morocco (%)
Place of birth for the foreign-born population - Sudan (%)
Place of birth for the foreign-born population - Other Northern Africa (%)
Place of birth for the foreign-born population - South Africa (%)
Place of birth for the foreign-born population - Other Southern Africa (%)
Place of birth for the foreign-born population - Cabo Verde (%)
Place of birth for the foreign-born population - Ghana (%)
Place of birth for the foreign-born population - Liberia (%)
Place of birth for the foreign-born population - Nigeria (%)
Place of birth for the foreign-born population - Senegal (%)
Place of birth for the foreign-born population - Sierra Leone (%)
Place of birth for the foreign-born population - Other Western Africa (%)
Place of birth for the foreign-born population - Australia (%)
Place of birth for the foreign-born population - New Zealand (%)
Place of birth for the foreign-born population - Fiji (%)
Place of birth for the foreign-born population - Micronesia (%)
Place of birth for the foreign-born population - Bahamas (%)
Place of birth for the foreign-born population - Barbados (%)
Place of birth for the foreign-born population - Cuba (%)
Place of birth for the foreign-born population - Dominica (%)
Place of birth for the foreign-born population - Dominican Republic (%)
Place of birth for the foreign-born population - Grenada (%)
Place of birth for the foreign-born population - Haiti (%)
Place of birth for the foreign-born population - Jamaica (%)
Place of birth for the foreign-born population - St. Vincent and the Grenadines (%)
Place of birth for the foreign-born population - Trinidad and Tobago (%)
Place of birth for the foreign-born population - West Indies (%)
Place of birth for the foreign-born population - Other Caribbean (%)
Place of birth for the foreign-born population - Belize (%)
Place of birth for the foreign-born population - Costa Rica (%)
Place of birth for the foreign-born population - El Salvador (%)
Place of birth for the foreign-born population - Guatemala (%)
Place of birth for the foreign-born population - Honduras (%)
Place of birth for the foreign-born population - Mexico (%)
Place of birth for the foreign-born population - Nicaragua (%)
Place of birth for the foreign-born population - Panama (%)
Place of birth for the foreign-born population - Other Central America (%)
Place of birth for the foreign-born population - Argentina (%)
Place of birth for the foreign-born population - Bolivia (%)
Place of birth for the foreign-born population - Brazil (%)
Place of birth for the foreign-born population - Chile (%)
Place of birth for the foreign-born population - Colombia (%)
Place of birth for the foreign-born population - Ecuador (%)
Place of birth for the foreign-born population - Guyana (%)
Place of birth for the foreign-born population - Peru (%)
Place of birth for the foreign-born population - Uruguay (%)
Place of birth for the foreign-born population - Venezuela (%)
Place of birth for the foreign-born population - Other South America (%)
Place of birth for the foreign-born population - Canada (%)
Place of birth for the foreign-born population - Other Northern America (%)
Place of birth for the foreign-born population - Other (%)
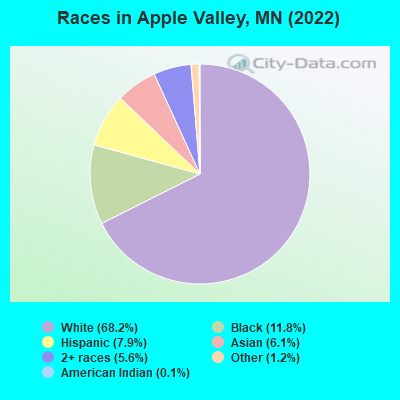
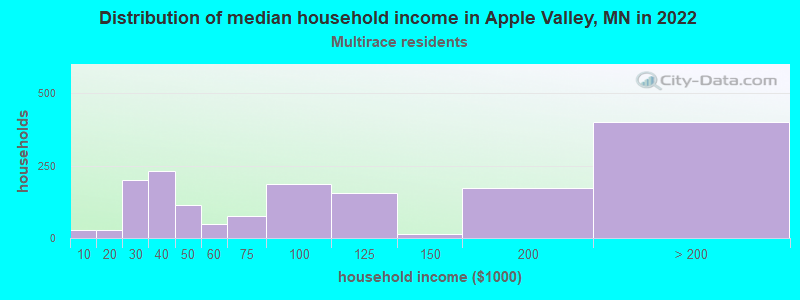
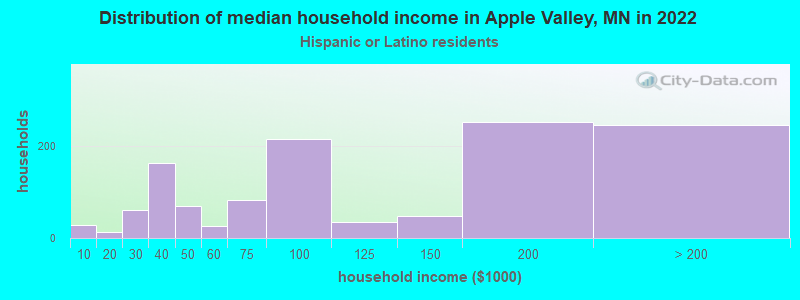
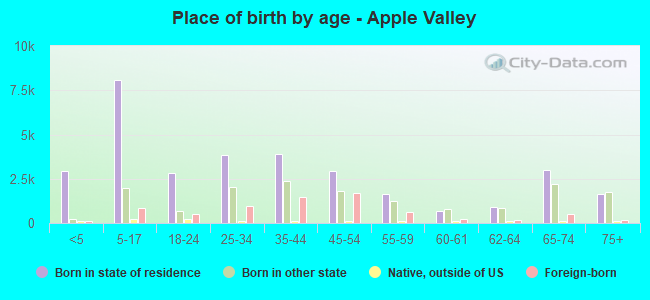
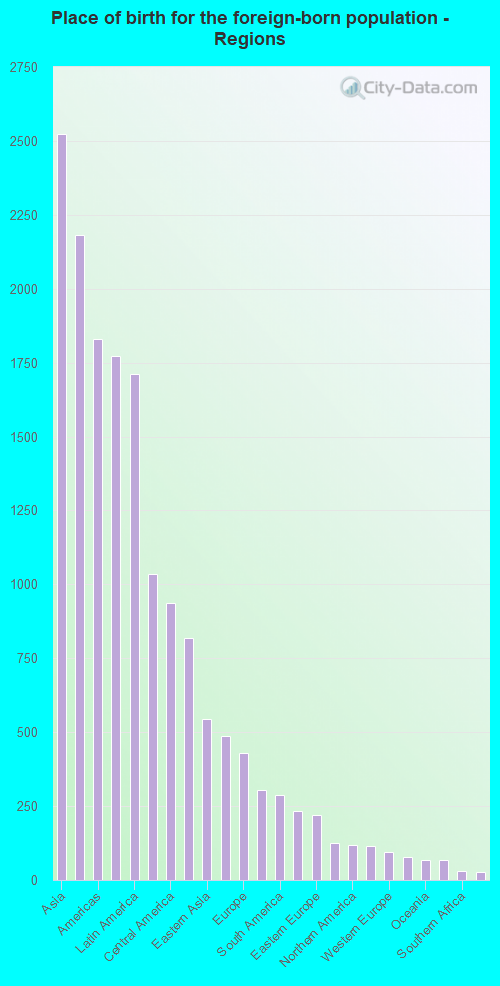
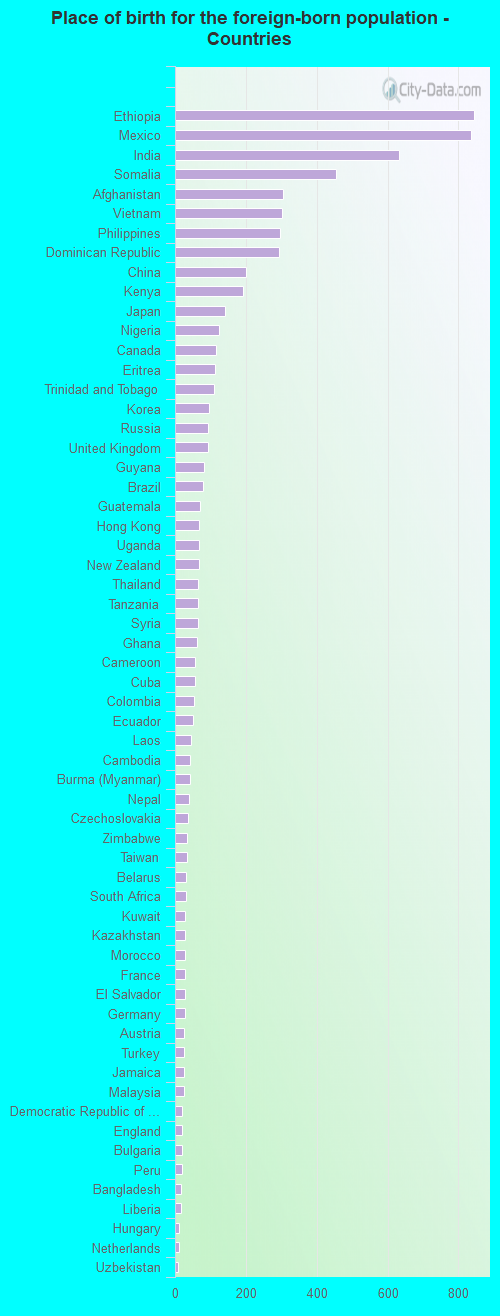
According to 2022 data, the most numerous races in Apple Valley, MN are White alone (38,295 residents), Black alone (6,596 residents), and Hispanic (4,441 residents). 84.0% of Apple Valley residents speak English at home. 12.5% of Apple Valley, MN residents are foreign-born (4.4% born in Asia, 3.8% born in Africa, 3.0% born in Latin America), which is 36.2% greater than the foreign-born rate of 8.0% across the entire state of Minnesota.
Race distribution in Apple Valley
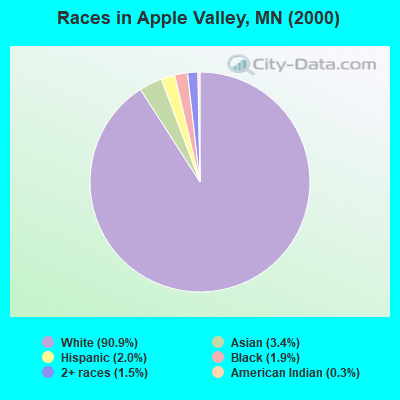
2000 2022
4,337,143 88.2% White alone 168,813 3.4% Black alone 143,382 2.9% Hispanic 141,083 2.9% Asian alone 70,304 1.4% Two or more races 52,009 1.1% American Indian alone 5,031 0.1% Other race alone 1,714 0.03% Native Hawaiian and Other
4,356,347 76.2% White alone 395,179 6.9% Black alone 333,830 5.8% Hispanic 294,800 5.2% Asian alone 259,649 4.5% Two or more races 42,125 0.7% American Indian alone 32,976 0.6% Other race alone 2,278 0.04% Native Hawaiian and Other
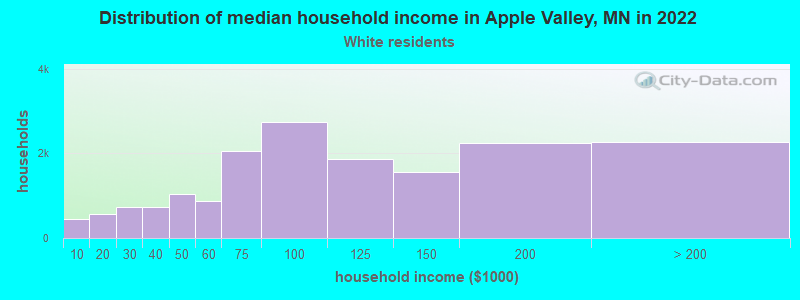
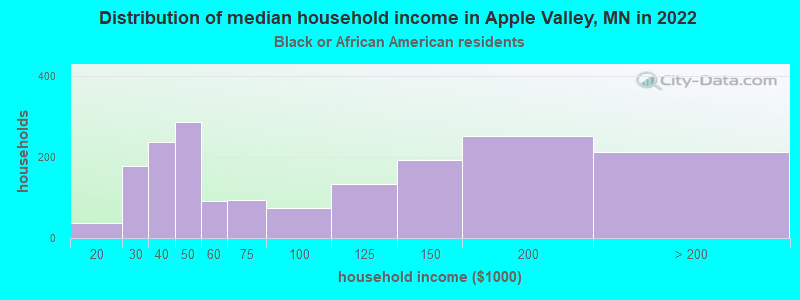
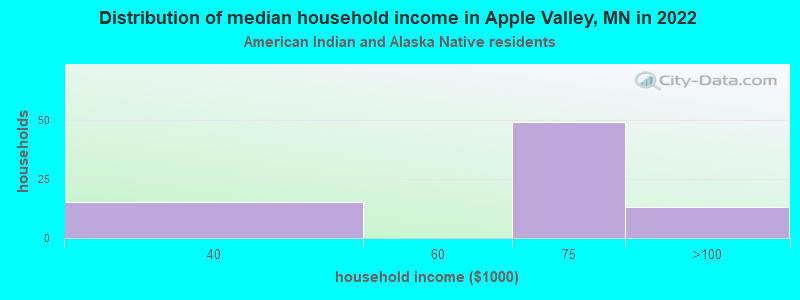
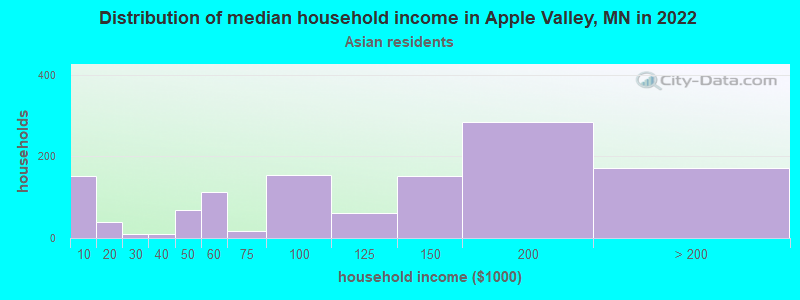
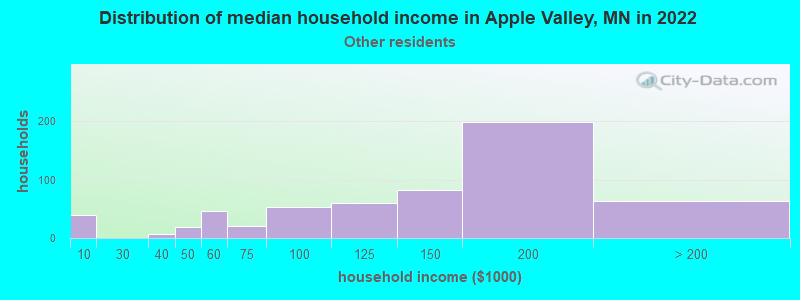
Income and house value in Apple Valley Median household income in 2022 $93,985 White non-Hispanic householders$67,466 Black householders$71,095 American Indian and Alaska Native householders$107,833 Asian householders$163,736 Some other race householders$92,291 Two or more races householders$102,237 Hispanic or Latino race householdersMedian 2022 house value $367,865 White Non-Hispanic householders$333,860 Black or African American householders$366,676 American Indian or Alaska Native householders $344,561 Asian householders$326,964 Native Hawaiian and other Pacific Islander householders$323,635 Some other race householders$416,137 Two or more races householders$332,671 Hispanic or Latino householders
Median age by race in Apple Valley
43.4 Median age for White residents40.9 45.6 24.6 Median age for Black or African American residents26.3 23.3 28.8 Median age for American Indian / Alaska Native residents29.3 43.5 34.7 Median age for Asian residents35.4 32.7 -744,336,568.8 Median age for Native Hawaiian / Pacific Islander residents-856,799,036.4 -534,959,349.1 28.9 Median age for Other race residents32.2 31.7 23.2 Median age for Two or more races residents27.8 22.7 43.8 Median age for White alone residents41.2 45.9 25.1 Median age for Hispanic or Latino residents27.7 21.9
Owner/renter occupied households by race in Apple Valley
House owners and renters - White residents 13,038 76.1% Owner occupied4,096 23.9% Renter occupiedHouse owners and renters - Black or African American residents 827 50.7% Owner occupied804 49.3% Renter occupiedHouse owners and renters - American Indian / Alaska Native residents 11 14.8% Owner occupied65 85.2% Renter occupiedHouse owners and renters - Asian residents 1,014 84.1% Owner occupied191 15.9% Renter occupiedHouse owners and renters - Other race residents 448 74.3% Owner occupied155 25.7% Renter occupiedHouse owners and renters - Two or more races residents 1,078 71.2% Owner occupied437 28.8% Renter occupiedHouse owners and renters - White alone residents 13,006 76.2% Owner occupied4,064 23.8% Renter occupiedHouse owners and renters - Hispanic or Latino residents 686 59.8% Owner occupied461 40.2% Renter occupied
Language usage in Apple Valley
English speakers - Total 84.0% of residents of Apple Valley speak English at home.
6.6% of residents speak Spanish at home 1,680 48.2% Speak English very well1,806 51.8% Speak English less than very well9.5% of residents speak other language at home 3,354 67.1% Speak English very well1,645 32.9% Speak English less than very well
English speakers - Born in the United States 95.8% of residents of Apple Valley speak English at home.
2.3% of residents speak Spanish at home 132 36.6% Speak English very well229 63.4% Speak English less than very well2.5% of residents speak other language at home 378 97.4% Speak English very well10 2.6% Speak English less than very well
English speakers - Native, born elsewhere 76.2% of residents of Apple Valley speak English at home.
31.8% of residents speak Spanish at home 179 76.2% Speak English very well56 23.8% Speak English less than very well0.8% of residents speak other language at home 6 100.0% Speak English very well
English speakers - Foreign-born 21.1% of residents of Apple Valley speak English at home.
21.7% of residents speak Spanish at home 609 39.6% Speak English very well929 60.4% Speak English less than very well53.0% of residents speak other language at home 2,334 62.1% Speak English very well1,426 37.9% Speak English less than very well
White (Caucasian) - Speak only English Native:
98.0% (35,354)Foreign-born:
48.3% (455)
White (Caucasian) - Speak another language Native:
1.8% (649)Foreign-born:
53.0% (499)
Black or African American - Speak only English Native:
85.5% (3,545)Foreign-born:
16.9% (335)
Black or African American - Speak another language Native:
12.3% (509)Foreign-born:
83.1% (1,648)
Asian - Speak only English Native:
67.6% (694)Foreign-born:
20.8% (415)
Asian - Speak another language Native:
33.7% (346)Foreign-born:
79.2% (1,582)
Other race - Speak only English Native:
36.5% (384)Foreign-born:
5.9% (62)
Other race - Speak another language Native:
63.0% (662)Foreign-born:
92.5% (963)
Two or more races - Speak only English Native:
80.3% (3,057)Foreign-born:
14.7% (164)
Two or more races - Speak another language Native:
16.5% (628)Foreign-born:
81.1% (904)
White alone - Speak only English Native:
98.4% (35,081)Foreign-born:
52.7% (467)
White alone - Speak another language Native:
1.5% (536)Foreign-born:
47.9% (424)
Hispanic or Latino - Speak only English Native:
44.5% (1,084)Foreign-born:
5.2% (97)
Hispanic or Latino - Speak another language Native:
55.8% (1,359)Foreign-born:
96.0% (1,806)
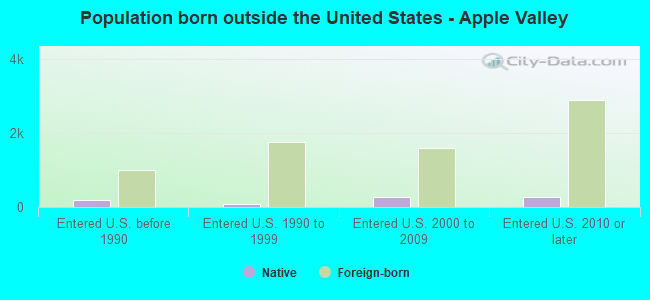
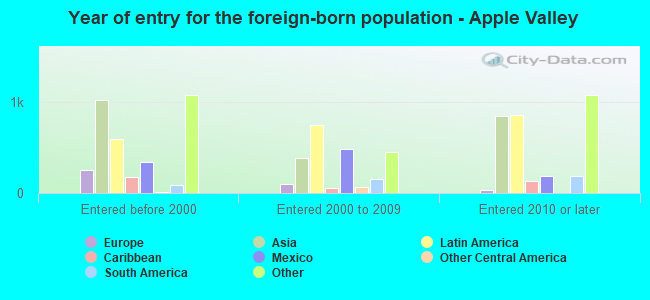
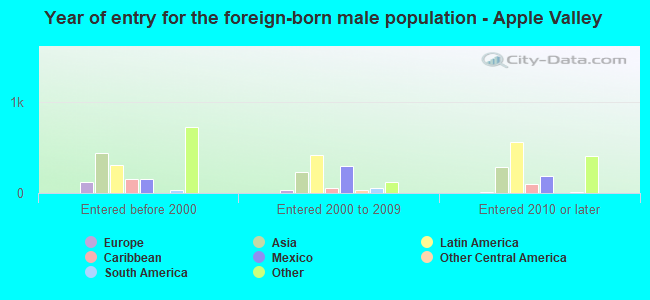
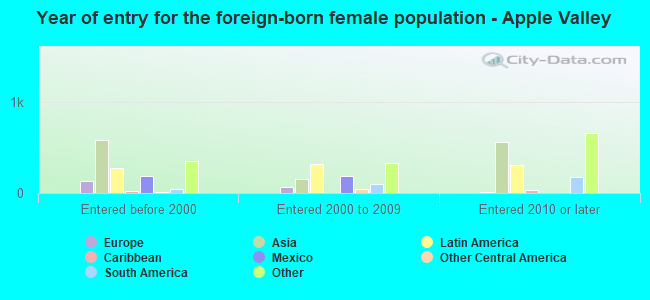
Foreign-born residents in Apple Valley 7,035 residents are foreign born (4.4% Asia , 3.8% Africa , 3.0% Latin America ).
This city:
12.5%Minnesota:
8.5%
Marital status for residents in Apple Valley Marital status - White (Caucasian) population 15 years and over
Males 27.4% Never married61.3% Now married0.4% Separated2.6% Widowed8.2% DivorcedFemales 23.8% Never married53.5% Now married0.4% Separated7.4% Widowed14.9% DivorcedWomen who gave birth in the past 12 months Now married:
57.3% (260)Unmarried:
42.7% (193)
Women who did not give birth in the past 12 months Now married:
47.1% (3,541)Unmarried:
52.9% (3,975)
Marital status - Black or African American population 15 years and over
Males 33.9% Never married40.8% Now married3.0% Separated2.1% Widowed20.1% DivorcedFemales 52.4% Never married30.4% Now married0.0% Separated2.3% Widowed14.9% DivorcedWomen who gave birth in the past 12 months Now married:
81.1% (103)Unmarried:
18.9% (24)
Women who did not give birth in the past 12 months Now married:
25.8% (465)Unmarried:
74.2% (1,340)
Marital status - American Indian / Alaska Native population 15 years and over
Males 82.2% Never married17.8% Now married0.0% Separated0.0% Widowed0.0% DivorcedFemales 15.0% Never married80.0% Now married0.0% Separated0.0% Widowed5.0% DivorcedWomen who did not give birth in the past 12 months Now married:
71.4% (10)Unmarried:
28.6% (4)
Marital status - Asian population 15 years and over
Males 27.3% Never married67.8% Now married1.5% Separated0.0% Widowed3.4% DivorcedFemales 26.7% Never married62.4% Now married0.0% Separated3.2% Widowed7.7% DivorcedWomen who gave birth in the past 12 months Now married:
85.0% (180)Unmarried:
15.0% (32)
Women who did not give birth in the past 12 months Now married:
53.7% (433)Unmarried:
46.3% (373)
Marital status - Other race population 15 years and over
Males 38.1% Never married54.6% Now married0.0% Separated0.0% Widowed7.3% DivorcedFemales 35.4% Never married58.5% Now married0.0% Separated0.0% Widowed6.1% DivorcedWomen who gave birth in the past 12 months Now married:
100.0% (22)Unmarried:
0.0% (0)
Women who did not give birth in the past 12 months Now married:
35.9% (170)Unmarried:
64.1% (304)
Marital status - Two or more races population 15 years and over
Males 53.5% Never married33.8% Now married0.0% Separated0.0% Widowed12.7% DivorcedFemales 42.8% Never married30.0% Now married0.0% Separated0.2% Widowed27.0% DivorcedWomen who gave birth in the past 12 months Now married:
100.0% (18)Unmarried:
0.0% (0)
Women who did not give birth in the past 12 months Now married:
26.7% (290)Unmarried:
73.3% (798)
Marital status - White alone, not Hispanic / Latino population 15 years and over
Males 27.0% Never married62.0% Now married0.4% Separated2.5% Widowed8.0% DivorcedFemales 23.6% Never married53.2% Now married0.5% Separated7.5% Widowed15.2% DivorcedWomen who gave birth in the past 12 months Now married:
58.9% (267)Unmarried:
41.1% (186)
Women who did not give birth in the past 12 months Now married:
46.4% (3,478)Unmarried:
53.6% (4,016)
Marital status - Hispanic or Latino population 15 years and over
Males 41.9% Never married37.0% Now married0.0% Separated1.4% Widowed19.6% DivorcedFemales 35.2% Never married46.2% Now married0.0% Separated0.0% Widowed18.5% DivorcedWomen who gave birth in the past 12 months Now married:
43.5% (11)Unmarried:
56.5% (14)
Women who did not give birth in the past 12 months Now married:
38.8% (309)Unmarried:
61.2% (488)
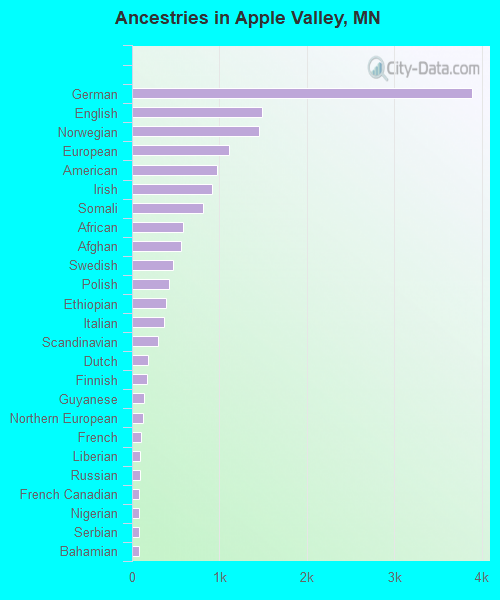
Ancestries in Apple Valley
3,886 17.4% German1,484 6.6% English1,450 6.5% Norwegian1,104 4.9% European970 4.3% American913 4.1% Irish813 3.6% Somali582 2.6% African556 2.5% Afghan464 2.1% Swedish427 1.9% Polish393 1.8% Ethiopian369 1.6% Italian297 1.3% Scandinavian188 0.8% Dutch166 0.7% Finnish139 0.6% Guyanese129 0.6% Northern European104 0.5% French94 0.4% Liberian90 0.4% Russian85 0.4% French Canadian84 0.4% Nigerian83 0.4% Serbian81 0.4% Bahamian70 0.3% Swiss66 0.3% British65 0.3% Czech62 0.3% Scotch-Irish56 0.3% Syrian54 0.2% Danish49 0.2% Austrian46 0.2% Slovak43 0.2% Jamaican41 0.2% New Zealander38 0.2% Eastern European38 0.2% Welsh34 0.2% Turkish32 0.1% Ukrainian30 0.1% Greek29 0.1% Portuguese28 0.1% Kenyan27 0.1% Czechoslovakian22 0.10% Bulgarian18 0.08% Slovene14 0.06% Hungarian12 0.05% Scottish12 0.05% Romanian12 0.05% Moroccan4 0.02% Slavic
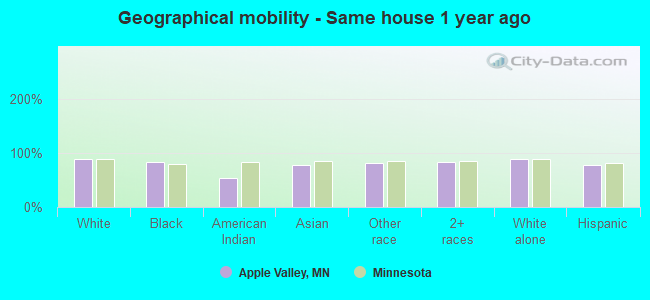
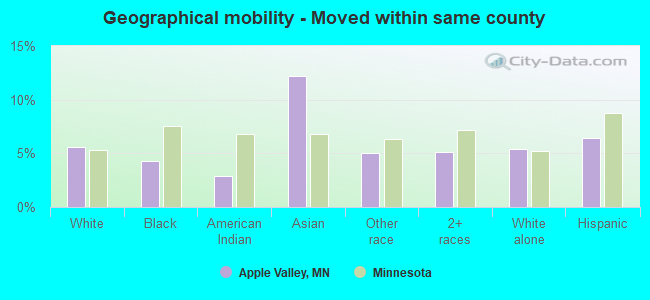
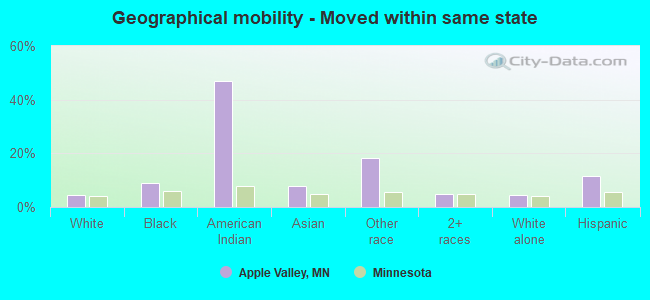
Geographical mobility in Apple Valley Same house 1 year ago 34,138 88.7% White (Caucasian)5,463 83.1% Black or African American60 53.3% American Indian / Alaska Native2,488 77.1% Asian1,780 80.9% Other race4,211 82.9% Two or more races33,659 88.7% White alone, not Hispanic / Latino3,423 77.2% Hispanic or LatinoMoved within same county 2,158 5.6% White / Caucasian284 4.3% Black or African American3 2.9% American Indian / Alaska Native394 12.2% Asian111 5.0% Other race261 5.1% Two or more races2,036 5.4% White alone, not Hispanic / Latino286 6.5% Hispanic or LatinoMoved within same state 1,788 4.6% White / Caucasian595 9.1% Black or African American53 46.9% American Indian / Alaska Native250 7.8% Asian405 18.4% Other race250 4.9% Two or more races1,749 4.6% White alone, not Hispanic / Latino518 11.7% Hispanic or LatinoMoved from different state 299 0.8% White / Caucasian13 0.2% Black or African American27 0.8% Asian295 5.8% Two or more races322 0.8% White alone, not Hispanic / Latino105 2.4% Hispanic or LatinoMoved from abroad 82 0.2% White4 0.1% Asian95 0.3% White alone, not Hispanic / Latino
Children Nativity (place of birth) in Apple Valley
Children under 6 years - Living with two parents Both parents native 2,136 100.0% NativeBoth parents foreign-born 884 87.4% Native127 12.6% Foreign-bornOne native, one foreign-born parent 243 100.0% NativeChildren under 6 years - Living with one parent Native parent 662 100.0% NativeForeign-born parent 133 100.0% NativeChildren 6 to 17 years - Living with two parents Both parents native 4,912 97.3% Native135 2.7% Foreign-bornBoth parents foreign-born 644 58.0% Native467 42.0% Foreign-bornOne native, one foreign-born parent 1,003 98.6% Native14 1.4% Foreign-bornChildren 6 to 17 years - Living with one parent Native parent 1,646 100.0% NativeForeign-born parent 712 48.9% Native744 51.1% Foreign-born
Grandparents responsible for own grandchildren in Apple Valley
Grandparents (30 to 59 years) White / Caucasian 23 28.0% Responsible for grandchildren60 72.0% Not responsible for grandchildrenBlack or African American 7 100.0% Not responsible for grandchildrenAmerican Indian / Alaska Native 6 100.0% Not responsible for grandchildrenOther race 93 100.0% Not responsible for grandchildrenWhite alone, not Hispanic / Latino 24 27.1% Responsible for grandchildren64 72.9% Not responsible for grandchildrenHispanic or Latino 78 100.0% Not responsible for grandchildrenGrandparents (60 years and over) White / Caucasian 24 8.0% Responsible for grandchildren275 92.0% Not responsible for grandchildrenBlack or African American 22 37.7% Responsible for grandchildren37 62.3% Not responsible for grandchildrenOther race 42 100.0% Not responsible for grandchildrenWhite alone, not Hispanic / Latino 24 7.7% Responsible for grandchildren283 92.3% Not responsible for grandchildrenHispanic or Latino 46 100.0% Not responsible for grandchildren