Races in Arbutus, Maryland (MD) Detailed Stats
Data:
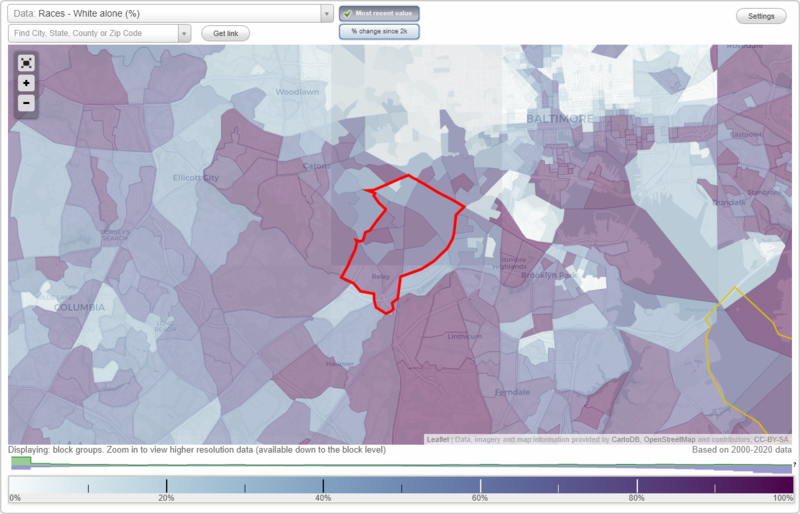
Races - White alone (%)
Races - White alone (% change since 2000)
Races - Black alone (%)
Races - Black alone (% change since 2000)
Races - American Indian alone (%)
Races - American Indian alone (% change since 2000)
Races - Asian alone (%)
Races - Asian alone (% change since 2000)
Races - Hispanic (%)
Races - Hispanic (% change since 2000)
Races - Native Hawaiian and Other Pacific Islander alone (%)
Races - Native Hawaiian and Other Pacific Islander alone (% change since 2000)
Races - Two or more races(%)
Races - Two or more races(% change since 2000)
Races - Other race alone (%)
Races - Other race alone (% change since 2000)
Racial diversity
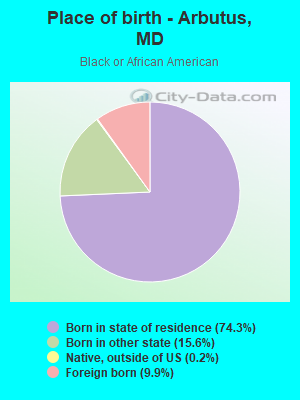
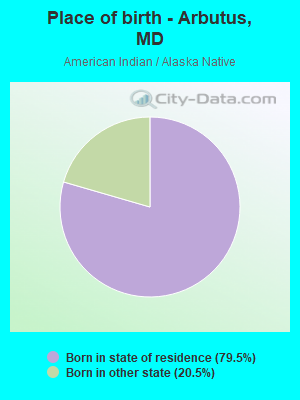
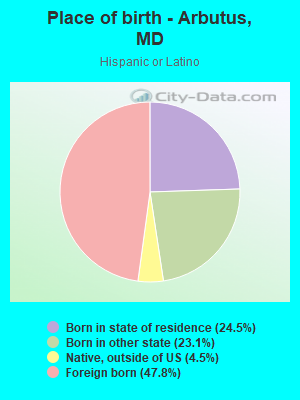
Place of birth - Born in state of residence (%)
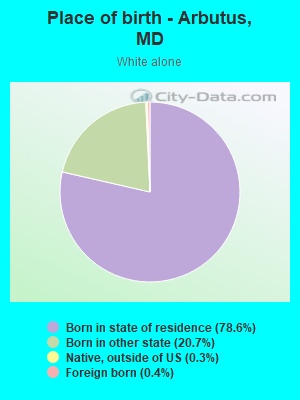
Place of birth - Born in state of residence (%) - White
Place of birth - Born in state of residence (%) - Black or African American
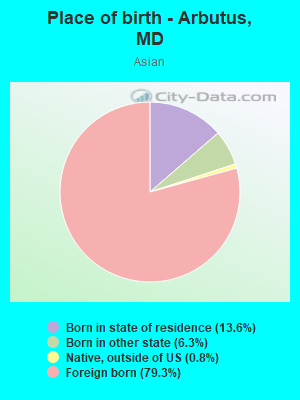
Place of birth - Born in state of residence (%) - Asian
Place of birth - Born in state of residence (%) - Hispanic or Latino
Place of birth - Born in state of residence (%) - American Indian and Alaska Native
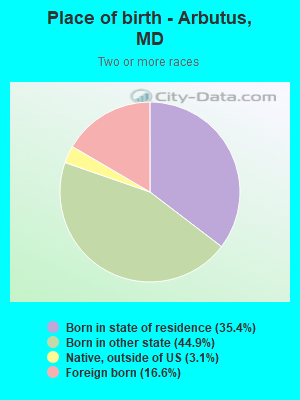
Place of birth - Born in state of residence (%) - Multirace
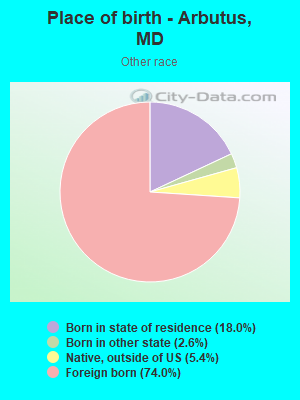
Place of birth - Born in state of residence (%) - Other Race
Place of birth - Born in other state (%)
Place of birth - Born in other state (%) - White
Place of birth - Born in other state (%) - Black or African American
Place of birth - Born in other state (%) - Asian
Place of birth - Born in other state (%) - Hispanic or Latino
Place of birth - Born in other state (%) - American Indian and Alaska Native
Place of birth - Born in other state (%) - Multirace
Place of birth - Born in other state (%) - Other Race
Place of birth - Native, outside of US (%)
Place of birth - Native, outside of US (%) - White
Place of birth - Native, outside of US (%) - Black or African American
Place of birth - Native, outside of US (%) - Asian
Place of birth - Native, outside of US (%) - Hispanic or Latino
Place of birth - Native, outside of US (%) - American Indian and Alaska Native
Place of birth - Native, outside of US (%) - Multirace
Place of birth - Native, outside of US (%) - Other Race
Place of birth - Foreign born (%)
Place of birth - Foreign born (%) - White
Place of birth - Foreign born (%) - Black or African American
Place of birth - Foreign born (%) - Asian
Place of birth - Foreign born (%) - Hispanic or Latino
Place of birth - Foreign born (%) - American Indian and Alaska Native
Place of birth - Foreign born (%) - Multirace
Place of birth - Foreign born (%) - Other Race
Residents speaking English at home (%)
Residents speaking English at home - Born in the United States (%)
Residents speaking English at home - Native, born elsewhere (%)
Residents speaking English at home - Foreign born (%)
Residents speaking Spanish at home (%)
Residents speaking Spanish at home - Born in the United States (%)
Residents speaking Spanish at home - Native, born elsewhere (%)
Residents speaking Spanish at home - Foreign born (%)
Residents speaking other language at home (%)
Residents speaking other language at home - Born in the United States (%)
Residents speaking other language at home - Native, born elsewhere (%)
Residents speaking other language at home - Foreign born (%)
Marital status - Never married (%)
Marital status - Now married (%)
Marital status - Separated (%)
Marital status - Widowed (%)
Marital status - Divorced (%)
Ancestries Reported - Arab (%)
Ancestries Reported - Czech (%)
Ancestries Reported - Danish (%)
Ancestries Reported - Dutch (%)
Ancestries Reported - English (%)
Ancestries Reported - French (%)
Ancestries Reported - French Canadian (%)
Ancestries Reported - German (%)
Ancestries Reported - Greek (%)
Ancestries Reported - Hungarian (%)
Ancestries Reported - Irish (%)
Ancestries Reported - Italian (%)
Ancestries Reported - Lithuanian (%)
Ancestries Reported - Norwegian (%)
Ancestries Reported - Polish (%)
Ancestries Reported - Portuguese (%)
Ancestries Reported - Russian (%)
Ancestries Reported - Scotch-Irish (%)
Ancestries Reported - Scottish (%)
Ancestries Reported - Slovak (%)
Ancestries Reported - Subsaharan African (%)
Ancestries Reported - Swedish (%)
Ancestries Reported - Swiss (%)
Ancestries Reported - Ukrainian (%)
Ancestries Reported - United States (%)
Ancestries Reported - Welsh (%)
Ancestries Reported - West Indian (%)
Ancestries Reported - Other (%)
Geographical mobility - Same house 1 year ago (%)
Geographical mobility - Same house 1 year ago (%) - White
Geographical mobility - Same house 1 year ago (%) - Black or African American
Geographical mobility - Same house 1 year ago (%) - Asian
Geographical mobility - Same house 1 year ago (%) - Hispanic or Latino
Geographical mobility - Same house 1 year ago (%) - American Indian and Alaska Native
Geographical mobility - Same house 1 year ago (%) - Multirace
Geographical mobility - Same house 1 year ago (%) - Other Race
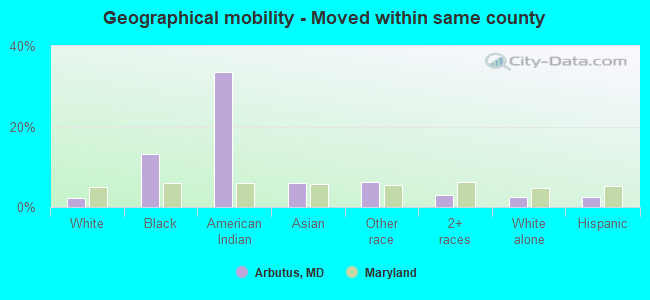
Geographical mobility - Moved within same county (%)
Geographical mobility - Moved within same county (%) - White
Geographical mobility - Moved within same county (%) - Black or African American
Geographical mobility - Moved within same county (%) - Asian
Geographical mobility - Moved within same county (%) - Hispanic or Latino
Geographical mobility - Moved within same county (%) - American Indian and Alaska Native
Geographical mobility - Moved within same county (%) - Multirace
Geographical mobility - Moved within same county (%) - Other Race
Geographical mobility - Moved from different county within same state (%)
Geographical mobility - Moved from different county within same state (%) - White
Geographical mobility - Moved from different county within same state (%) - Black or African American
Geographical mobility - Moved from different county within same state (%) - Asian
Geographical mobility - Moved from different county within same state (%) - Hispanic or Latino
Geographical mobility - Moved from different county within same state (%) - American Indian and Alaska Native
Geographical mobility - Moved from different county within same state (%) - Multirace
Geographical mobility - Moved from different county within same state (%) - Other Race
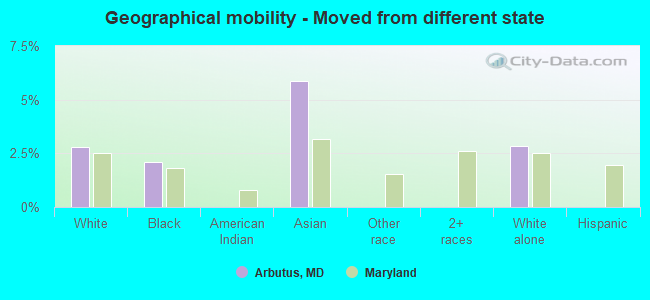
Geographical mobility - Moved from different state (%)
Geographical mobility - Moved from different state (%) - White
Geographical mobility - Moved from different state (%) - Black or African American
Geographical mobility - Moved from different state (%) - Asian
Geographical mobility - Moved from different state (%) - Hispanic or Latino
Geographical mobility - Moved from different state (%) - American Indian and Alaska Native
Geographical mobility - Moved from different state (%) - Multirace
Geographical mobility - Moved from different state (%) - Other Race
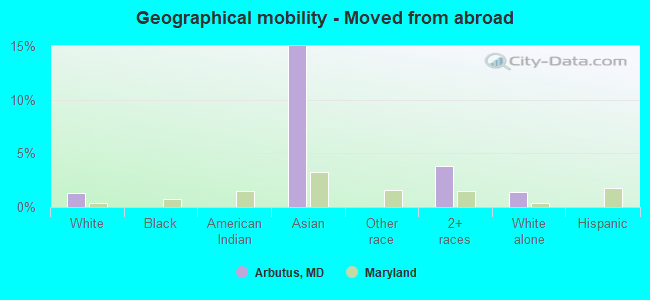
Geographical mobility - Moved from abroad (%)
Geographical mobility - Moved from abroad (%) - White
Geographical mobility - Moved from abroad (%) - Black or African American
Geographical mobility - Moved from abroad (%) - Asian
Geographical mobility - Moved from abroad (%) - Hispanic or Latino
Geographical mobility - Moved from abroad (%) - American Indian and Alaska Native
Geographical mobility - Moved from abroad (%) - Multirace
Geographical mobility - Moved from abroad (%) - Other Race
Place of birth for the foreign-born population - Ireland (%)
Place of birth for the foreign-born population - Denmark (%)
Place of birth for the foreign-born population - Norway (%)
Place of birth for the foreign-born population - Sweden (%)
Place of birth for the foreign-born population - United Kingdom (%)
Place of birth for the foreign-born population - England (%)
Place of birth for the foreign-born population - Scotland (%)
Place of birth for the foreign-born population - Other Northern Europe (%)
Place of birth for the foreign-born population - Austria (%)
Place of birth for the foreign-born population - Belgium (%)
Place of birth for the foreign-born population - France (%)
Place of birth for the foreign-born population - Germany (%)
Place of birth for the foreign-born population - Netherlands (%)
Place of birth for the foreign-born population - Switzerland (%)
Place of birth for the foreign-born population - Other Western Europe (%)
Place of birth for the foreign-born population - Greece (%)
Place of birth for the foreign-born population - Italy (%)
Place of birth for the foreign-born population - Portugal (%)
Place of birth for the foreign-born population - Spain (%)
Place of birth for the foreign-born population - Other Southern Europe (%)
Place of birth for the foreign-born population - Albania (%)
Place of birth for the foreign-born population - Belarus (%)
Place of birth for the foreign-born population - Bosnia and Herzegovina (%)
Place of birth for the foreign-born population - Bulgaria (%)
Place of birth for the foreign-born population - Croatia (%)
Place of birth for the foreign-born population - Czechoslovakia (%)
Place of birth for the foreign-born population - Hungary (%)
Place of birth for the foreign-born population - Latvia (%)
Place of birth for the foreign-born population - Lithuania (%)
Place of birth for the foreign-born population - North Macedonia (Macedonia) (%)
Place of birth for the foreign-born population - Moldova (%)
Place of birth for the foreign-born population - Poland (%)
Place of birth for the foreign-born population - Romania (%)
Place of birth for the foreign-born population - Russia (%)
Place of birth for the foreign-born population - Serbia (%)
Place of birth for the foreign-born population - Ukraine (%)
Place of birth for the foreign-born population - Other Eastern Europe (%)
Place of birth for the foreign-born population - China (%)
Place of birth for the foreign-born population - Hong Kong (%)
Place of birth for the foreign-born population - Taiwan (%)
Place of birth for the foreign-born population - Japan (%)
Place of birth for the foreign-born population - Korea (%)
Place of birth for the foreign-born population - Other Eastern Asia (%)
Place of birth for the foreign-born population - Afghanistan (%)
Place of birth for the foreign-born population - Bangladesh (%)
Place of birth for the foreign-born population - India (%)
Place of birth for the foreign-born population - Iran (%)
Place of birth for the foreign-born population - Kazakhstan (%)
Place of birth for the foreign-born population - Nepal (%)
Place of birth for the foreign-born population - Pakistan (%)
Place of birth for the foreign-born population - Sri Lanka (%)
Place of birth for the foreign-born population - Uzbekistan (%)
Place of birth for the foreign-born population - Other South Central Asia (%)
Place of birth for the foreign-born population - Burma (%)
Place of birth for the foreign-born population - Cambodia (%)
Place of birth for the foreign-born population - Indonesia (%)
Place of birth for the foreign-born population - Laos (%)
Place of birth for the foreign-born population - Malaysia (%)
Place of birth for the foreign-born population - Philippines (%)
Place of birth for the foreign-born population - Singapore (%)
Place of birth for the foreign-born population - Thailand (%)
Place of birth for the foreign-born population - Vietnam (%)
Place of birth for the foreign-born population - Other South Eastern Asia (%)
Place of birth for the foreign-born population - Armenia (%)
Place of birth for the foreign-born population - Iraq (%)
Place of birth for the foreign-born population - Israel (%)
Place of birth for the foreign-born population - Jordan (%)
Place of birth for the foreign-born population - Kuwait (%)
Place of birth for the foreign-born population - Lebanon (%)
Place of birth for the foreign-born population - Saudi Arabia (%)
Place of birth for the foreign-born population - Syria (%)
Place of birth for the foreign-born population - Turkey (%)
Place of birth for the foreign-born population - Yemen (%)
Place of birth for the foreign-born population - Other Western Asia (%)
Place of birth for the foreign-born population - Eritrea (%)
Place of birth for the foreign-born population - Ethiopia (%)
Place of birth for the foreign-born population - Kenya (%)
Place of birth for the foreign-born population - Somalia (%)
Place of birth for the foreign-born population - Uganda (%)
Place of birth for the foreign-born population - Zimbabwe (%)
Place of birth for the foreign-born population - Other Eastern Africa (%)
Place of birth for the foreign-born population - Cameroon (%)
Place of birth for the foreign-born population - Congo (%)
Place of birth for the foreign-born population - Democratic Republic of Congo (Zaire) (%)
Place of birth for the foreign-born population - Other Middle Africa (%)
Place of birth for the foreign-born population - Egypt (%)
Place of birth for the foreign-born population - Morocco (%)
Place of birth for the foreign-born population - Sudan (%)
Place of birth for the foreign-born population - Other Northern Africa (%)
Place of birth for the foreign-born population - South Africa (%)
Place of birth for the foreign-born population - Other Southern Africa (%)
Place of birth for the foreign-born population - Cabo Verde (%)
Place of birth for the foreign-born population - Ghana (%)
Place of birth for the foreign-born population - Liberia (%)
Place of birth for the foreign-born population - Nigeria (%)
Place of birth for the foreign-born population - Senegal (%)
Place of birth for the foreign-born population - Sierra Leone (%)
Place of birth for the foreign-born population - Other Western Africa (%)
Place of birth for the foreign-born population - Australia (%)
Place of birth for the foreign-born population - New Zealand (%)
Place of birth for the foreign-born population - Fiji (%)
Place of birth for the foreign-born population - Micronesia (%)
Place of birth for the foreign-born population - Bahamas (%)
Place of birth for the foreign-born population - Barbados (%)
Place of birth for the foreign-born population - Cuba (%)
Place of birth for the foreign-born population - Dominica (%)
Place of birth for the foreign-born population - Dominican Republic (%)
Place of birth for the foreign-born population - Grenada (%)
Place of birth for the foreign-born population - Haiti (%)
Place of birth for the foreign-born population - Jamaica (%)
Place of birth for the foreign-born population - St. Vincent and the Grenadines (%)
Place of birth for the foreign-born population - Trinidad and Tobago (%)
Place of birth for the foreign-born population - West Indies (%)
Place of birth for the foreign-born population - Other Caribbean (%)
Place of birth for the foreign-born population - Belize (%)
Place of birth for the foreign-born population - Costa Rica (%)
Place of birth for the foreign-born population - El Salvador (%)
Place of birth for the foreign-born population - Guatemala (%)
Place of birth for the foreign-born population - Honduras (%)
Place of birth for the foreign-born population - Mexico (%)
Place of birth for the foreign-born population - Nicaragua (%)
Place of birth for the foreign-born population - Panama (%)
Place of birth for the foreign-born population - Other Central America (%)
Place of birth for the foreign-born population - Argentina (%)
Place of birth for the foreign-born population - Bolivia (%)
Place of birth for the foreign-born population - Brazil (%)
Place of birth for the foreign-born population - Chile (%)
Place of birth for the foreign-born population - Colombia (%)
Place of birth for the foreign-born population - Ecuador (%)
Place of birth for the foreign-born population - Guyana (%)
Place of birth for the foreign-born population - Peru (%)
Place of birth for the foreign-born population - Uruguay (%)
Place of birth for the foreign-born population - Venezuela (%)
Place of birth for the foreign-born population - Other South America (%)
Place of birth for the foreign-born population - Canada (%)
Place of birth for the foreign-born population - Other Northern America (%)
Place of birth for the foreign-born population - Other (%)
Latest news about races in Arbutus, MD collected exclusively by city-data.com from local newspapers, TV, and radio stations
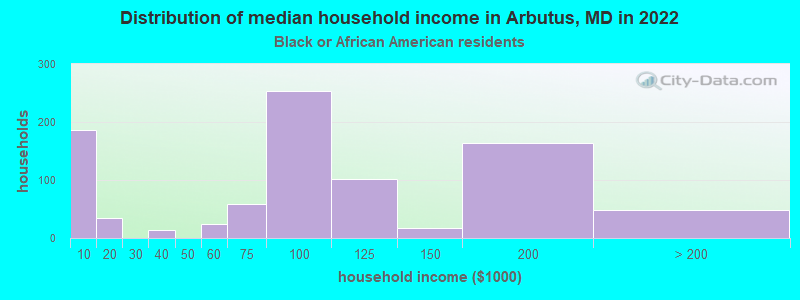
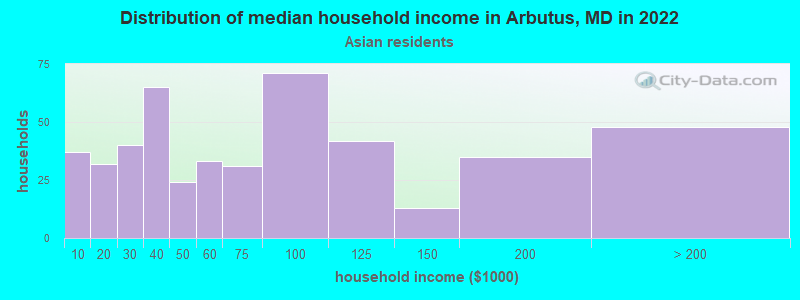
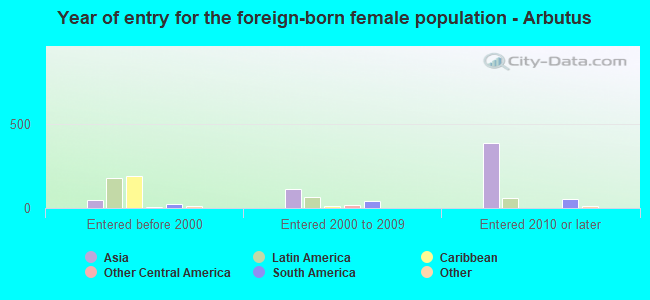
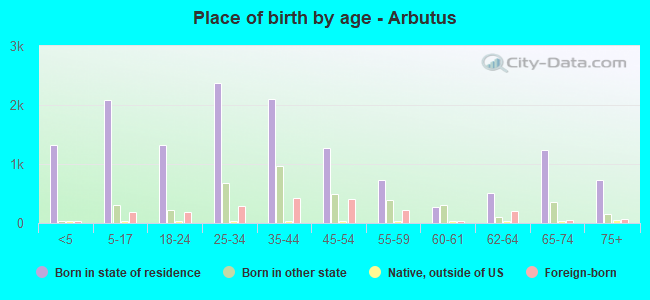
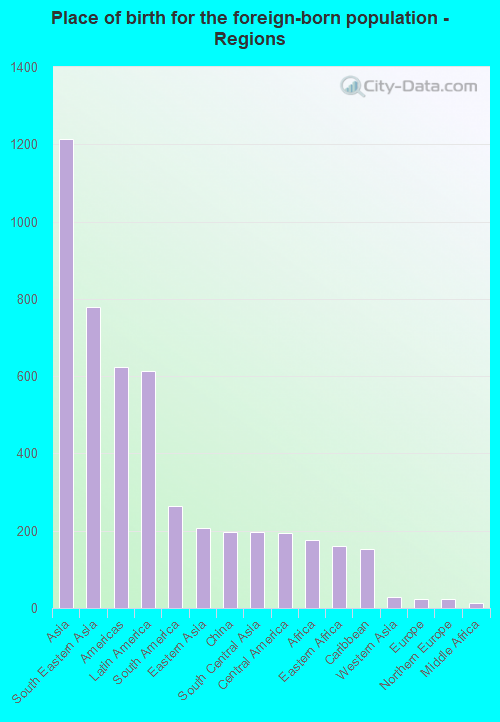
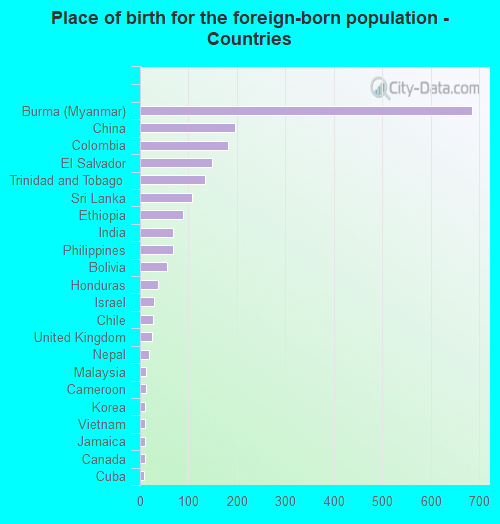
According to 2022 data, the most numerous races in Arbutus, MD are White alone (14,034 residents), Black alone (1,895 residents), and Hispanic (1,274 residents). 87.7% of Arbutus residents speak English at home. 10.2% of Arbutus, MD residents are foreign-born (5.6% born in Asia, 2.9% born in Latin America), which is 57.2% less than the foreign-born rate of 16.0% across the entire state of Maryland.
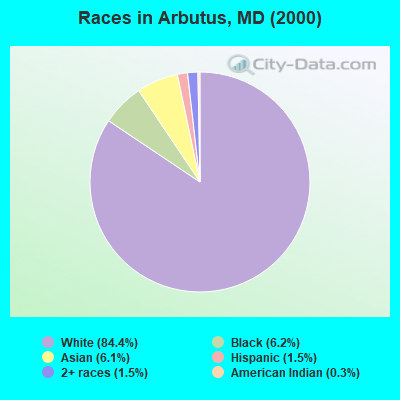
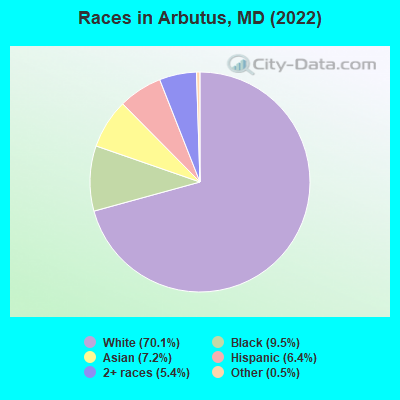
Race distribution in Arbutus
2000 2022
3,286,547 62.1% White alone 1,464,735 27.7% Black alone 227,916 4.3% Hispanic 209,738 4.0% Asian alone 82,946 1.6% Two or more races 13,312 0.3% American Indian alone 9,379 0.2% Other race alone 1,913 0.04% Native Hawaiian and Other
2,906,492 47.1% White alone 1,800,914 29.2% Black alone 705,842 11.4% Hispanic 401,818 6.5% Asian alone 291,317 4.7% Two or more races 46,930 0.8% Other race alone 8,930 0.1% American Indian alone 2,417 0.04% Native Hawaiian and Other
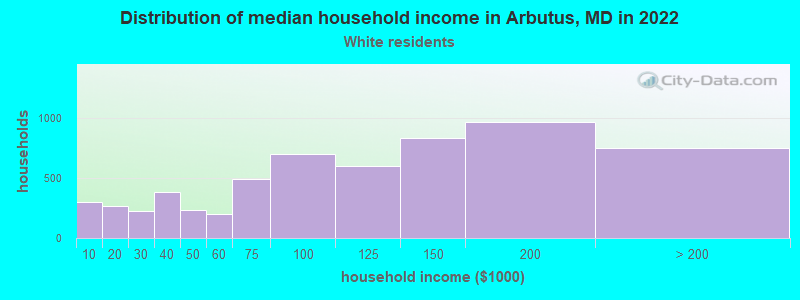
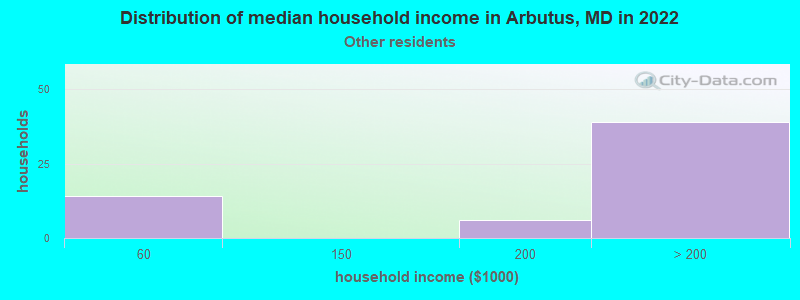
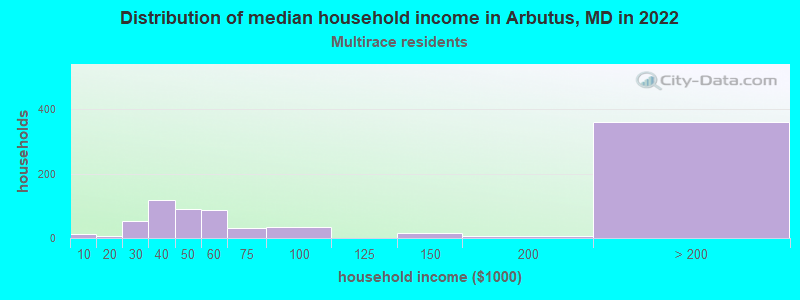
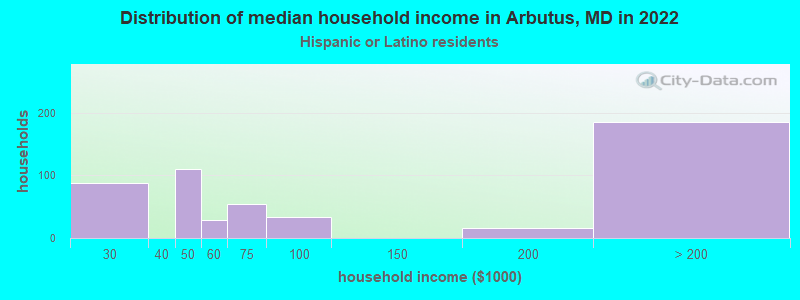
Income and house value in Arbutus Median household income in 2022 $113,921 White non-Hispanic householders$92,114 Black householders$65,455 Asian householdersover $200,000 Some other race householders$62,409 Two or more races householdersMedian 2022 house value $299,960 White Non-Hispanic householders$300,760 Black or African American householders$433,276 American Indian or Alaska Native householders $308,759 Asian householders$876,152 Some other race householders$303,160 Two or more races householders$259,966 Hispanic or Latino householders
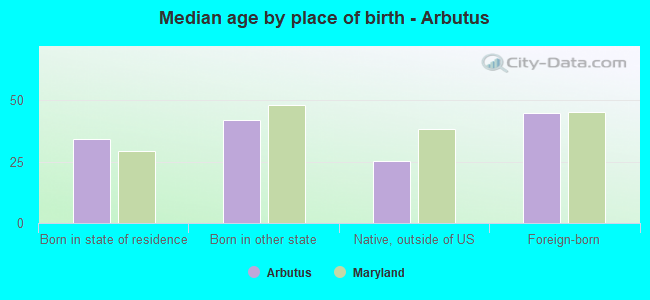
Median age by race in Arbutus
38.0 Median age for White residents36.9 39.8 37.1 Median age for Black or African American residents35.8 37.9 62.3 Median age for American Indian / Alaska Native residents-867,632,849.4 -677,419,354.2 31.6 Median age for Asian residents24.8 36.2 -1,541,125,539.6 Median age for Native Hawaiian / Pacific Islander residents-790,901,136.6 -760,942,760.2 55.2 Median age for Other race residents38.1 68.3 34.9 Median age for Two or more races residents38.7 32.3 38.2 Median age for White alone residents37.0 40.9 42.2 Median age for Hispanic or Latino residents37.8 42.3
Owner/renter occupied households by race in Arbutus
House owners and renters - White residents 4,858 81.8% Owner occupied1,082 18.2% Renter occupiedHouse owners and renters - Black or African American residents 433 50.8% Owner occupied420 49.2% Renter occupiedHouse owners and renters - American Indian / Alaska Native residents 23 100.0% Owner occupiedHouse owners and renters - Asian residents 275 55.1% Owner occupied224 44.9% Renter occupiedHouse owners and renters - Other race residents 78 100.0% Owner occupiedHouse owners and renters - Two or more races residents 494 60.5% Owner occupied323 39.5% Renter occupiedHouse owners and renters - White alone residents 4,771 82.1% Owner occupied1,042 17.9% Renter occupiedHouse owners and renters - Hispanic or Latino residents 430 76.2% Owner occupied134 23.8% Renter occupied
Language usage in Arbutus
English speakers - Total 87.7% of residents of Arbutus speak English at home.
4.2% of residents speak Spanish at home 395 50.3% Speak English very well391 49.7% Speak English less than very well8.5% of residents speak other language at home 763 48.3% Speak English very well818 51.7% Speak English less than very well
English speakers - Born in the United States 92.4% of residents of Arbutus speak English at home.
4.9% of residents speak Spanish at home 172 89.6% Speak English very well20 10.4% Speak English less than very well2.8% of residents speak other language at home 101 93.5% Speak English very well7 6.5% Speak English less than very well
English speakers - Native, born elsewhere 44.0% of residents of Arbutus speak English at home.
38.1% of residents speak Spanish at home 37 72.5% Speak English very well14 27.5% Speak English less than very well8.2% of residents speak other language at home 11 100.0% Speak English very well
English speakers - Foreign-born 15.8% of residents of Arbutus speak English at home.
23.5% of residents speak Spanish at home 77 16.3% Speak English very well394 83.7% Speak English less than very well61.9% of residents speak other language at home 456 36.7% Speak English very well786 63.3% Speak English less than very well
White (Caucasian) - Speak only English Native:
99.1% (13,134)Foreign-born:
18.3% (32)
White (Caucasian) - Speak another language Native:
1.3% (174)Foreign-born:
80.9% (141)
Black or African American - Speak only English Native:
92.8% (1,427)Foreign-born:
16.4% (31)
Black or African American - Speak another language Native:
6.2% (95)Foreign-born:
74.0% (141)
Asian - Speak only English Native:
28.9% (70)Foreign-born:
8.0% (91)
Asian - Speak another language Native:
70.8% (170)Foreign-born:
91.3% (1,033)
Other race - Speak another language Native:
95.2% (33)Foreign-born:
100.0% (327)
Two or more races - Speak only English Native:
83.8% (1,053)Foreign-born:
85.0% (214)
Two or more races - Speak another language Native:
12.9% (162)Foreign-born:
34.0% (86)
White alone - Speak only English Native:
99.8% (13,050)Foreign-born:
51.9% (32)
White alone - Speak another language Native:
0.6% (72)Foreign-born:
46.7% (28)
Hispanic or Latino - Speak only English Native:
37.7% (224)Foreign-born:
21.6% (129)
Hispanic or Latino - Speak another language Native:
56.8% (337)Foreign-born:
78.3% (468)
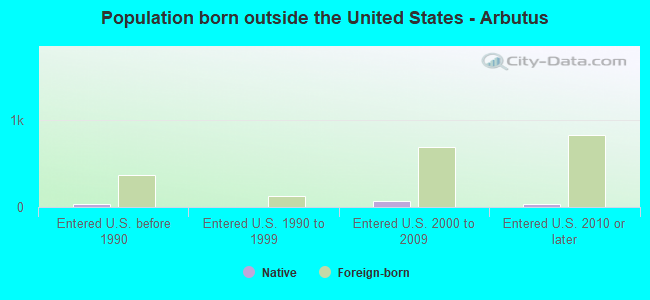
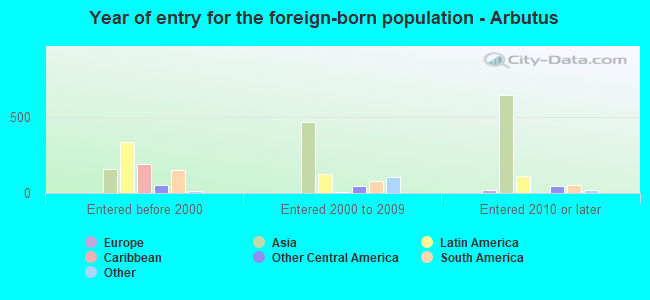
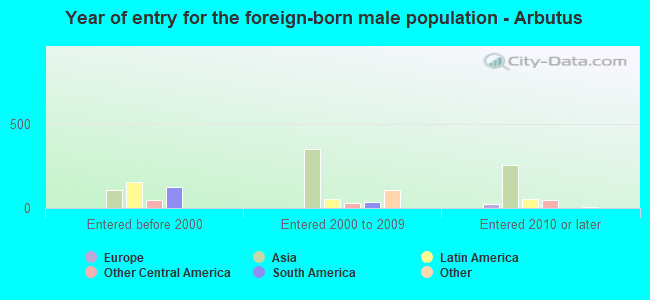
Foreign-born residents in Arbutus 2,039 residents are foreign born (5.6% Asia , 2.9% Latin America ).
This city:
10.2%Maryland:
15.7%
Marital status for residents in Arbutus Marital status - White (Caucasian) population 15 years and over
Males 40.4% Never married45.3% Now married0.9% Separated1.9% Widowed11.5% DivorcedFemales 26.6% Never married51.1% Now married0.8% Separated8.7% Widowed12.8% DivorcedWomen who gave birth in the past 12 months Now married:
87.5% (242)Unmarried:
12.5% (35)
Women who did not give birth in the past 12 months Now married:
50.8% (1,489)Unmarried:
49.2% (1,443)
Marital status - Black or African American population 15 years and over
Males 30.0% Never married68.1% Now married0.0% Separated0.0% Widowed1.8% DivorcedFemales 43.0% Never married40.5% Now married0.0% Separated0.0% Widowed16.5% DivorcedWomen who gave birth in the past 12 months Now married:
100.0% (24)Unmarried:
0.0% (0)
Women who did not give birth in the past 12 months Now married:
50.0% (246)Unmarried:
50.0% (246)
Marital status - American Indian / Alaska Native population 15 years and over
Males 100.0% Never married0.0% Now married0.0% Separated0.0% Widowed0.0% DivorcedFemales 62.5% Never married0.0% Now married0.0% Separated37.5% Widowed0.0% DivorcedMarital status - Asian population 15 years and over
Males 30.3% Never married58.6% Now married9.2% Separated1.9% Widowed0.0% DivorcedFemales 25.5% Never married71.9% Now married1.1% Separated0.0% Widowed1.5% DivorcedWomen who gave birth in the past 12 months Now married:
100.0% (72)Unmarried:
0.0% (0)
Women who did not give birth in the past 12 months Now married:
60.4% (211)Unmarried:
39.6% (138)
Marital status - Other race population 15 years and over
Males 30.8% Never married69.2% Now married0.0% Separated0.0% Widowed0.0% DivorcedFemales 46.8% Never married34.0% Now married0.0% Separated19.1% Widowed0.0% DivorcedMarital status - Two or more races population 15 years and over
Males 48.0% Never married42.2% Now married0.0% Separated0.0% Widowed9.8% DivorcedFemales 38.6% Never married57.0% Now married0.0% Separated0.0% Widowed4.4% DivorcedWomen who gave birth in the past 12 months Now married:
6.8% (6)Unmarried:
93.2% (86)
Women who did not give birth in the past 12 months Now married:
54.9% (277)Unmarried:
45.1% (228)
Marital status - White alone, not Hispanic / Latino population 15 years and over
Males 39.7% Never married45.5% Now married0.9% Separated2.0% Widowed11.9% DivorcedFemales 26.3% Never married51.0% Now married0.8% Separated8.8% Widowed13.0% DivorcedWomen who gave birth in the past 12 months Now married:
88.3% (213)Unmarried:
11.7% (28)
Women who did not give birth in the past 12 months Now married:
51.3% (1,501)Unmarried:
48.7% (1,427)
Marital status - Hispanic or Latino population 15 years and over
Males 41.5% Never married51.1% Now married0.0% Separated0.0% Widowed7.4% DivorcedFemales 29.8% Never married63.8% Now married0.0% Separated3.5% Widowed2.9% DivorcedWomen who gave birth in the past 12 months Now married:
82.5% (35)Unmarried:
17.5% (8)
Women who did not give birth in the past 12 months Now married:
62.4% (130)Unmarried:
37.6% (78)
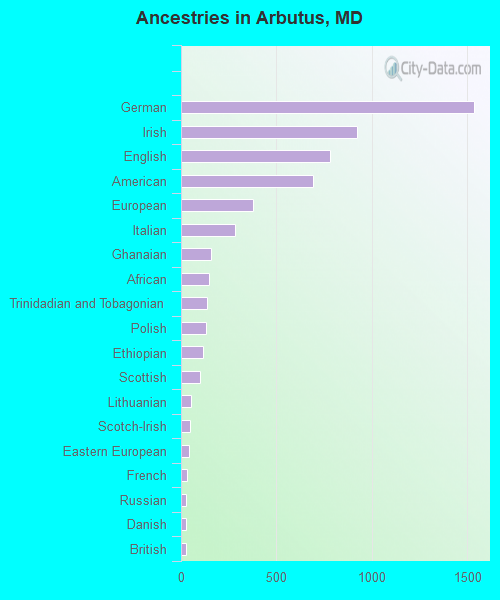
Ancestries in Arbutus
1,536 17.1% German924 10.3% Irish781 8.7% English693 7.7% American378 4.2% European281 3.1% Italian156 1.7% Ghanaian146 1.6% African138 1.5% Trinidadian and Tobagonian131 1.5% Polish117 1.3% Ethiopian99 1.1% Scottish52 0.6% Lithuanian46 0.5% Scotch-Irish42 0.5% Eastern European32 0.4% French27 0.3% Russian26 0.3% Danish25 0.3% British13 0.1% Swedish12 0.1% Greek12 0.1% Portuguese11 0.1% Hungarian10 0.1% Jamaican6 0.07% Czechoslovakian5 0.06% French Canadian5 0.06% West Indian3 0.03% Belizean
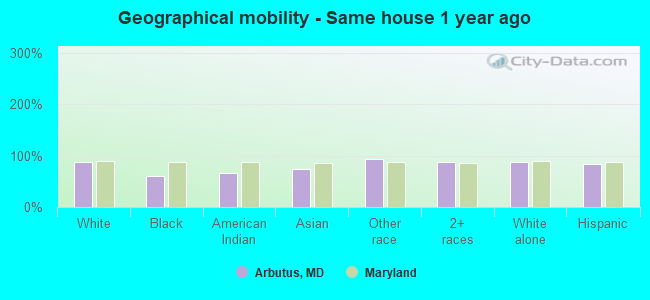
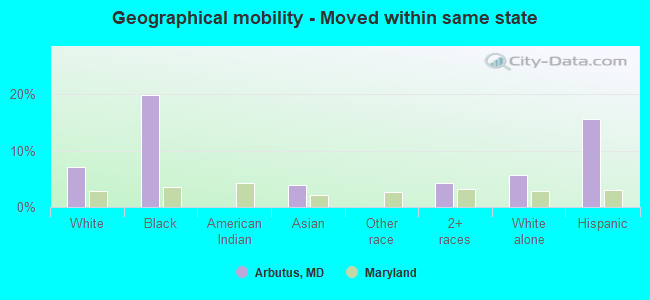
Geographical mobility in Arbutus Same house 1 year ago 12,205 87.4% White (Caucasian)1,161 61.2% Black or African American56 65.4% American Indian / Alaska Native1,046 73.4% Asian266 93.8% Other race1,382 87.6% Two or more races12,157 88.3% White alone, not Hispanic / Latino978 83.5% Hispanic or LatinoMoved within same county 310 2.2% White / Caucasian249 13.1% Black or African American29 33.6% American Indian / Alaska Native86 6.0% Asian18 6.2% Other race48 3.1% Two or more races327 2.4% White alone, not Hispanic / Latino30 2.6% Hispanic or LatinoMoved within same state 982 7.0% White / Caucasian375 19.8% Black or African American56 3.9% Asian66 4.2% Two or more races789 5.7% White alone, not Hispanic / Latino182 15.5% Hispanic or LatinoMoved from different state 392 2.8% White / Caucasian40 2.1% Black or African American84 5.9% Asian394 2.9% White alone, not Hispanic / LatinoMoved from abroad 189 1.3% White215 15.0% Asian60 3.8% Two or more races187 1.4% White alone, not Hispanic / Latino
Children Nativity (place of birth) in Arbutus
Children under 6 years - Living with two parents Both parents native 919 100.0% NativeBoth parents foreign-born 160 100.0% NativeOne native, one foreign-born parent 144 100.0% NativeChildren under 6 years - Living with one parent Native parent 214 100.0% NativeForeign-born parent 27 57.9% Native20 42.1% Foreign-bornChildren 6 to 17 years - Living with two parents Both parents native 1,511 100.0% NativeBoth parents foreign-born 180 61.8% Native111 38.2% Foreign-bornChildren 6 to 17 years - Living with one parent Native parent 421 84.9% Native75 15.1% Foreign-bornForeign-born parent 72 100.0% Native
Grandparents responsible for own grandchildren in Arbutus
Grandparents (30 to 59 years) White / Caucasian 13 15.6% Responsible for grandchildren72 84.4% Not responsible for grandchildrenAsian 12 100.0% Not responsible for grandchildrenWhite alone, not Hispanic / Latino 13 16.1% Responsible for grandchildren69 83.9% Not responsible for grandchildren
Grandparents (60 years and over) White / Caucasian 116 100.0% Not responsible for grandchildrenAsian 58 100.0% Not responsible for grandchildrenWhite alone, not Hispanic / Latino 122 100.0% Not responsible for grandchildren