Races in Arkansas City, Kansas (KS) Detailed Stats
Data:
Races - White alone (%)
Races - White alone (% change since 2000)
Races - Black alone (%)
Races - Black alone (% change since 2000)
Races - American Indian alone (%)
Races - American Indian alone (% change since 2000)
Races - Asian alone (%)
Races - Asian alone (% change since 2000)
Races - Hispanic (%)
Races - Hispanic (% change since 2000)
Races - Native Hawaiian and Other Pacific Islander alone (%)
Races - Native Hawaiian and Other Pacific Islander alone (% change since 2000)
Races - Two or more races(%)
Races - Two or more races(% change since 2000)
Races - Other race alone (%)
Races - Other race alone (% change since 2000)
Racial diversity
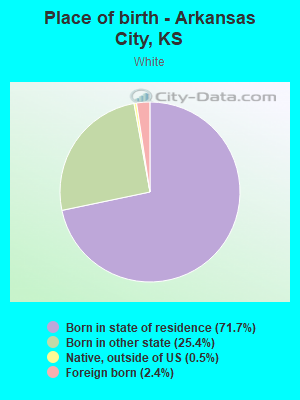
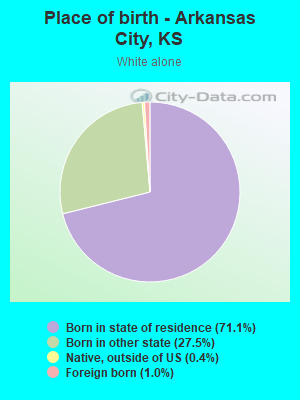
Place of birth - Born in state of residence (%)
Place of birth - Born in state of residence (%) - White
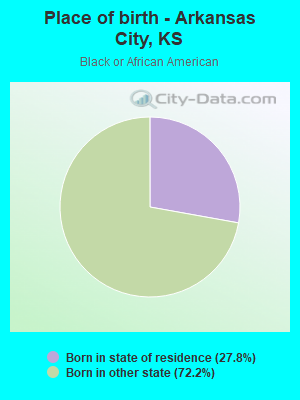
Place of birth - Born in state of residence (%) - Black or African American
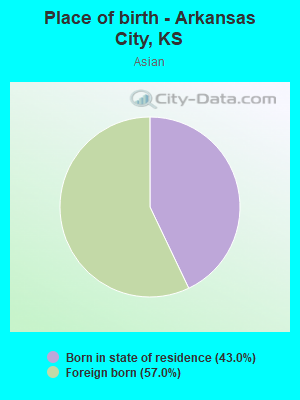
Place of birth - Born in state of residence (%) - Asian
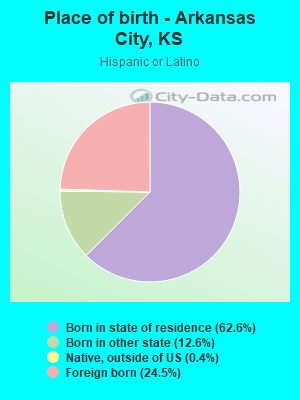
Place of birth - Born in state of residence (%) - Hispanic or Latino
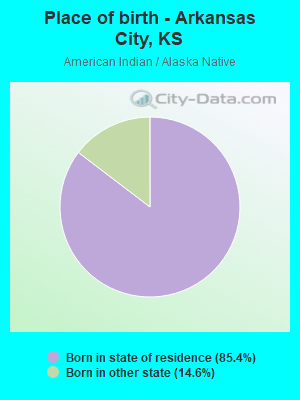
Place of birth - Born in state of residence (%) - American Indian and Alaska Native
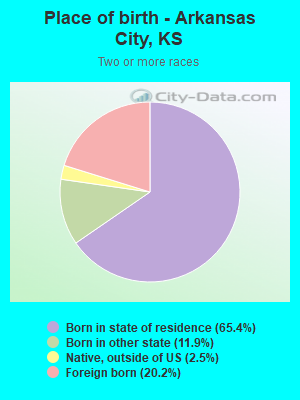
Place of birth - Born in state of residence (%) - Multirace
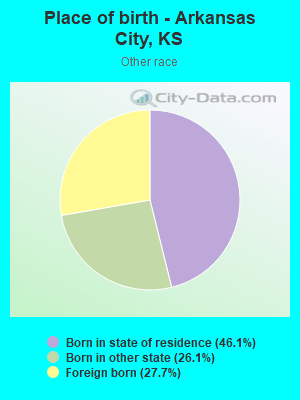
Place of birth - Born in state of residence (%) - Other Race
Place of birth - Born in other state (%)
Place of birth - Born in other state (%) - White
Place of birth - Born in other state (%) - Black or African American
Place of birth - Born in other state (%) - Asian
Place of birth - Born in other state (%) - Hispanic or Latino
Place of birth - Born in other state (%) - American Indian and Alaska Native
Place of birth - Born in other state (%) - Multirace
Place of birth - Born in other state (%) - Other Race
Place of birth - Native, outside of US (%)
Place of birth - Native, outside of US (%) - White
Place of birth - Native, outside of US (%) - Black or African American
Place of birth - Native, outside of US (%) - Asian
Place of birth - Native, outside of US (%) - Hispanic or Latino
Place of birth - Native, outside of US (%) - American Indian and Alaska Native
Place of birth - Native, outside of US (%) - Multirace
Place of birth - Native, outside of US (%) - Other Race
Place of birth - Foreign born (%)
Place of birth - Foreign born (%) - White
Place of birth - Foreign born (%) - Black or African American
Place of birth - Foreign born (%) - Asian
Place of birth - Foreign born (%) - Hispanic or Latino
Place of birth - Foreign born (%) - American Indian and Alaska Native
Place of birth - Foreign born (%) - Multirace
Place of birth - Foreign born (%) - Other Race
Residents speaking English at home (%)
Residents speaking English at home - Born in the United States (%)
Residents speaking English at home - Native, born elsewhere (%)
Residents speaking English at home - Foreign born (%)
Residents speaking Spanish at home (%)
Residents speaking Spanish at home - Born in the United States (%)
Residents speaking Spanish at home - Native, born elsewhere (%)
Residents speaking Spanish at home - Foreign born (%)
Residents speaking other language at home (%)
Residents speaking other language at home - Born in the United States (%)
Residents speaking other language at home - Native, born elsewhere (%)
Residents speaking other language at home - Foreign born (%)
Marital status - Never married (%)
Marital status - Now married (%)
Marital status - Separated (%)
Marital status - Widowed (%)
Marital status - Divorced (%)
Ancestries Reported - Arab (%)
Ancestries Reported - Czech (%)
Ancestries Reported - Danish (%)
Ancestries Reported - Dutch (%)
Ancestries Reported - English (%)
Ancestries Reported - French (%)
Ancestries Reported - French Canadian (%)
Ancestries Reported - German (%)
Ancestries Reported - Greek (%)
Ancestries Reported - Hungarian (%)
Ancestries Reported - Irish (%)
Ancestries Reported - Italian (%)
Ancestries Reported - Lithuanian (%)
Ancestries Reported - Norwegian (%)
Ancestries Reported - Polish (%)
Ancestries Reported - Portuguese (%)
Ancestries Reported - Russian (%)
Ancestries Reported - Scotch-Irish (%)
Ancestries Reported - Scottish (%)
Ancestries Reported - Slovak (%)
Ancestries Reported - Subsaharan African (%)
Ancestries Reported - Swedish (%)
Ancestries Reported - Swiss (%)
Ancestries Reported - Ukrainian (%)
Ancestries Reported - United States (%)
Ancestries Reported - Welsh (%)
Ancestries Reported - West Indian (%)
Ancestries Reported - Other (%)
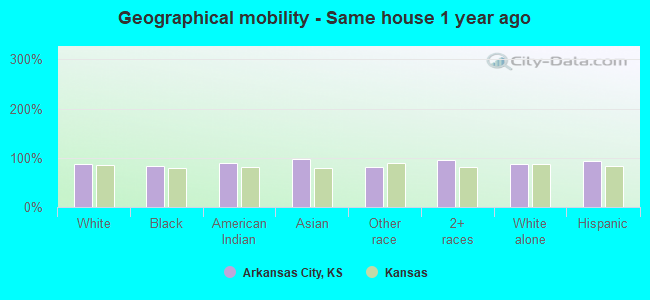
Geographical mobility - Same house 1 year ago (%)
Geographical mobility - Same house 1 year ago (%) - White
Geographical mobility - Same house 1 year ago (%) - Black or African American
Geographical mobility - Same house 1 year ago (%) - Asian
Geographical mobility - Same house 1 year ago (%) - Hispanic or Latino
Geographical mobility - Same house 1 year ago (%) - American Indian and Alaska Native
Geographical mobility - Same house 1 year ago (%) - Multirace
Geographical mobility - Same house 1 year ago (%) - Other Race
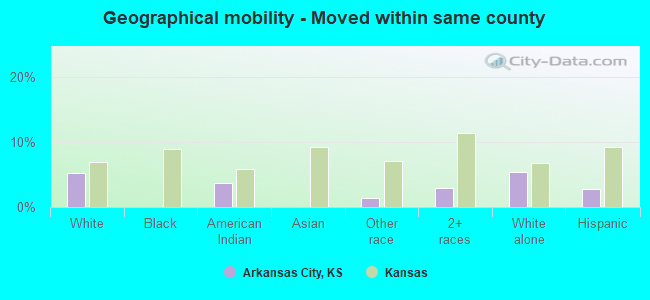
Geographical mobility - Moved within same county (%)
Geographical mobility - Moved within same county (%) - White
Geographical mobility - Moved within same county (%) - Black or African American
Geographical mobility - Moved within same county (%) - Asian
Geographical mobility - Moved within same county (%) - Hispanic or Latino
Geographical mobility - Moved within same county (%) - American Indian and Alaska Native
Geographical mobility - Moved within same county (%) - Multirace
Geographical mobility - Moved within same county (%) - Other Race
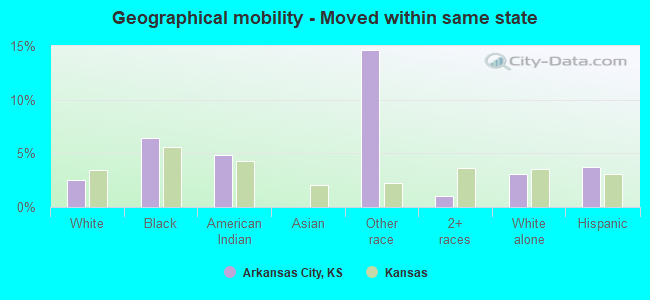
Geographical mobility - Moved from different county within same state (%)
Geographical mobility - Moved from different county within same state (%) - White
Geographical mobility - Moved from different county within same state (%) - Black or African American
Geographical mobility - Moved from different county within same state (%) - Asian
Geographical mobility - Moved from different county within same state (%) - Hispanic or Latino
Geographical mobility - Moved from different county within same state (%) - American Indian and Alaska Native
Geographical mobility - Moved from different county within same state (%) - Multirace
Geographical mobility - Moved from different county within same state (%) - Other Race
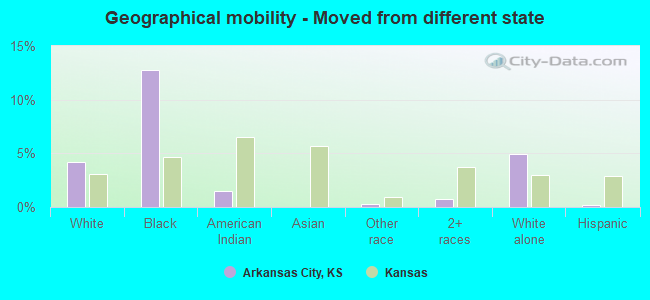
Geographical mobility - Moved from different state (%)
Geographical mobility - Moved from different state (%) - White
Geographical mobility - Moved from different state (%) - Black or African American
Geographical mobility - Moved from different state (%) - Asian
Geographical mobility - Moved from different state (%) - Hispanic or Latino
Geographical mobility - Moved from different state (%) - American Indian and Alaska Native
Geographical mobility - Moved from different state (%) - Multirace
Geographical mobility - Moved from different state (%) - Other Race
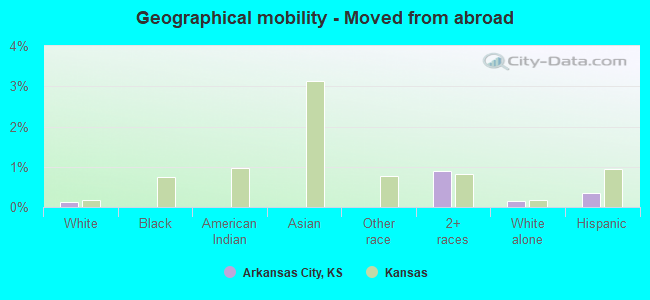
Geographical mobility - Moved from abroad (%)
Geographical mobility - Moved from abroad (%) - White
Geographical mobility - Moved from abroad (%) - Black or African American
Geographical mobility - Moved from abroad (%) - Asian
Geographical mobility - Moved from abroad (%) - Hispanic or Latino
Geographical mobility - Moved from abroad (%) - American Indian and Alaska Native
Geographical mobility - Moved from abroad (%) - Multirace
Geographical mobility - Moved from abroad (%) - Other Race
Place of birth for the foreign-born population - Ireland (%)
Place of birth for the foreign-born population - Denmark (%)
Place of birth for the foreign-born population - Norway (%)
Place of birth for the foreign-born population - Sweden (%)
Place of birth for the foreign-born population - United Kingdom (%)
Place of birth for the foreign-born population - England (%)
Place of birth for the foreign-born population - Scotland (%)
Place of birth for the foreign-born population - Other Northern Europe (%)
Place of birth for the foreign-born population - Austria (%)
Place of birth for the foreign-born population - Belgium (%)
Place of birth for the foreign-born population - France (%)
Place of birth for the foreign-born population - Germany (%)
Place of birth for the foreign-born population - Netherlands (%)
Place of birth for the foreign-born population - Switzerland (%)
Place of birth for the foreign-born population - Other Western Europe (%)
Place of birth for the foreign-born population - Greece (%)
Place of birth for the foreign-born population - Italy (%)
Place of birth for the foreign-born population - Portugal (%)
Place of birth for the foreign-born population - Spain (%)
Place of birth for the foreign-born population - Other Southern Europe (%)
Place of birth for the foreign-born population - Albania (%)
Place of birth for the foreign-born population - Belarus (%)
Place of birth for the foreign-born population - Bosnia and Herzegovina (%)
Place of birth for the foreign-born population - Bulgaria (%)
Place of birth for the foreign-born population - Croatia (%)
Place of birth for the foreign-born population - Czechoslovakia (%)
Place of birth for the foreign-born population - Hungary (%)
Place of birth for the foreign-born population - Latvia (%)
Place of birth for the foreign-born population - Lithuania (%)
Place of birth for the foreign-born population - North Macedonia (Macedonia) (%)
Place of birth for the foreign-born population - Moldova (%)
Place of birth for the foreign-born population - Poland (%)
Place of birth for the foreign-born population - Romania (%)
Place of birth for the foreign-born population - Russia (%)
Place of birth for the foreign-born population - Serbia (%)
Place of birth for the foreign-born population - Ukraine (%)
Place of birth for the foreign-born population - Other Eastern Europe (%)
Place of birth for the foreign-born population - China (%)
Place of birth for the foreign-born population - Hong Kong (%)
Place of birth for the foreign-born population - Taiwan (%)
Place of birth for the foreign-born population - Japan (%)
Place of birth for the foreign-born population - Korea (%)
Place of birth for the foreign-born population - Other Eastern Asia (%)
Place of birth for the foreign-born population - Afghanistan (%)
Place of birth for the foreign-born population - Bangladesh (%)
Place of birth for the foreign-born population - India (%)
Place of birth for the foreign-born population - Iran (%)
Place of birth for the foreign-born population - Kazakhstan (%)
Place of birth for the foreign-born population - Nepal (%)
Place of birth for the foreign-born population - Pakistan (%)
Place of birth for the foreign-born population - Sri Lanka (%)
Place of birth for the foreign-born population - Uzbekistan (%)
Place of birth for the foreign-born population - Other South Central Asia (%)
Place of birth for the foreign-born population - Burma (%)
Place of birth for the foreign-born population - Cambodia (%)
Place of birth for the foreign-born population - Indonesia (%)
Place of birth for the foreign-born population - Laos (%)
Place of birth for the foreign-born population - Malaysia (%)
Place of birth for the foreign-born population - Philippines (%)
Place of birth for the foreign-born population - Singapore (%)
Place of birth for the foreign-born population - Thailand (%)
Place of birth for the foreign-born population - Vietnam (%)
Place of birth for the foreign-born population - Other South Eastern Asia (%)
Place of birth for the foreign-born population - Armenia (%)
Place of birth for the foreign-born population - Iraq (%)
Place of birth for the foreign-born population - Israel (%)
Place of birth for the foreign-born population - Jordan (%)
Place of birth for the foreign-born population - Kuwait (%)
Place of birth for the foreign-born population - Lebanon (%)
Place of birth for the foreign-born population - Saudi Arabia (%)
Place of birth for the foreign-born population - Syria (%)
Place of birth for the foreign-born population - Turkey (%)
Place of birth for the foreign-born population - Yemen (%)
Place of birth for the foreign-born population - Other Western Asia (%)
Place of birth for the foreign-born population - Eritrea (%)
Place of birth for the foreign-born population - Ethiopia (%)
Place of birth for the foreign-born population - Kenya (%)
Place of birth for the foreign-born population - Somalia (%)
Place of birth for the foreign-born population - Uganda (%)
Place of birth for the foreign-born population - Zimbabwe (%)
Place of birth for the foreign-born population - Other Eastern Africa (%)
Place of birth for the foreign-born population - Cameroon (%)
Place of birth for the foreign-born population - Congo (%)
Place of birth for the foreign-born population - Democratic Republic of Congo (Zaire) (%)
Place of birth for the foreign-born population - Other Middle Africa (%)
Place of birth for the foreign-born population - Egypt (%)
Place of birth for the foreign-born population - Morocco (%)
Place of birth for the foreign-born population - Sudan (%)
Place of birth for the foreign-born population - Other Northern Africa (%)
Place of birth for the foreign-born population - South Africa (%)
Place of birth for the foreign-born population - Other Southern Africa (%)
Place of birth for the foreign-born population - Cabo Verde (%)
Place of birth for the foreign-born population - Ghana (%)
Place of birth for the foreign-born population - Liberia (%)
Place of birth for the foreign-born population - Nigeria (%)
Place of birth for the foreign-born population - Senegal (%)
Place of birth for the foreign-born population - Sierra Leone (%)
Place of birth for the foreign-born population - Other Western Africa (%)
Place of birth for the foreign-born population - Australia (%)
Place of birth for the foreign-born population - New Zealand (%)
Place of birth for the foreign-born population - Fiji (%)
Place of birth for the foreign-born population - Micronesia (%)
Place of birth for the foreign-born population - Bahamas (%)
Place of birth for the foreign-born population - Barbados (%)
Place of birth for the foreign-born population - Cuba (%)
Place of birth for the foreign-born population - Dominica (%)
Place of birth for the foreign-born population - Dominican Republic (%)
Place of birth for the foreign-born population - Grenada (%)
Place of birth for the foreign-born population - Haiti (%)
Place of birth for the foreign-born population - Jamaica (%)
Place of birth for the foreign-born population - St. Vincent and the Grenadines (%)
Place of birth for the foreign-born population - Trinidad and Tobago (%)
Place of birth for the foreign-born population - West Indies (%)
Place of birth for the foreign-born population - Other Caribbean (%)
Place of birth for the foreign-born population - Belize (%)
Place of birth for the foreign-born population - Costa Rica (%)
Place of birth for the foreign-born population - El Salvador (%)
Place of birth for the foreign-born population - Guatemala (%)
Place of birth for the foreign-born population - Honduras (%)
Place of birth for the foreign-born population - Mexico (%)
Place of birth for the foreign-born population - Nicaragua (%)
Place of birth for the foreign-born population - Panama (%)
Place of birth for the foreign-born population - Other Central America (%)
Place of birth for the foreign-born population - Argentina (%)
Place of birth for the foreign-born population - Bolivia (%)
Place of birth for the foreign-born population - Brazil (%)
Place of birth for the foreign-born population - Chile (%)
Place of birth for the foreign-born population - Colombia (%)
Place of birth for the foreign-born population - Ecuador (%)
Place of birth for the foreign-born population - Guyana (%)
Place of birth for the foreign-born population - Peru (%)
Place of birth for the foreign-born population - Uruguay (%)
Place of birth for the foreign-born population - Venezuela (%)
Place of birth for the foreign-born population - Other South America (%)
Place of birth for the foreign-born population - Canada (%)
Place of birth for the foreign-born population - Other Northern America (%)
Place of birth for the foreign-born population - Other (%)
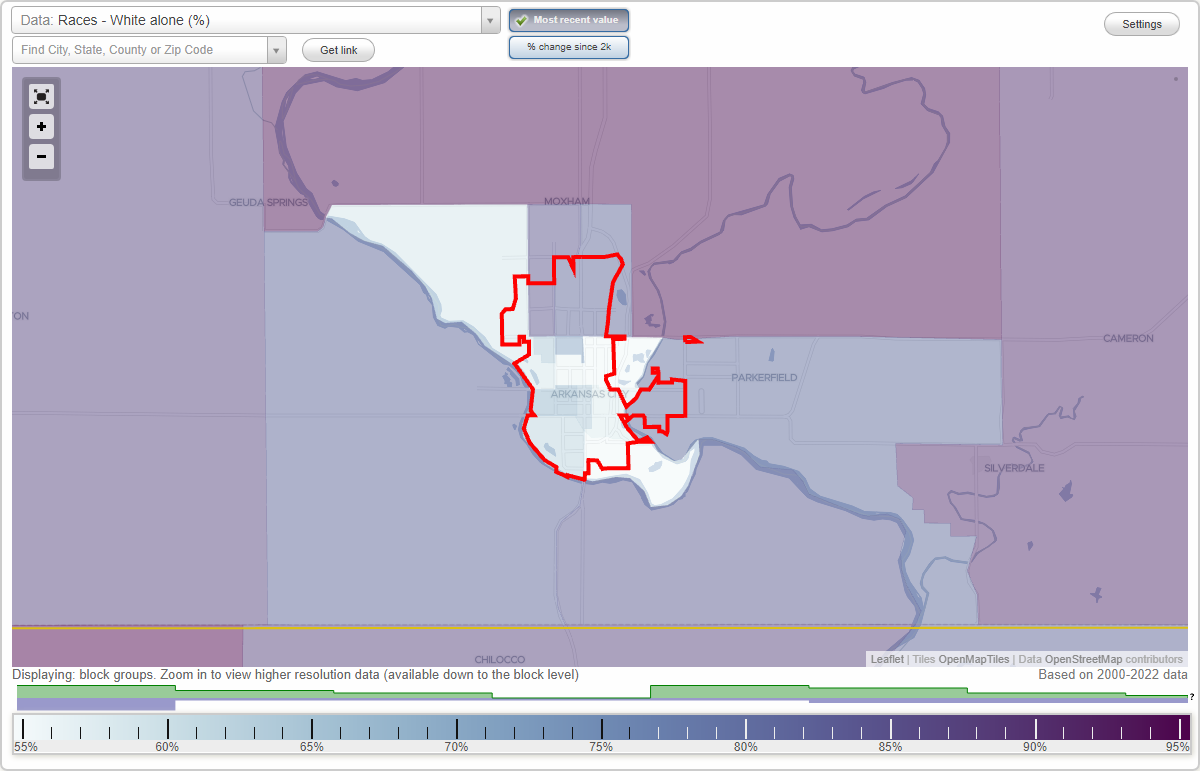
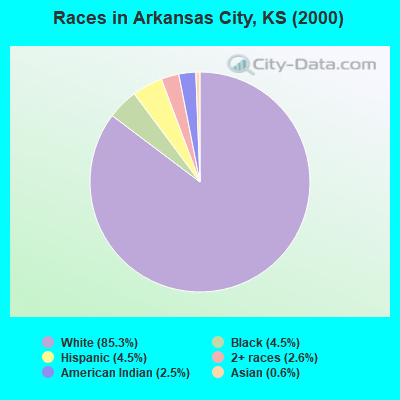
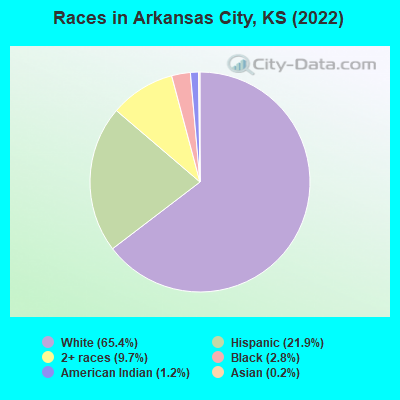
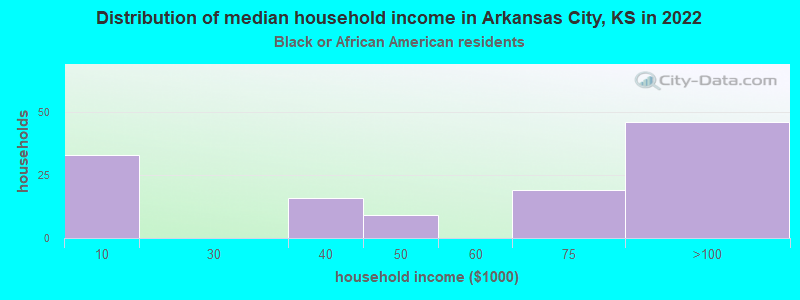
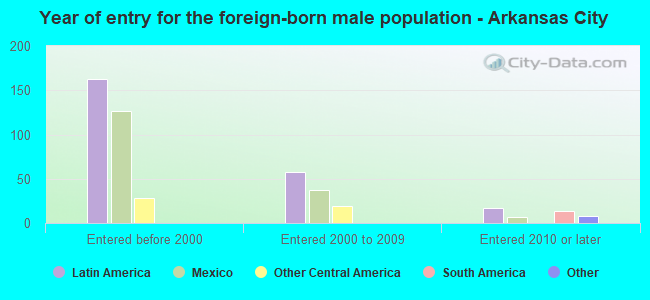
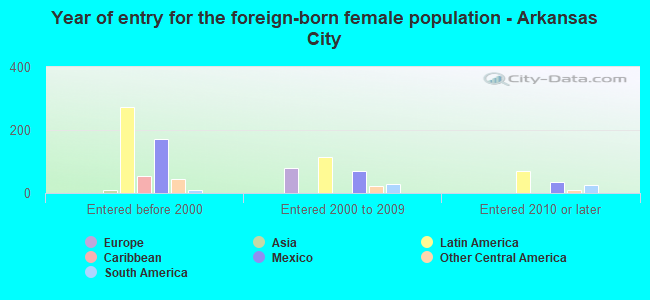
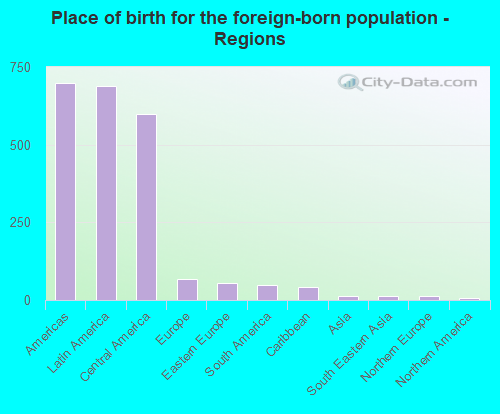
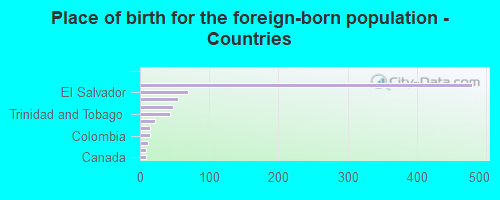
According to 2022 data, the most numerous races in Arkansas City, KS are White alone (7,852 residents), Hispanic (2,631 residents), and Black alone (334 residents). 92.0% of Arkansas City residents speak English at home. 6.5% of Arkansas City, KS residents are foreign-born (5.6% born in Latin America), which is 7.7% less than the foreign-born rate of 7.0% across the entire state of Kansas.
Race distribution in Arkansas City
2000 2022
2,233,997 83.1% White alone 188,252 7.0% Hispanic 151,407 5.6% Black alone 46,301 1.7% Asian alone 42,508 1.6% Two or more races 22,322 0.8% American Indian alone 2,477 0.09% Other race alone 1,154 0.04% Native Hawaiian and Other
2,147,943 73.1% White alone 381,746 13.0% Hispanic 147,666 5.0% Black alone 145,362 4.9% Two or more races 85,085 2.9% Asian alone 13,263 0.5% Other race alone 12,065 0.4% American Indian alone 4,020 0.1% Native Hawaiian and Other
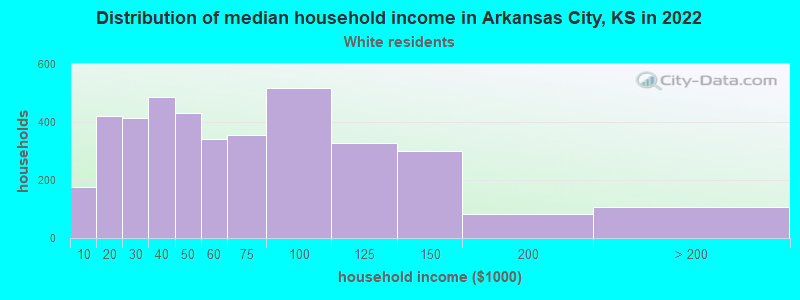
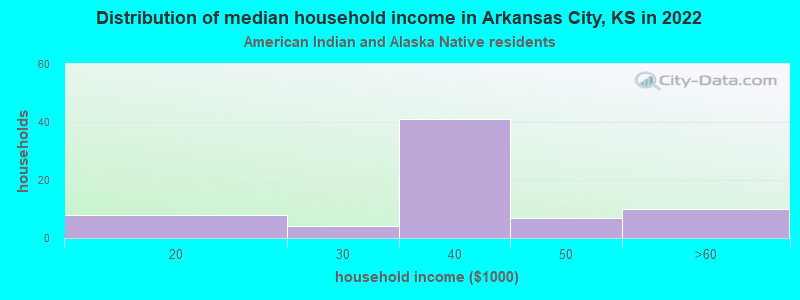
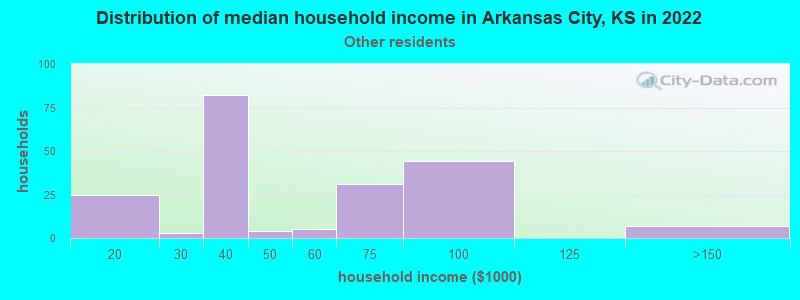
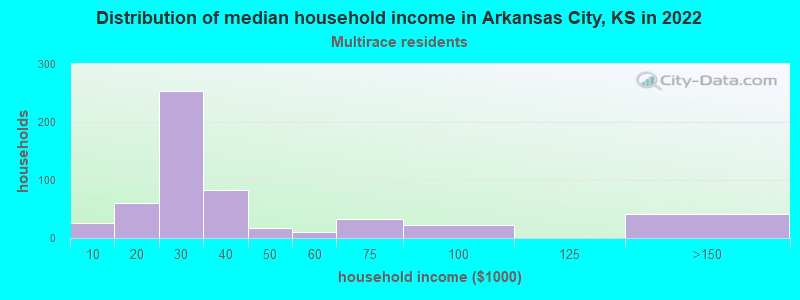
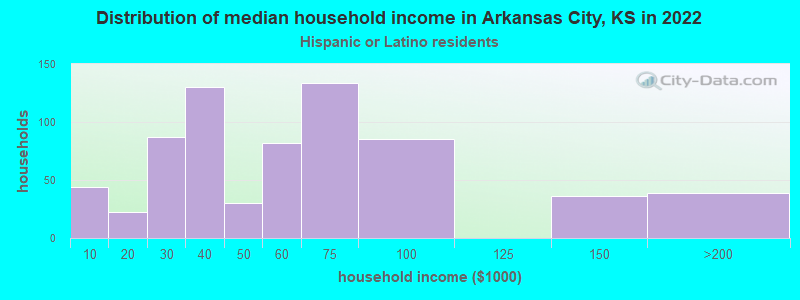
Income and house value in Arkansas City Median household income in 2022 $49,953 White non-Hispanic householders$57,100 Black householders$43,677 American Indian and Alaska Native householders$41,964 Some other race householders$26,038 Two or more races householders$52,931 Hispanic or Latino race householdersMedian 2022 house value $88,655 White Non-Hispanic householders$65,000 Black or African American householders$47,309 American Indian or Alaska Native householders$73,150 Some other race householders$77,524 Two or more races householders$73,150 Hispanic or Latino householders
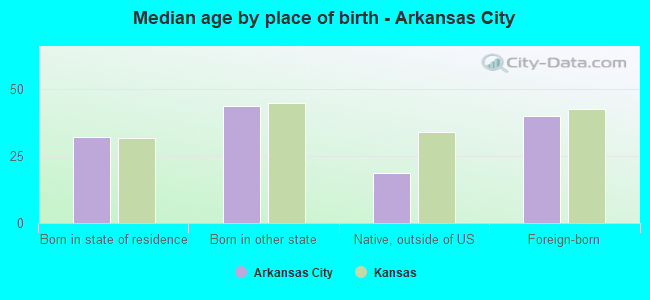
Median age by race in Arkansas City
37.1 Median age for White residents36.4 37.5 41.1 Median age for Black or African American residents41.0 50.0 50.6 Median age for American Indian / Alaska Native residents27.9 57.7 -697,154,470.8 Median age for Asian residents-717,460,316.7 -674,418,604.0 -627,039,626.4 Median age for Native Hawaiian / Pacific Islander residents-669,240,668.6 -641,269,840.6 20.9 Median age for Other race residents38.7 18.1 23.4 Median age for Two or more races residents34.5 18.1 40.5 Median age for White alone residents40.7 40.7 22.3 Median age for Hispanic or Latino residents20.1 27.4
Owner/renter occupied households by race in Arkansas City
House owners and renters - White residents 2,634 67.5% Owner occupied1,270 32.5% Renter occupiedHouse owners and renters - Black or African American residents 71 61.4% Owner occupied45 38.6% Renter occupiedHouse owners and renters - American Indian / Alaska Native residents 47 64.1% Owner occupied27 35.9% Renter occupiedHouse owners and renters - Other race residents 137 71.6% Owner occupied54 28.4% Renter occupiedHouse owners and renters - Two or more races residents 161 28.4% Owner occupied406 71.6% Renter occupiedHouse owners and renters - White alone residents 2,424 67.6% Owner occupied1,162 32.4% Renter occupiedHouse owners and renters - Hispanic or Latino residents 452 64.4% Owner occupied249 35.6% Renter occupied
Language usage in Arkansas City
English speakers - Total 92.0% of residents of Arkansas City speak English at home.
8.2% of residents speak Spanish at home 586 63.5% Speak English very well337 36.5% Speak English less than very well
English speakers - Born in the United States 97.2% of residents of Arkansas City speak English at home.
2.8% of residents speak Spanish at home 66 83.5% Speak English very well13 16.5% Speak English less than very well
All residents speak only English at home
English speakers - Foreign-born 37.9% of residents of Arkansas City speak English at home.
64.4% of residents speak Spanish at home 202 41.0% Speak English very well291 59.0% Speak English less than very well
White (Caucasian) - Speak only English Native:
98.3% (8,141)Foreign-born:
67.9% (145)
White (Caucasian) - Speak another language Native:
1.9% (156)Foreign-born:
46.8% (100)
Other race - Speak only English Native:
46.2% (148)Foreign-born:
46.8% (82)
Other race - Speak another language Native:
53.2% (171)Foreign-born:
66.8% (118)
Two or more races - Speak only English Native:
91.9% (1,435)Foreign-born:
24.0% (100)
Two or more races - Speak another language Native:
4.7% (74)Foreign-born:
73.7% (306)
White alone - Speak only English Native:
100.0% (7,454)Foreign-born:
92.6% (70)
Hispanic or Latino - Speak only English Native:
74.5% (1,219)Foreign-born:
31.9% (207)
Hispanic or Latino - Speak another language Native:
25.8% (423)Foreign-born:
73.4% (477)
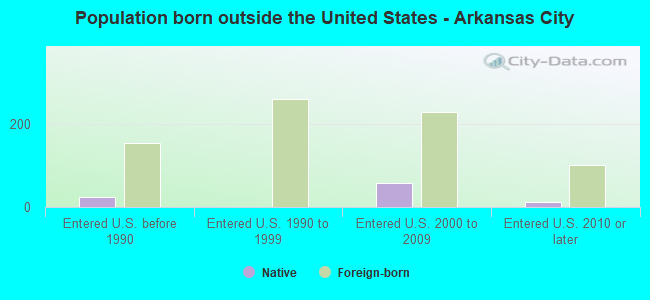
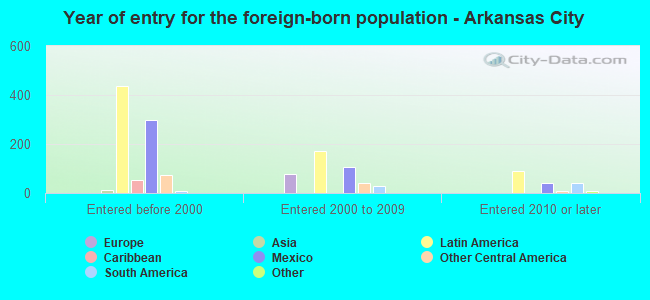
Foreign-born residents in Arkansas City 780 residents are foreign born (5.6% Latin America ).
This city:
6.5%Kansas:
7.1%
Marital status for residents in Arkansas City Marital status - White (Caucasian) population 15 years and over
Males 31.6% Never married42.7% Now married4.1% Separated6.5% Widowed15.1% DivorcedFemales 26.4% Never married38.5% Now married3.4% Separated7.6% Widowed24.1% DivorcedWomen who gave birth in the past 12 months Now married:
45.1% (136)Unmarried:
54.9% (165)
Women who did not give birth in the past 12 months Now married:
38.1% (710)Unmarried:
61.9% (1,152)
Marital status - Black or African American population 15 years and over
Males 44.5% Never married30.5% Now married0.0% Separated0.0% Widowed25.0% DivorcedFemales 47.1% Never married4.5% Now married8.9% Separated31.2% Widowed8.3% DivorcedWomen who did not give birth in the past 12 months Now married:
15.9% (14)Unmarried:
84.1% (75)
Marital status - American Indian / Alaska Native population 15 years and over
Males 46.9% Never married42.9% Now married0.0% Separated0.0% Widowed10.2% DivorcedFemales 23.6% Never married65.0% Now married0.0% Separated0.0% Widowed11.4% DivorcedWomen who gave birth in the past 12 months Now married:
0.0% (0)Unmarried:
100.0% (11)
Women who did not give birth in the past 12 months Now married:
57.8% (29)Unmarried:
42.2% (22)
Marital status - Other race population 15 years and over
Males 8.4% Never married58.0% Now married15.1% Separated0.0% Widowed18.5% DivorcedFemales 49.1% Never married35.2% Now married0.0% Separated4.8% Widowed10.9% DivorcedWomen who gave birth in the past 12 months Now married:
100.0% (13)Unmarried:
0.0% (0)
Women who did not give birth in the past 12 months Now married:
24.6% (39)Unmarried:
75.4% (120)
Marital status - Two or more races population 15 years and over
Males 50.3% Never married33.4% Now married5.4% Separated1.2% Widowed9.6% DivorcedFemales 33.9% Never married30.0% Now married11.9% Separated6.1% Widowed18.1% DivorcedWomen who did not give birth in the past 12 months Now married:
33.0% (122)Unmarried:
67.0% (247)
Marital status - White alone, not Hispanic / Latino population 15 years and over
Males 29.3% Never married45.1% Now married4.0% Separated6.6% Widowed15.0% DivorcedFemales 23.5% Never married39.4% Now married3.6% Separated8.6% Widowed25.0% DivorcedWomen who gave birth in the past 12 months Now married:
61.4% (125)Unmarried:
38.6% (79)
Women who did not give birth in the past 12 months Now married:
39.1% (637)Unmarried:
60.9% (993)
Marital status - Hispanic or Latino population 15 years and over
Males 49.8% Never married29.7% Now married5.2% Separated3.2% Widowed12.1% DivorcedFemales 46.6% Never married31.9% Now married1.0% Separated1.7% Widowed18.7% DivorcedWomen who gave birth in the past 12 months Now married:
21.7% (27)Unmarried:
78.3% (99)
Women who did not give birth in the past 12 months Now married:
24.3% (155)Unmarried:
75.7% (482)
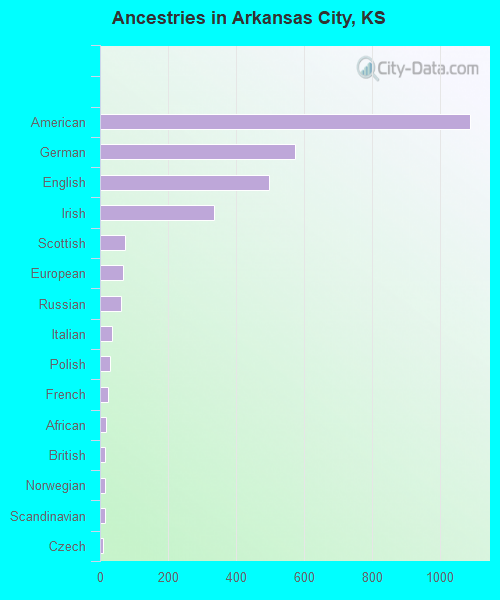
Ancestries in Arkansas City
1,091 21.6% American575 11.4% German498 9.8% English335 6.6% Irish74 1.5% Scottish68 1.3% European62 1.2% Russian36 0.7% Italian29 0.6% Polish23 0.5% French17 0.3% African15 0.3% British15 0.3% Norwegian15 0.3% Scandinavian10 0.2% Czech9 0.2% Canadian8 0.2% Pennsylvania German7 0.1% Czechoslovakian7 0.1% Danish3 0.06% Welsh2 0.04% Brazilian2 0.04% Dutch1 0.02% French Canadian
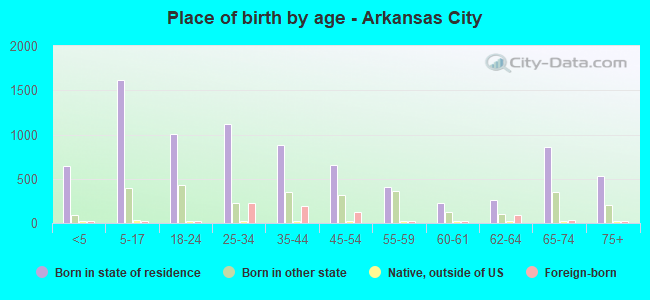
Children Nativity (place of birth) in Arkansas City
Children under 6 years - Living with two parents Both parents native 407 100.0% NativeOne native, one foreign-born parent 42 100.0% NativeChildren under 6 years - Living with one parent Native parent 184 100.0% NativeForeign-born parent 187 100.0% NativeChildren 6 to 17 years - Living with two parents Both parents native 768 100.0% NativeBoth parents foreign-born 43 100.0% NativeOne native, one foreign-born parent 60 100.0% NativeChildren 6 to 17 years - Living with one parent Native parent 622 100.0% NativeForeign-born parent 320 51.5% Native301 48.5% Foreign-born
Grandparents responsible for own grandchildren in Arkansas City
Grandparents (30 to 59 years) White / Caucasian 32 44.6% Responsible for grandchildren40 55.4% Not responsible for grandchildrenWhite alone, not Hispanic / Latino 26 38.2% Responsible for grandchildren43 61.8% Not responsible for grandchildrenHispanic or Latino 5 100.0% Responsible for grandchildrenGrandparents (60 years and over) White / Caucasian 40 44.6% Responsible for grandchildren50 55.4% Not responsible for grandchildrenWhite alone, not Hispanic / Latino 41 56.8% Responsible for grandchildren31 43.2% Not responsible for grandchildrenHispanic or Latino 5 16.5% Responsible for grandchildren24 83.5% Not responsible for grandchildren