Races in Ashtabula, Ohio (OH) Detailed Stats
Data:
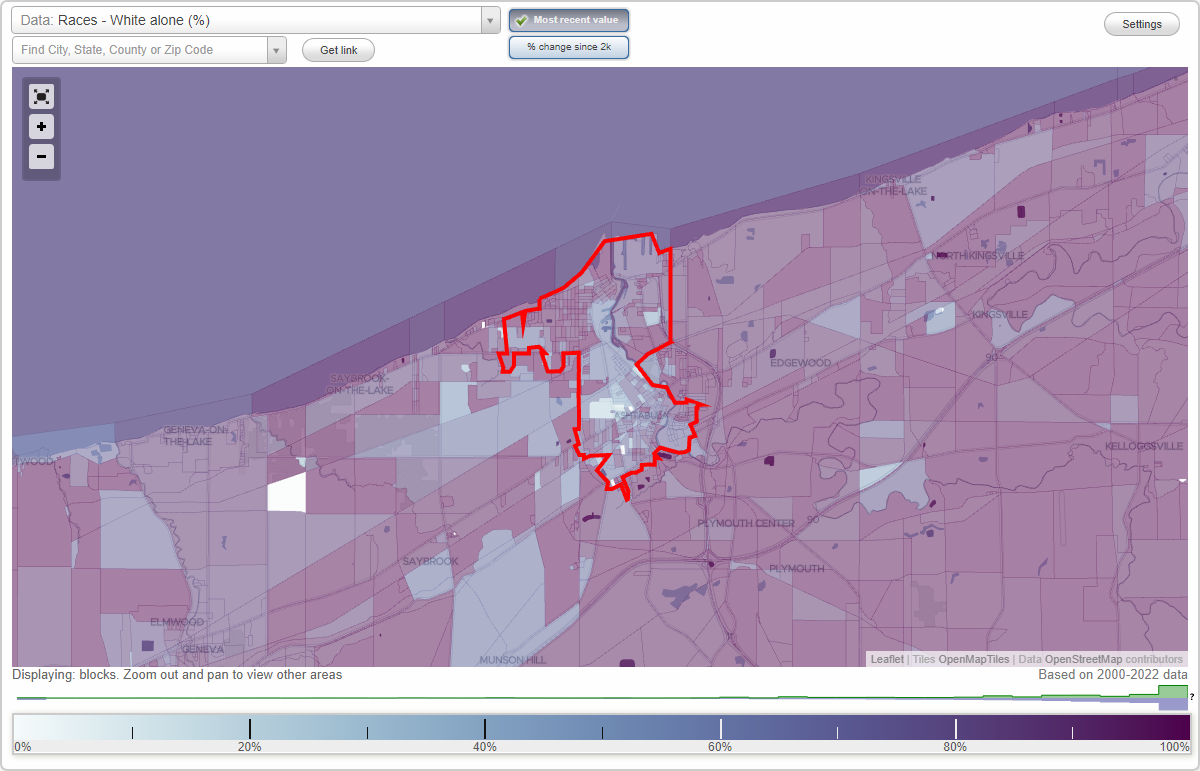
Races - White alone (%)
Races - White alone (% change since 2000)
Races - Black alone (%)
Races - Black alone (% change since 2000)
Races - American Indian alone (%)
Races - American Indian alone (% change since 2000)
Races - Asian alone (%)
Races - Asian alone (% change since 2000)
Races - Hispanic (%)
Races - Hispanic (% change since 2000)
Races - Native Hawaiian and Other Pacific Islander alone (%)
Races - Native Hawaiian and Other Pacific Islander alone (% change since 2000)
Races - Two or more races(%)
Races - Two or more races(% change since 2000)
Races - Other race alone (%)
Races - Other race alone (% change since 2000)
Racial diversity
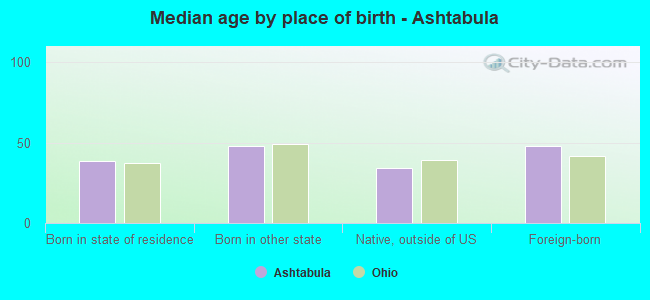
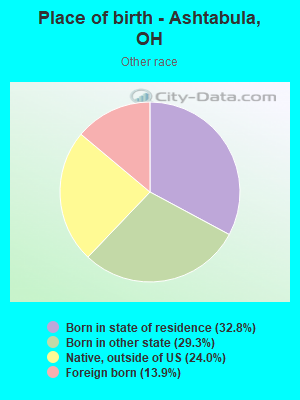
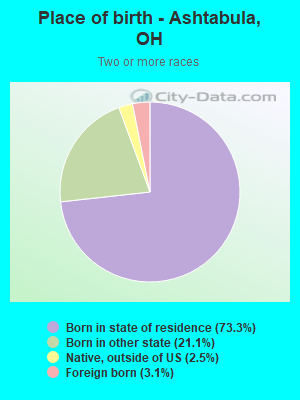
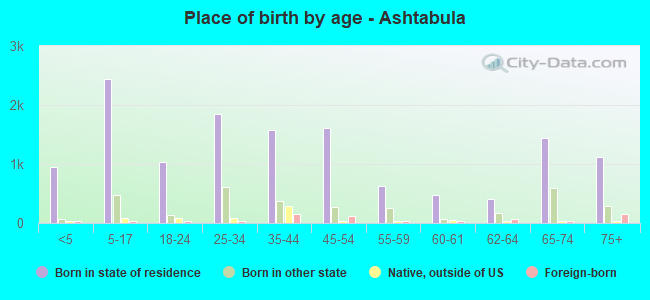
Place of birth - Born in state of residence (%)
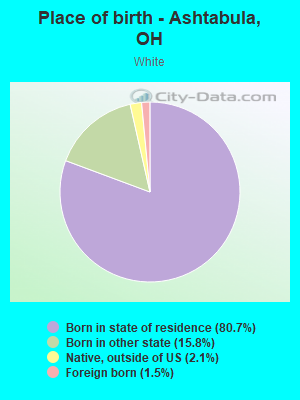
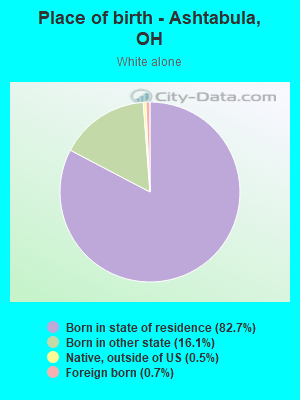
Place of birth - Born in state of residence (%) - White
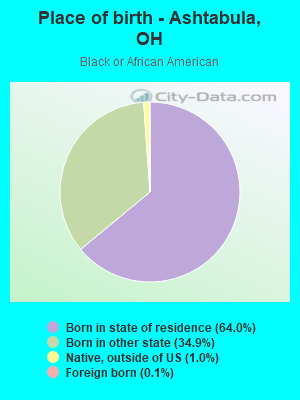
Place of birth - Born in state of residence (%) - Black or African American
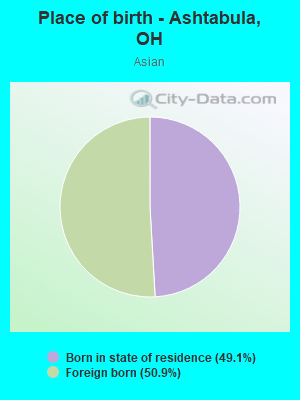
Place of birth - Born in state of residence (%) - Asian
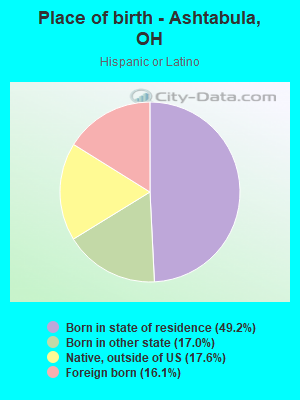
Place of birth - Born in state of residence (%) - Hispanic or Latino
Place of birth - Born in state of residence (%) - American Indian and Alaska Native
Place of birth - Born in state of residence (%) - Multirace
Place of birth - Born in state of residence (%) - Other Race
Place of birth - Born in other state (%)
Place of birth - Born in other state (%) - White
Place of birth - Born in other state (%) - Black or African American
Place of birth - Born in other state (%) - Asian
Place of birth - Born in other state (%) - Hispanic or Latino
Place of birth - Born in other state (%) - American Indian and Alaska Native
Place of birth - Born in other state (%) - Multirace
Place of birth - Born in other state (%) - Other Race
Place of birth - Native, outside of US (%)
Place of birth - Native, outside of US (%) - White
Place of birth - Native, outside of US (%) - Black or African American
Place of birth - Native, outside of US (%) - Asian
Place of birth - Native, outside of US (%) - Hispanic or Latino
Place of birth - Native, outside of US (%) - American Indian and Alaska Native
Place of birth - Native, outside of US (%) - Multirace
Place of birth - Native, outside of US (%) - Other Race
Place of birth - Foreign born (%)
Place of birth - Foreign born (%) - White
Place of birth - Foreign born (%) - Black or African American
Place of birth - Foreign born (%) - Asian
Place of birth - Foreign born (%) - Hispanic or Latino
Place of birth - Foreign born (%) - American Indian and Alaska Native
Place of birth - Foreign born (%) - Multirace
Place of birth - Foreign born (%) - Other Race
Residents speaking English at home (%)
Residents speaking English at home - Born in the United States (%)
Residents speaking English at home - Native, born elsewhere (%)
Residents speaking English at home - Foreign born (%)
Residents speaking Spanish at home (%)
Residents speaking Spanish at home - Born in the United States (%)
Residents speaking Spanish at home - Native, born elsewhere (%)
Residents speaking Spanish at home - Foreign born (%)
Residents speaking other language at home (%)
Residents speaking other language at home - Born in the United States (%)
Residents speaking other language at home - Native, born elsewhere (%)
Residents speaking other language at home - Foreign born (%)
Marital status - Never married (%)
Marital status - Now married (%)
Marital status - Separated (%)
Marital status - Widowed (%)
Marital status - Divorced (%)
Ancestries Reported - Arab (%)
Ancestries Reported - Czech (%)
Ancestries Reported - Danish (%)
Ancestries Reported - Dutch (%)
Ancestries Reported - English (%)
Ancestries Reported - French (%)
Ancestries Reported - French Canadian (%)
Ancestries Reported - German (%)
Ancestries Reported - Greek (%)
Ancestries Reported - Hungarian (%)
Ancestries Reported - Irish (%)
Ancestries Reported - Italian (%)
Ancestries Reported - Lithuanian (%)
Ancestries Reported - Norwegian (%)
Ancestries Reported - Polish (%)
Ancestries Reported - Portuguese (%)
Ancestries Reported - Russian (%)
Ancestries Reported - Scotch-Irish (%)
Ancestries Reported - Scottish (%)
Ancestries Reported - Slovak (%)
Ancestries Reported - Subsaharan African (%)
Ancestries Reported - Swedish (%)
Ancestries Reported - Swiss (%)
Ancestries Reported - Ukrainian (%)
Ancestries Reported - United States (%)
Ancestries Reported - Welsh (%)
Ancestries Reported - West Indian (%)
Ancestries Reported - Other (%)
Geographical mobility - Same house 1 year ago (%)
Geographical mobility - Same house 1 year ago (%) - White
Geographical mobility - Same house 1 year ago (%) - Black or African American
Geographical mobility - Same house 1 year ago (%) - Asian
Geographical mobility - Same house 1 year ago (%) - Hispanic or Latino
Geographical mobility - Same house 1 year ago (%) - American Indian and Alaska Native
Geographical mobility - Same house 1 year ago (%) - Multirace
Geographical mobility - Same house 1 year ago (%) - Other Race
Geographical mobility - Moved within same county (%)
Geographical mobility - Moved within same county (%) - White
Geographical mobility - Moved within same county (%) - Black or African American
Geographical mobility - Moved within same county (%) - Asian
Geographical mobility - Moved within same county (%) - Hispanic or Latino
Geographical mobility - Moved within same county (%) - American Indian and Alaska Native
Geographical mobility - Moved within same county (%) - Multirace
Geographical mobility - Moved within same county (%) - Other Race
Geographical mobility - Moved from different county within same state (%)
Geographical mobility - Moved from different county within same state (%) - White
Geographical mobility - Moved from different county within same state (%) - Black or African American
Geographical mobility - Moved from different county within same state (%) - Asian
Geographical mobility - Moved from different county within same state (%) - Hispanic or Latino
Geographical mobility - Moved from different county within same state (%) - American Indian and Alaska Native
Geographical mobility - Moved from different county within same state (%) - Multirace
Geographical mobility - Moved from different county within same state (%) - Other Race
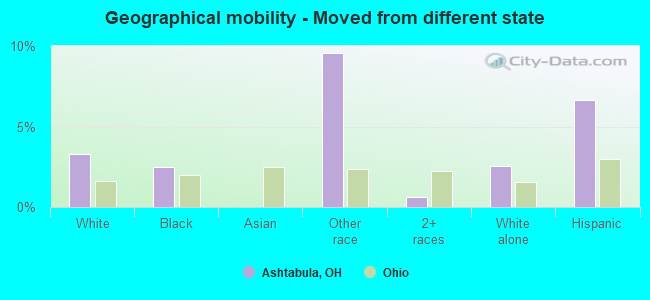
Geographical mobility - Moved from different state (%)
Geographical mobility - Moved from different state (%) - White
Geographical mobility - Moved from different state (%) - Black or African American
Geographical mobility - Moved from different state (%) - Asian
Geographical mobility - Moved from different state (%) - Hispanic or Latino
Geographical mobility - Moved from different state (%) - American Indian and Alaska Native
Geographical mobility - Moved from different state (%) - Multirace
Geographical mobility - Moved from different state (%) - Other Race
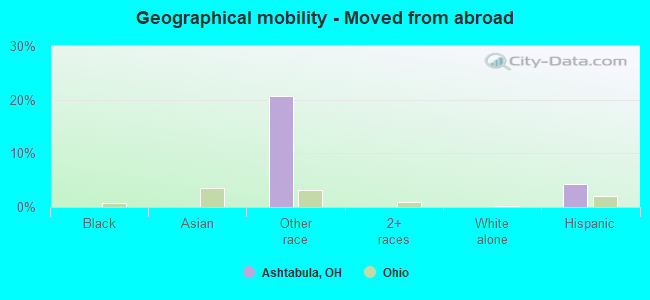
Geographical mobility - Moved from abroad (%)
Geographical mobility - Moved from abroad (%) - White
Geographical mobility - Moved from abroad (%) - Black or African American
Geographical mobility - Moved from abroad (%) - Asian
Geographical mobility - Moved from abroad (%) - Hispanic or Latino
Geographical mobility - Moved from abroad (%) - American Indian and Alaska Native
Geographical mobility - Moved from abroad (%) - Multirace
Geographical mobility - Moved from abroad (%) - Other Race
Place of birth for the foreign-born population - Ireland (%)
Place of birth for the foreign-born population - Denmark (%)
Place of birth for the foreign-born population - Norway (%)
Place of birth for the foreign-born population - Sweden (%)
Place of birth for the foreign-born population - United Kingdom (%)
Place of birth for the foreign-born population - England (%)
Place of birth for the foreign-born population - Scotland (%)
Place of birth for the foreign-born population - Other Northern Europe (%)
Place of birth for the foreign-born population - Austria (%)
Place of birth for the foreign-born population - Belgium (%)
Place of birth for the foreign-born population - France (%)
Place of birth for the foreign-born population - Germany (%)
Place of birth for the foreign-born population - Netherlands (%)
Place of birth for the foreign-born population - Switzerland (%)
Place of birth for the foreign-born population - Other Western Europe (%)
Place of birth for the foreign-born population - Greece (%)
Place of birth for the foreign-born population - Italy (%)
Place of birth for the foreign-born population - Portugal (%)
Place of birth for the foreign-born population - Spain (%)
Place of birth for the foreign-born population - Other Southern Europe (%)
Place of birth for the foreign-born population - Albania (%)
Place of birth for the foreign-born population - Belarus (%)
Place of birth for the foreign-born population - Bosnia and Herzegovina (%)
Place of birth for the foreign-born population - Bulgaria (%)
Place of birth for the foreign-born population - Croatia (%)
Place of birth for the foreign-born population - Czechoslovakia (%)
Place of birth for the foreign-born population - Hungary (%)
Place of birth for the foreign-born population - Latvia (%)
Place of birth for the foreign-born population - Lithuania (%)
Place of birth for the foreign-born population - North Macedonia (Macedonia) (%)
Place of birth for the foreign-born population - Moldova (%)
Place of birth for the foreign-born population - Poland (%)
Place of birth for the foreign-born population - Romania (%)
Place of birth for the foreign-born population - Russia (%)
Place of birth for the foreign-born population - Serbia (%)
Place of birth for the foreign-born population - Ukraine (%)
Place of birth for the foreign-born population - Other Eastern Europe (%)
Place of birth for the foreign-born population - China (%)
Place of birth for the foreign-born population - Hong Kong (%)
Place of birth for the foreign-born population - Taiwan (%)
Place of birth for the foreign-born population - Japan (%)
Place of birth for the foreign-born population - Korea (%)
Place of birth for the foreign-born population - Other Eastern Asia (%)
Place of birth for the foreign-born population - Afghanistan (%)
Place of birth for the foreign-born population - Bangladesh (%)
Place of birth for the foreign-born population - India (%)
Place of birth for the foreign-born population - Iran (%)
Place of birth for the foreign-born population - Kazakhstan (%)
Place of birth for the foreign-born population - Nepal (%)
Place of birth for the foreign-born population - Pakistan (%)
Place of birth for the foreign-born population - Sri Lanka (%)
Place of birth for the foreign-born population - Uzbekistan (%)
Place of birth for the foreign-born population - Other South Central Asia (%)
Place of birth for the foreign-born population - Burma (%)
Place of birth for the foreign-born population - Cambodia (%)
Place of birth for the foreign-born population - Indonesia (%)
Place of birth for the foreign-born population - Laos (%)
Place of birth for the foreign-born population - Malaysia (%)
Place of birth for the foreign-born population - Philippines (%)
Place of birth for the foreign-born population - Singapore (%)
Place of birth for the foreign-born population - Thailand (%)
Place of birth for the foreign-born population - Vietnam (%)
Place of birth for the foreign-born population - Other South Eastern Asia (%)
Place of birth for the foreign-born population - Armenia (%)
Place of birth for the foreign-born population - Iraq (%)
Place of birth for the foreign-born population - Israel (%)
Place of birth for the foreign-born population - Jordan (%)
Place of birth for the foreign-born population - Kuwait (%)
Place of birth for the foreign-born population - Lebanon (%)
Place of birth for the foreign-born population - Saudi Arabia (%)
Place of birth for the foreign-born population - Syria (%)
Place of birth for the foreign-born population - Turkey (%)
Place of birth for the foreign-born population - Yemen (%)
Place of birth for the foreign-born population - Other Western Asia (%)
Place of birth for the foreign-born population - Eritrea (%)
Place of birth for the foreign-born population - Ethiopia (%)
Place of birth for the foreign-born population - Kenya (%)
Place of birth for the foreign-born population - Somalia (%)
Place of birth for the foreign-born population - Uganda (%)
Place of birth for the foreign-born population - Zimbabwe (%)
Place of birth for the foreign-born population - Other Eastern Africa (%)
Place of birth for the foreign-born population - Cameroon (%)
Place of birth for the foreign-born population - Congo (%)
Place of birth for the foreign-born population - Democratic Republic of Congo (Zaire) (%)
Place of birth for the foreign-born population - Other Middle Africa (%)
Place of birth for the foreign-born population - Egypt (%)
Place of birth for the foreign-born population - Morocco (%)
Place of birth for the foreign-born population - Sudan (%)
Place of birth for the foreign-born population - Other Northern Africa (%)
Place of birth for the foreign-born population - South Africa (%)
Place of birth for the foreign-born population - Other Southern Africa (%)
Place of birth for the foreign-born population - Cabo Verde (%)
Place of birth for the foreign-born population - Ghana (%)
Place of birth for the foreign-born population - Liberia (%)
Place of birth for the foreign-born population - Nigeria (%)
Place of birth for the foreign-born population - Senegal (%)
Place of birth for the foreign-born population - Sierra Leone (%)
Place of birth for the foreign-born population - Other Western Africa (%)
Place of birth for the foreign-born population - Australia (%)
Place of birth for the foreign-born population - New Zealand (%)
Place of birth for the foreign-born population - Fiji (%)
Place of birth for the foreign-born population - Micronesia (%)
Place of birth for the foreign-born population - Bahamas (%)
Place of birth for the foreign-born population - Barbados (%)
Place of birth for the foreign-born population - Cuba (%)
Place of birth for the foreign-born population - Dominica (%)
Place of birth for the foreign-born population - Dominican Republic (%)
Place of birth for the foreign-born population - Grenada (%)
Place of birth for the foreign-born population - Haiti (%)
Place of birth for the foreign-born population - Jamaica (%)
Place of birth for the foreign-born population - St. Vincent and the Grenadines (%)
Place of birth for the foreign-born population - Trinidad and Tobago (%)
Place of birth for the foreign-born population - West Indies (%)
Place of birth for the foreign-born population - Other Caribbean (%)
Place of birth for the foreign-born population - Belize (%)
Place of birth for the foreign-born population - Costa Rica (%)
Place of birth for the foreign-born population - El Salvador (%)
Place of birth for the foreign-born population - Guatemala (%)
Place of birth for the foreign-born population - Honduras (%)
Place of birth for the foreign-born population - Mexico (%)
Place of birth for the foreign-born population - Nicaragua (%)
Place of birth for the foreign-born population - Panama (%)
Place of birth for the foreign-born population - Other Central America (%)
Place of birth for the foreign-born population - Argentina (%)
Place of birth for the foreign-born population - Bolivia (%)
Place of birth for the foreign-born population - Brazil (%)
Place of birth for the foreign-born population - Chile (%)
Place of birth for the foreign-born population - Colombia (%)
Place of birth for the foreign-born population - Ecuador (%)
Place of birth for the foreign-born population - Guyana (%)
Place of birth for the foreign-born population - Peru (%)
Place of birth for the foreign-born population - Uruguay (%)
Place of birth for the foreign-born population - Venezuela (%)
Place of birth for the foreign-born population - Other South America (%)
Place of birth for the foreign-born population - Canada (%)
Place of birth for the foreign-born population - Other Northern America (%)
Place of birth for the foreign-born population - Other (%)
Latest news about races in Ashtabula, OH collected exclusively by city-data.com from local newspapers, TV, and radio stations
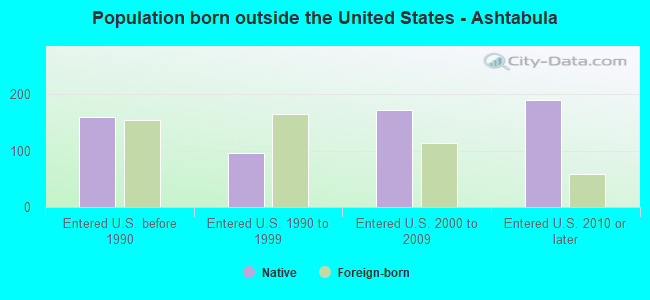
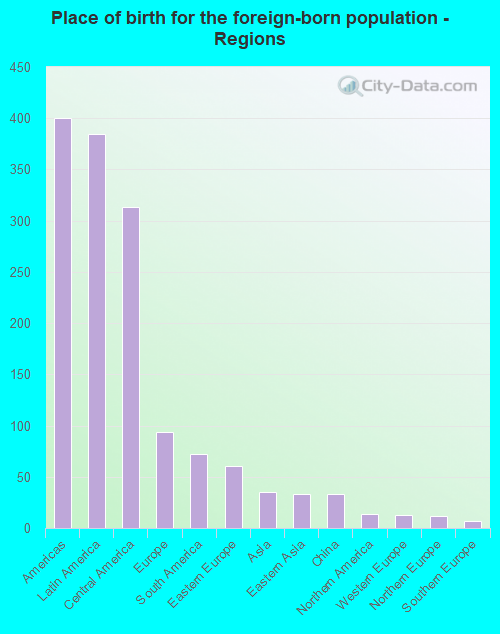
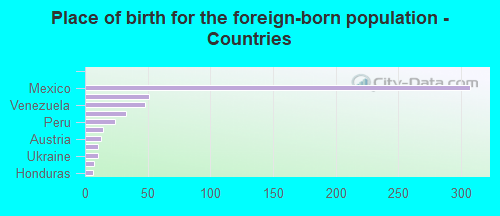
According to 2022 data, the most numerous races in Ashtabula, OH are White alone (12,805 residents), Black alone (1,022 residents), and Two or more races (1,472 residents). 91.3% of Ashtabula residents speak English at home. 3.0% of Ashtabula, OH residents are foreign-born (2.1% born in Latin America, 0.5% born in Europe), which is 34.7% less than the foreign-born rate of 4.0% across the entire state of Ohio.
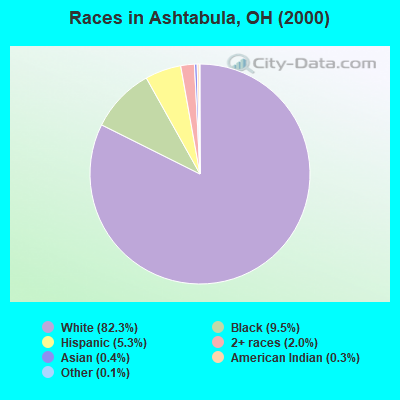
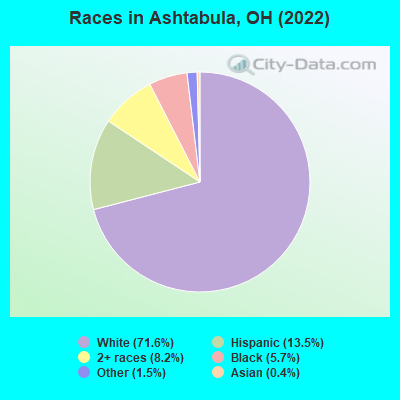
Race distribution in Ashtabula
2000 2022
9,538,111 84.0% White alone 1,290,662 11.4% Black alone 217,123 1.9% Hispanic 137,770 1.2% Two or more races 131,670 1.2% Asian alone 21,985 0.2% American Indian alone 13,483 0.1% Other race alone 2,336 0.02% Native Hawaiian and Other
8,948,793 76.1% White alone 1,401,403 11.9% Black alone 529,291 4.5% Two or more races 517,232 4.4% Hispanic 293,387 2.5% Asian alone 52,805 0.4% Other race alone 9,785 0.08% American Indian alone 3,362 0.03% Native Hawaiian and Other
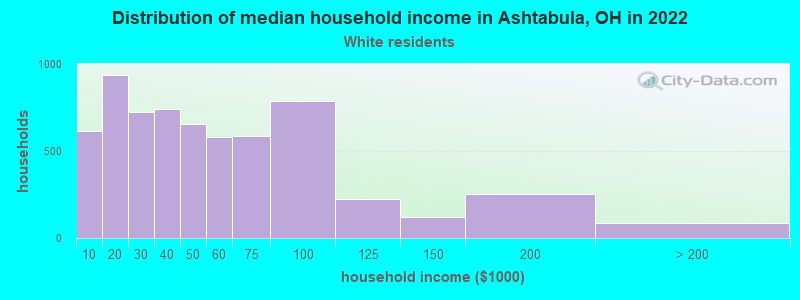
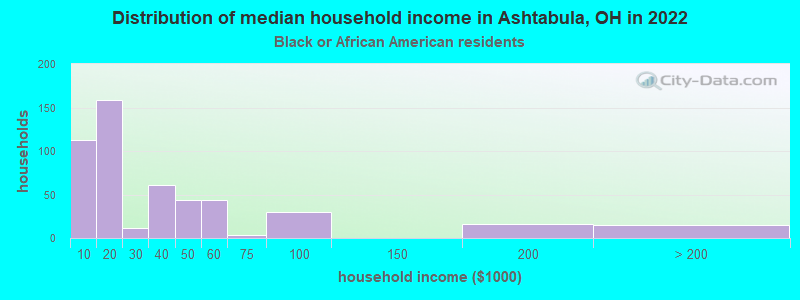
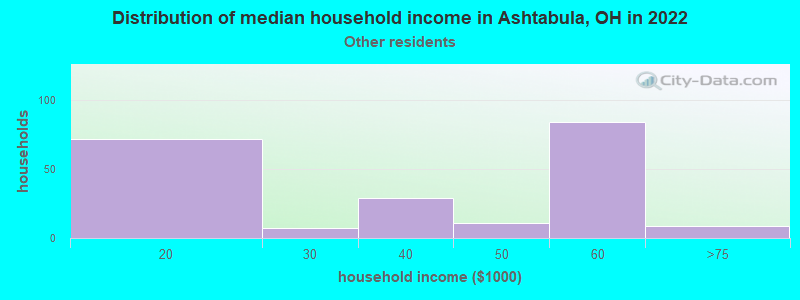
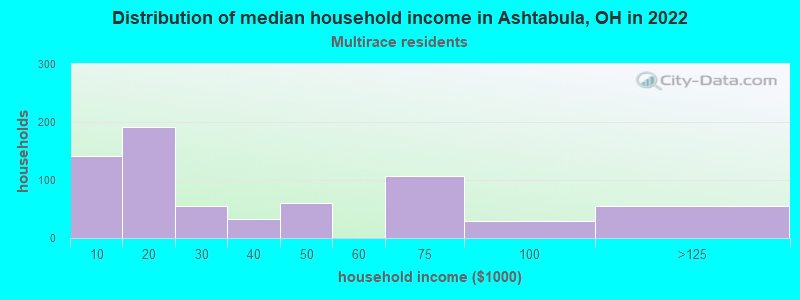
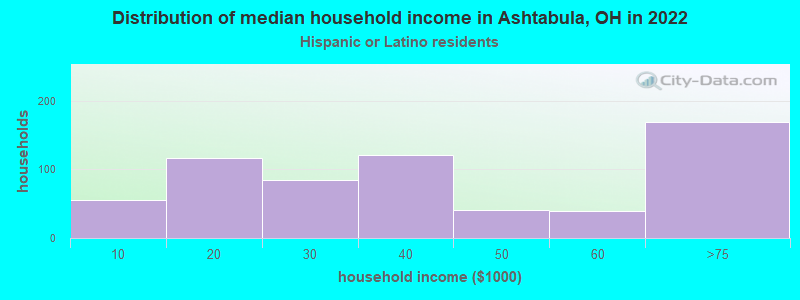
Income and house value in Ashtabula Median household income in 2022 $40,030 White non-Hispanic householders$39,895 Some other race householders$25,316 Hispanic or Latino race householdersMedian 2022 house value $103,226 White Non-Hispanic householders$69,941 Black or African American householders$201,613 American Indian or Alaska Native householders $155,132 Asian householders$76,979 Some other race householders$150,880 Two or more races householders$90,029 Hispanic or Latino householders
Median age by race in Ashtabula
41.9 Median age for White residents41.5 44.4 50.9 Median age for Black or African American residents45.0 57.5 -795,118,817.4 Median age for American Indian / Alaska Native residents-685,185,184.5 -658,163,264.6 32.1 Median age for Asian residents39.6 -674,285,713.6 -666,666,666.0 Median age for Native Hawaiian / Pacific Islander residents-666,666,666.0 -666,666,666.0 40.9 Median age for Other race residents23.8 43.5 15.6 Median age for Two or more races residents12.5 19.9 44.7 Median age for White alone residents42.8 46.5 21.4 Median age for Hispanic or Latino residents21.0 25.2
Owner/renter occupied households by race in Ashtabula
House owners and renters - White residents 3,557 55.4% Owner occupied2,868 44.6% Renter occupiedHouse owners and renters - Black or African American residents 217 51.3% Owner occupied206 48.7% Renter occupiedHouse owners and renters - Asian residents 14 100.0% Owner occupiedHouse owners and renters - Other race residents 108 46.8% Owner occupied123 53.2% Renter occupiedHouse owners and renters - Two or more races residents 284 43.6% Owner occupied367 56.4% Renter occupiedHouse owners and renters - White alone residents 3,412 55.5% Owner occupied2,741 44.5% Renter occupiedHouse owners and renters - Hispanic or Latino residents 400 66.3% Owner occupied203 33.7% Renter occupied
Language usage in Ashtabula
English speakers - Total 91.3% of residents of Ashtabula speak English at home.
7.6% of residents speak Spanish at home 626 48.8% Speak English very well658 51.2% Speak English less than very well1.2% of residents speak other language at home 96 47.8% Speak English very well105 52.2% Speak English less than very well
English speakers - Born in the United States 98.2% of residents of Ashtabula speak English at home.
1.3% of residents speak Spanish at home 40 100.0% Speak English very well0.4% of residents speak other language at home 11 100.0% Speak English very well
English speakers - Native, born elsewhere 20.9% of residents of Ashtabula speak English at home.
79.7% of residents speak Spanish at home 112 22.4% Speak English very well388 77.6% Speak English less than very well
English speakers - Foreign-born 6.6% of residents of Ashtabula speak English at home.
75.3% of residents speak Spanish at home 160 40.0% Speak English very well240 60.0% Speak English less than very well20.2% of residents speak other language at home 43 40.2% Speak English very well64 59.8% Speak English less than very well
White (Caucasian) - Speak only English Native:
95.5% (12,433)Foreign-born:
18.6% (39)
White (Caucasian) - Speak another language Native:
4.3% (564)Foreign-born:
100.0% (208)
Asian - Speak another language Native:
96.5% (32)Foreign-born:
100.0% (36)
Other race - Speak another language Native:
49.0% (280)Foreign-born:
100.0% (98)
Two or more races - Speak another language Native:
15.9% (263)Foreign-born:
100.0% (101)
White alone - Speak only English Native:
97.9% (11,853)Foreign-born:
47.1% (44)
White alone - Speak another language Native:
1.5% (179)Foreign-born:
38.4% (36)
Hispanic or Latino - Speak another language Native:
48.8% (802)Foreign-born:
100.0% (401)
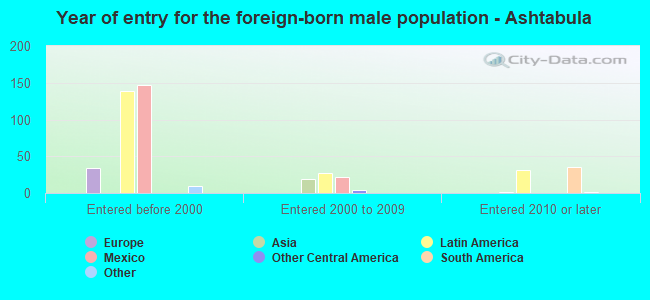
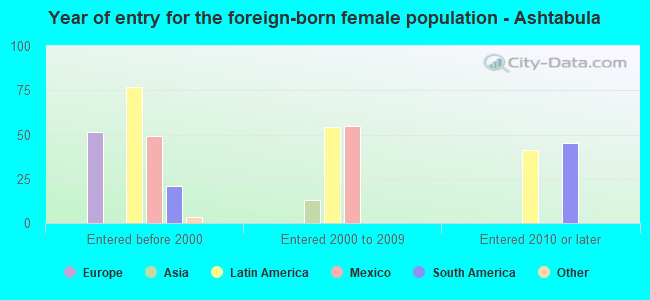
Foreign-born residents in Ashtabula 531 residents are foreign born (2.1% Latin America , 0.5% Europe ).
Marital status for residents in Ashtabula Marital status - White (Caucasian) population 15 years and over
Males 35.5% Never married40.1% Now married2.5% Separated4.4% Widowed17.5% DivorcedFemales 32.8% Never married32.6% Now married4.1% Separated11.6% Widowed18.9% DivorcedWomen who gave birth in the past 12 months Now married:
41.0% (48)Unmarried:
59.0% (69)
Women who did not give birth in the past 12 months Now married:
37.9% (1,170)Unmarried:
62.1% (1,913)
Marital status - Black or African American population 15 years and over
Males 34.1% Never married36.5% Now married6.1% Separated7.7% Widowed15.6% DivorcedFemales 52.9% Never married27.9% Now married0.0% Separated9.5% Widowed9.7% DivorcedWomen who gave birth in the past 12 months Now married:
0.0% (0)Unmarried:
100.0% (34)
Women who did not give birth in the past 12 months Now married:
49.0% (49)Unmarried:
51.0% (51)
Marital status - Asian population 15 years and over
Males 9.1% Never married90.9% Now married0.0% Separated0.0% Widowed0.0% DivorcedFemales 0.0% Never married100.0% Now married0.0% Separated0.0% Widowed0.0% DivorcedWomen who did not give birth in the past 12 months Now married:
100.0% (13)Unmarried:
0.0% (0)
Marital status - Other race population 15 years and over
Males 64.3% Never married35.7% Now married0.0% Separated0.0% Widowed0.0% DivorcedFemales 22.7% Never married41.9% Now married32.3% Separated3.1% Widowed0.0% DivorcedWomen who gave birth in the past 12 months Now married:
0.0% (0)Unmarried:
100.0% (9)
Women who did not give birth in the past 12 months Now married:
68.9% (152)Unmarried:
31.1% (69)
Marital status - Two or more races population 15 years and over
Males 64.2% Never married15.1% Now married9.3% Separated8.1% Widowed3.2% DivorcedFemales 43.6% Never married29.8% Now married0.0% Separated0.0% Widowed26.6% DivorcedWomen who gave birth in the past 12 months Now married:
0.0% (0)Unmarried:
100.0% (15)
Women who did not give birth in the past 12 months Now married:
29.3% (114)Unmarried:
70.7% (274)
Marital status - White alone, not Hispanic / Latino population 15 years and over
Males 34.2% Never married41.1% Now married2.8% Separated4.8% Widowed17.1% DivorcedFemales 31.9% Never married32.2% Now married3.5% Separated12.4% Widowed20.1% DivorcedWomen who gave birth in the past 12 months Now married:
25.0% (23)Unmarried:
75.0% (69)
Women who did not give birth in the past 12 months Now married:
36.4% (1,006)Unmarried:
63.6% (1,759)
Marital status - Hispanic or Latino population 15 years and over
Males 53.0% Never married33.3% Now married0.0% Separated0.0% Widowed13.7% DivorcedFemales 46.9% Never married40.4% Now married8.6% Separated1.0% Widowed3.1% DivorcedWomen who gave birth in the past 12 months Now married:
59.1% (31)Unmarried:
40.9% (21)
Women who did not give birth in the past 12 months Now married:
50.1% (393)Unmarried:
49.9% (392)
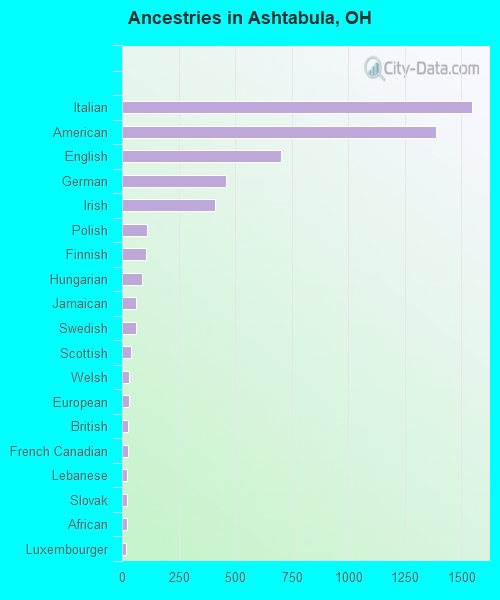
Ancestries in Ashtabula
1,546 19.5% Italian1,389 17.5% American703 8.9% English460 5.8% German412 5.2% Irish112 1.4% Polish106 1.3% Finnish89 1.1% Hungarian63 0.8% Jamaican61 0.8% Swedish38 0.5% Scottish33 0.4% Welsh30 0.4% European27 0.3% British25 0.3% French Canadian21 0.3% Lebanese20 0.3% Slovak20 0.3% African17 0.2% Luxembourger14 0.2% Slovene9 0.1% Russian8 0.1% Scotch-Irish7 0.09% Slavic5 0.06% Czech5 0.06% Icelander4 0.05% Croatian4 0.05% Portuguese4 0.05% Scandinavian
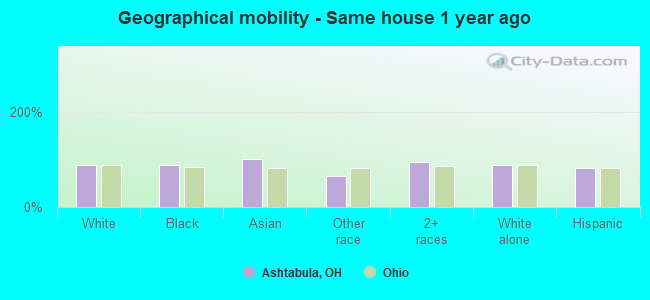
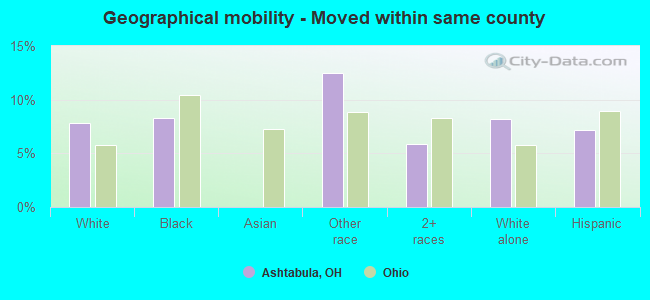
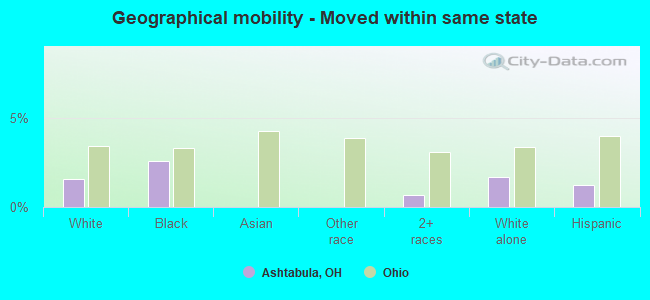
Geographical mobility in Ashtabula Same house 1 year ago 12,107 86.8% White (Caucasian)1,226 86.7% Black or African American71 100.0% Asian452 63.9% Other race2,179 93.6% Two or more races11,067 86.8% White alone, not Hispanic / Latino1,981 82.2% Hispanic or LatinoMoved within same county 1,095 7.9% White / Caucasian117 8.3% Black or African American88 12.5% Other race137 5.9% Two or more races1,046 8.2% White alone, not Hispanic / Latino173 7.2% Hispanic or LatinoMoved within same state 216 1.5% White / Caucasian37 2.6% Black or African American16 0.7% Two or more races214 1.7% White alone, not Hispanic / Latino30 1.2% Hispanic or LatinoMoved from different state 456 3.3% White / Caucasian35 2.5% Black or African American68 9.6% Other race15 0.6% Two or more races327 2.6% White alone, not Hispanic / Latino160 6.6% Hispanic or LatinoMoved from abroad 9 0.1% White146 20.7% Other race10 0.1% White alone, not Hispanic / Latino102 4.2% Hispanic or Latino
Children Nativity (place of birth) in Ashtabula
Children under 6 years - Living with two parents Both parents native 469 100.0% NativeChildren under 6 years - Living with one parent Native parent 850 100.0% NativeChildren 6 to 17 years - Living with two parents Both parents native 915 100.0% NativeBoth parents foreign-born 102 85.1% Native18 14.9% Foreign-bornOne native, one foreign-born parent 20 100.0% NativeChildren 6 to 17 years - Living with one parent Native parent 1,519 100.0% Native
Grandparents responsible for own grandchildren in Ashtabula
Grandparents (30 to 59 years) White / Caucasian 50 60.3% Responsible for grandchildren33 39.7% Not responsible for grandchildrenBlack or African American 27 100.0% Responsible for grandchildrenOther race 31 100.0% Not responsible for grandchildrenWhite alone, not Hispanic / Latino 50 59.9% Responsible for grandchildren34 40.1% Not responsible for grandchildrenHispanic or Latino 21 100.0% Not responsible for grandchildrenGrandparents (60 years and over) White / Caucasian 71 61.5% Responsible for grandchildren44 38.5% Not responsible for grandchildrenWhite alone, not Hispanic / Latino 64 59.1% Responsible for grandchildren44 40.9% Not responsible for grandchildrenHispanic or Latino 23 100.0% Not responsible for grandchildren