Races in Athens, Alabama (AL) Detailed Stats
Data:
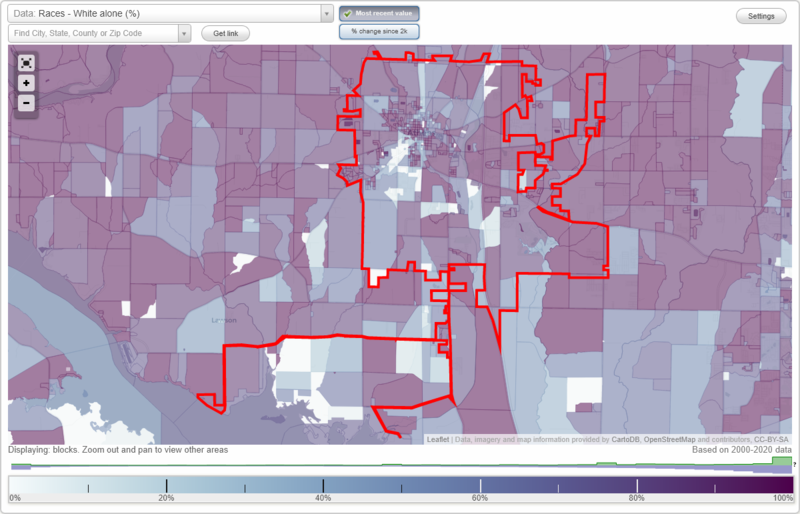
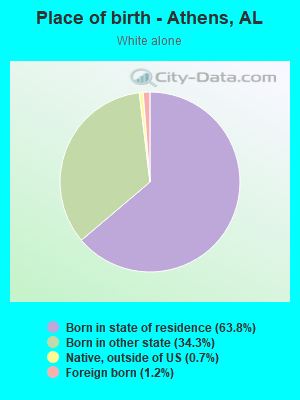
Races - White alone (%)
Races - White alone (% change since 2000)
Races - Black alone (%)
Races - Black alone (% change since 2000)
Races - American Indian alone (%)
Races - American Indian alone (% change since 2000)
Races - Asian alone (%)
Races - Asian alone (% change since 2000)
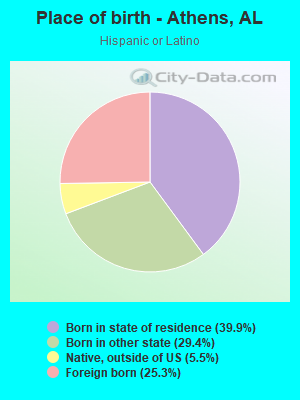
Races - Hispanic (%)
Races - Hispanic (% change since 2000)
Races - Native Hawaiian and Other Pacific Islander alone (%)
Races - Native Hawaiian and Other Pacific Islander alone (% change since 2000)
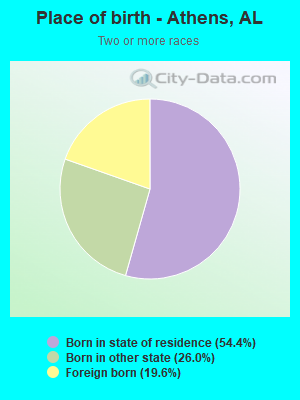
Races - Two or more races(%)
Races - Two or more races(% change since 2000)
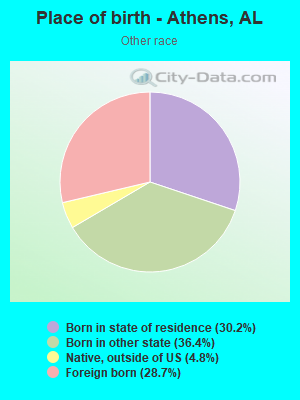
Races - Other race alone (%)
Races - Other race alone (% change since 2000)
Racial diversity
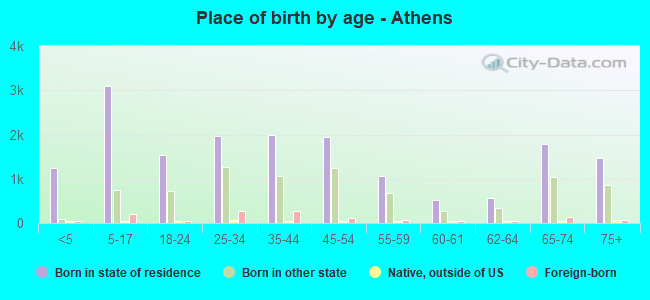
Place of birth - Born in state of residence (%)
Place of birth - Born in state of residence (%) - White
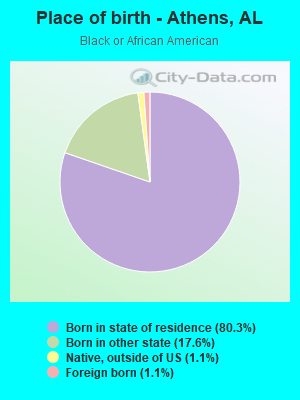
Place of birth - Born in state of residence (%) - Black or African American
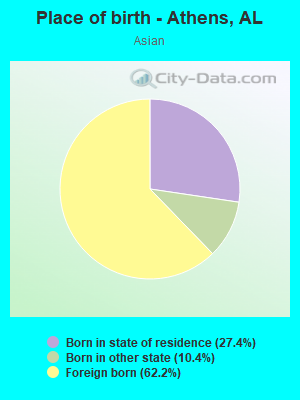
Place of birth - Born in state of residence (%) - Asian
Place of birth - Born in state of residence (%) - Hispanic or Latino
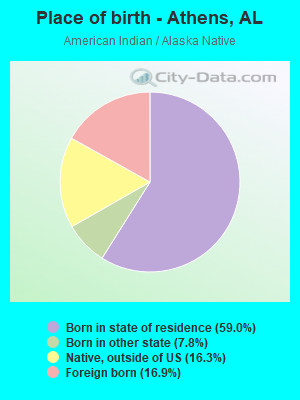
Place of birth - Born in state of residence (%) - American Indian and Alaska Native
Place of birth - Born in state of residence (%) - Multirace
Place of birth - Born in state of residence (%) - Other Race
Place of birth - Born in other state (%)
Place of birth - Born in other state (%) - White
Place of birth - Born in other state (%) - Black or African American
Place of birth - Born in other state (%) - Asian
Place of birth - Born in other state (%) - Hispanic or Latino
Place of birth - Born in other state (%) - American Indian and Alaska Native
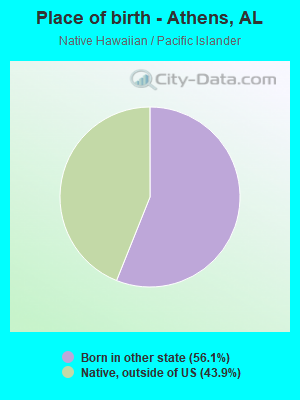
Place of birth - Born in other state (%) - Multirace
Place of birth - Born in other state (%) - Other Race
Place of birth - Native, outside of US (%)
Place of birth - Native, outside of US (%) - White
Place of birth - Native, outside of US (%) - Black or African American
Place of birth - Native, outside of US (%) - Asian
Place of birth - Native, outside of US (%) - Hispanic or Latino
Place of birth - Native, outside of US (%) - American Indian and Alaska Native
Place of birth - Native, outside of US (%) - Multirace
Place of birth - Native, outside of US (%) - Other Race
Place of birth - Foreign born (%)
Place of birth - Foreign born (%) - White
Place of birth - Foreign born (%) - Black or African American
Place of birth - Foreign born (%) - Asian
Place of birth - Foreign born (%) - Hispanic or Latino
Place of birth - Foreign born (%) - American Indian and Alaska Native
Place of birth - Foreign born (%) - Multirace
Place of birth - Foreign born (%) - Other Race
Residents speaking English at home (%)
Residents speaking English at home - Born in the United States (%)
Residents speaking English at home - Native, born elsewhere (%)
Residents speaking English at home - Foreign born (%)
Residents speaking Spanish at home (%)
Residents speaking Spanish at home - Born in the United States (%)
Residents speaking Spanish at home - Native, born elsewhere (%)
Residents speaking Spanish at home - Foreign born (%)
Residents speaking other language at home (%)
Residents speaking other language at home - Born in the United States (%)
Residents speaking other language at home - Native, born elsewhere (%)
Residents speaking other language at home - Foreign born (%)
Marital status - Never married (%)
Marital status - Now married (%)
Marital status - Separated (%)
Marital status - Widowed (%)
Marital status - Divorced (%)
Ancestries Reported - Arab (%)
Ancestries Reported - Czech (%)
Ancestries Reported - Danish (%)
Ancestries Reported - Dutch (%)
Ancestries Reported - English (%)
Ancestries Reported - French (%)
Ancestries Reported - French Canadian (%)
Ancestries Reported - German (%)
Ancestries Reported - Greek (%)
Ancestries Reported - Hungarian (%)
Ancestries Reported - Irish (%)
Ancestries Reported - Italian (%)
Ancestries Reported - Lithuanian (%)
Ancestries Reported - Norwegian (%)
Ancestries Reported - Polish (%)
Ancestries Reported - Portuguese (%)
Ancestries Reported - Russian (%)
Ancestries Reported - Scotch-Irish (%)
Ancestries Reported - Scottish (%)
Ancestries Reported - Slovak (%)
Ancestries Reported - Subsaharan African (%)
Ancestries Reported - Swedish (%)
Ancestries Reported - Swiss (%)
Ancestries Reported - Ukrainian (%)
Ancestries Reported - United States (%)
Ancestries Reported - Welsh (%)
Ancestries Reported - West Indian (%)
Ancestries Reported - Other (%)
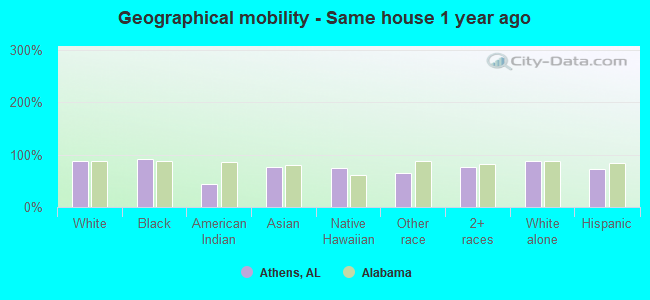
Geographical mobility - Same house 1 year ago (%)
Geographical mobility - Same house 1 year ago (%) - White
Geographical mobility - Same house 1 year ago (%) - Black or African American
Geographical mobility - Same house 1 year ago (%) - Asian
Geographical mobility - Same house 1 year ago (%) - Hispanic or Latino
Geographical mobility - Same house 1 year ago (%) - American Indian and Alaska Native
Geographical mobility - Same house 1 year ago (%) - Multirace
Geographical mobility - Same house 1 year ago (%) - Other Race
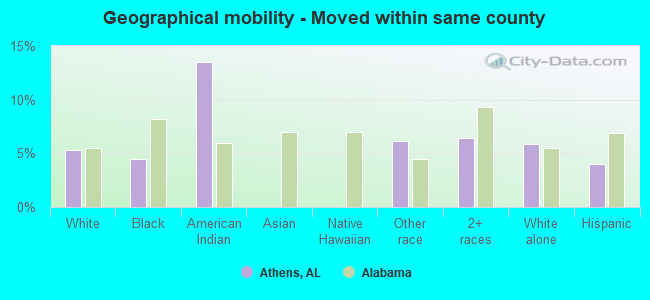
Geographical mobility - Moved within same county (%)
Geographical mobility - Moved within same county (%) - White
Geographical mobility - Moved within same county (%) - Black or African American
Geographical mobility - Moved within same county (%) - Asian
Geographical mobility - Moved within same county (%) - Hispanic or Latino
Geographical mobility - Moved within same county (%) - American Indian and Alaska Native
Geographical mobility - Moved within same county (%) - Multirace
Geographical mobility - Moved within same county (%) - Other Race
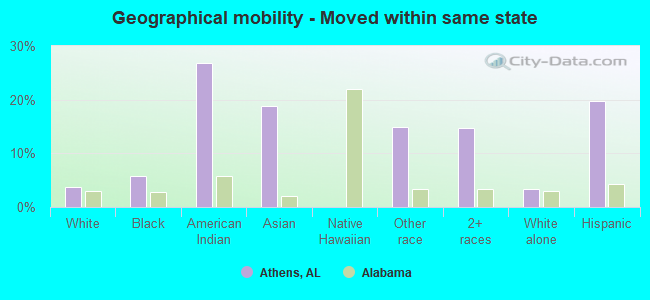
Geographical mobility - Moved from different county within same state (%)
Geographical mobility - Moved from different county within same state (%) - White
Geographical mobility - Moved from different county within same state (%) - Black or African American
Geographical mobility - Moved from different county within same state (%) - Asian
Geographical mobility - Moved from different county within same state (%) - Hispanic or Latino
Geographical mobility - Moved from different county within same state (%) - American Indian and Alaska Native
Geographical mobility - Moved from different county within same state (%) - Multirace
Geographical mobility - Moved from different county within same state (%) - Other Race
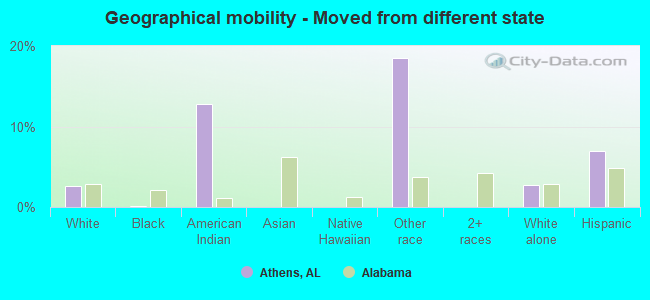
Geographical mobility - Moved from different state (%)
Geographical mobility - Moved from different state (%) - White
Geographical mobility - Moved from different state (%) - Black or African American
Geographical mobility - Moved from different state (%) - Asian
Geographical mobility - Moved from different state (%) - Hispanic or Latino
Geographical mobility - Moved from different state (%) - American Indian and Alaska Native
Geographical mobility - Moved from different state (%) - Multirace
Geographical mobility - Moved from different state (%) - Other Race
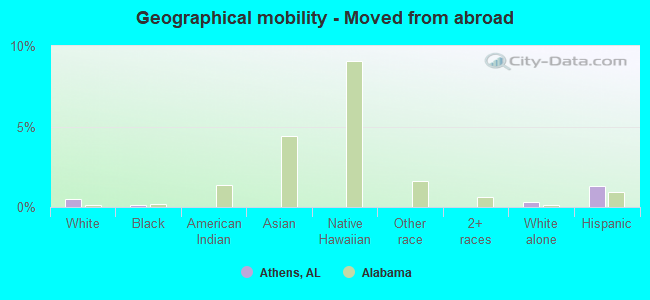
Geographical mobility - Moved from abroad (%)
Geographical mobility - Moved from abroad (%) - White
Geographical mobility - Moved from abroad (%) - Black or African American
Geographical mobility - Moved from abroad (%) - Asian
Geographical mobility - Moved from abroad (%) - Hispanic or Latino
Geographical mobility - Moved from abroad (%) - American Indian and Alaska Native
Geographical mobility - Moved from abroad (%) - Multirace
Geographical mobility - Moved from abroad (%) - Other Race
Place of birth for the foreign-born population - Ireland (%)
Place of birth for the foreign-born population - Denmark (%)
Place of birth for the foreign-born population - Norway (%)
Place of birth for the foreign-born population - Sweden (%)
Place of birth for the foreign-born population - United Kingdom (%)
Place of birth for the foreign-born population - England (%)
Place of birth for the foreign-born population - Scotland (%)
Place of birth for the foreign-born population - Other Northern Europe (%)
Place of birth for the foreign-born population - Austria (%)
Place of birth for the foreign-born population - Belgium (%)
Place of birth for the foreign-born population - France (%)
Place of birth for the foreign-born population - Germany (%)
Place of birth for the foreign-born population - Netherlands (%)
Place of birth for the foreign-born population - Switzerland (%)
Place of birth for the foreign-born population - Other Western Europe (%)
Place of birth for the foreign-born population - Greece (%)
Place of birth for the foreign-born population - Italy (%)
Place of birth for the foreign-born population - Portugal (%)
Place of birth for the foreign-born population - Spain (%)
Place of birth for the foreign-born population - Other Southern Europe (%)
Place of birth for the foreign-born population - Albania (%)
Place of birth for the foreign-born population - Belarus (%)
Place of birth for the foreign-born population - Bosnia and Herzegovina (%)
Place of birth for the foreign-born population - Bulgaria (%)
Place of birth for the foreign-born population - Croatia (%)
Place of birth for the foreign-born population - Czechoslovakia (%)
Place of birth for the foreign-born population - Hungary (%)
Place of birth for the foreign-born population - Latvia (%)
Place of birth for the foreign-born population - Lithuania (%)
Place of birth for the foreign-born population - North Macedonia (Macedonia) (%)
Place of birth for the foreign-born population - Moldova (%)
Place of birth for the foreign-born population - Poland (%)
Place of birth for the foreign-born population - Romania (%)
Place of birth for the foreign-born population - Russia (%)
Place of birth for the foreign-born population - Serbia (%)
Place of birth for the foreign-born population - Ukraine (%)
Place of birth for the foreign-born population - Other Eastern Europe (%)
Place of birth for the foreign-born population - China (%)
Place of birth for the foreign-born population - Hong Kong (%)
Place of birth for the foreign-born population - Taiwan (%)
Place of birth for the foreign-born population - Japan (%)
Place of birth for the foreign-born population - Korea (%)
Place of birth for the foreign-born population - Other Eastern Asia (%)
Place of birth for the foreign-born population - Afghanistan (%)
Place of birth for the foreign-born population - Bangladesh (%)
Place of birth for the foreign-born population - India (%)
Place of birth for the foreign-born population - Iran (%)
Place of birth for the foreign-born population - Kazakhstan (%)
Place of birth for the foreign-born population - Nepal (%)
Place of birth for the foreign-born population - Pakistan (%)
Place of birth for the foreign-born population - Sri Lanka (%)
Place of birth for the foreign-born population - Uzbekistan (%)
Place of birth for the foreign-born population - Other South Central Asia (%)
Place of birth for the foreign-born population - Burma (%)
Place of birth for the foreign-born population - Cambodia (%)
Place of birth for the foreign-born population - Indonesia (%)
Place of birth for the foreign-born population - Laos (%)
Place of birth for the foreign-born population - Malaysia (%)
Place of birth for the foreign-born population - Philippines (%)
Place of birth for the foreign-born population - Singapore (%)
Place of birth for the foreign-born population - Thailand (%)
Place of birth for the foreign-born population - Vietnam (%)
Place of birth for the foreign-born population - Other South Eastern Asia (%)
Place of birth for the foreign-born population - Armenia (%)
Place of birth for the foreign-born population - Iraq (%)
Place of birth for the foreign-born population - Israel (%)
Place of birth for the foreign-born population - Jordan (%)
Place of birth for the foreign-born population - Kuwait (%)
Place of birth for the foreign-born population - Lebanon (%)
Place of birth for the foreign-born population - Saudi Arabia (%)
Place of birth for the foreign-born population - Syria (%)
Place of birth for the foreign-born population - Turkey (%)
Place of birth for the foreign-born population - Yemen (%)
Place of birth for the foreign-born population - Other Western Asia (%)
Place of birth for the foreign-born population - Eritrea (%)
Place of birth for the foreign-born population - Ethiopia (%)
Place of birth for the foreign-born population - Kenya (%)
Place of birth for the foreign-born population - Somalia (%)
Place of birth for the foreign-born population - Uganda (%)
Place of birth for the foreign-born population - Zimbabwe (%)
Place of birth for the foreign-born population - Other Eastern Africa (%)
Place of birth for the foreign-born population - Cameroon (%)
Place of birth for the foreign-born population - Congo (%)
Place of birth for the foreign-born population - Democratic Republic of Congo (Zaire) (%)
Place of birth for the foreign-born population - Other Middle Africa (%)
Place of birth for the foreign-born population - Egypt (%)
Place of birth for the foreign-born population - Morocco (%)
Place of birth for the foreign-born population - Sudan (%)
Place of birth for the foreign-born population - Other Northern Africa (%)
Place of birth for the foreign-born population - South Africa (%)
Place of birth for the foreign-born population - Other Southern Africa (%)
Place of birth for the foreign-born population - Cabo Verde (%)
Place of birth for the foreign-born population - Ghana (%)
Place of birth for the foreign-born population - Liberia (%)
Place of birth for the foreign-born population - Nigeria (%)
Place of birth for the foreign-born population - Senegal (%)
Place of birth for the foreign-born population - Sierra Leone (%)
Place of birth for the foreign-born population - Other Western Africa (%)
Place of birth for the foreign-born population - Australia (%)
Place of birth for the foreign-born population - New Zealand (%)
Place of birth for the foreign-born population - Fiji (%)
Place of birth for the foreign-born population - Micronesia (%)
Place of birth for the foreign-born population - Bahamas (%)
Place of birth for the foreign-born population - Barbados (%)
Place of birth for the foreign-born population - Cuba (%)
Place of birth for the foreign-born population - Dominica (%)
Place of birth for the foreign-born population - Dominican Republic (%)
Place of birth for the foreign-born population - Grenada (%)
Place of birth for the foreign-born population - Haiti (%)
Place of birth for the foreign-born population - Jamaica (%)
Place of birth for the foreign-born population - St. Vincent and the Grenadines (%)
Place of birth for the foreign-born population - Trinidad and Tobago (%)
Place of birth for the foreign-born population - West Indies (%)
Place of birth for the foreign-born population - Other Caribbean (%)
Place of birth for the foreign-born population - Belize (%)
Place of birth for the foreign-born population - Costa Rica (%)
Place of birth for the foreign-born population - El Salvador (%)
Place of birth for the foreign-born population - Guatemala (%)
Place of birth for the foreign-born population - Honduras (%)
Place of birth for the foreign-born population - Mexico (%)
Place of birth for the foreign-born population - Nicaragua (%)
Place of birth for the foreign-born population - Panama (%)
Place of birth for the foreign-born population - Other Central America (%)
Place of birth for the foreign-born population - Argentina (%)
Place of birth for the foreign-born population - Bolivia (%)
Place of birth for the foreign-born population - Brazil (%)
Place of birth for the foreign-born population - Chile (%)
Place of birth for the foreign-born population - Colombia (%)
Place of birth for the foreign-born population - Ecuador (%)
Place of birth for the foreign-born population - Guyana (%)
Place of birth for the foreign-born population - Peru (%)
Place of birth for the foreign-born population - Uruguay (%)
Place of birth for the foreign-born population - Venezuela (%)
Place of birth for the foreign-born population - Other South America (%)
Place of birth for the foreign-born population - Canada (%)
Place of birth for the foreign-born population - Other Northern America (%)
Place of birth for the foreign-born population - Other (%)
Latest news about races in Athens, AL collected exclusively by city-data.com from local newspapers, TV, and radio stations
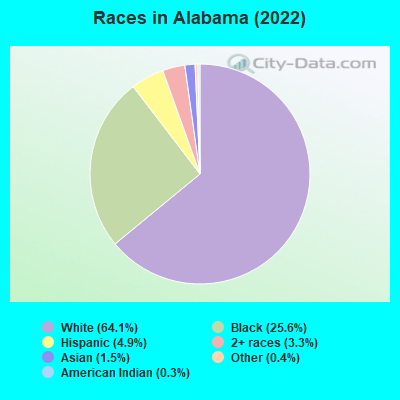
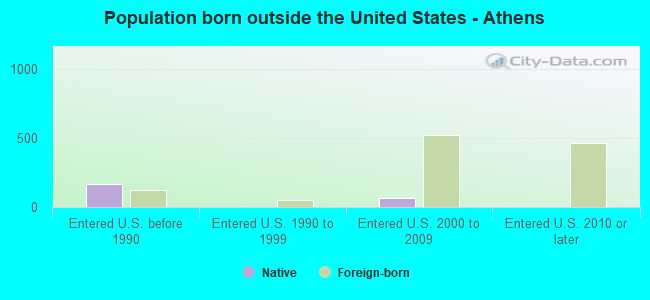
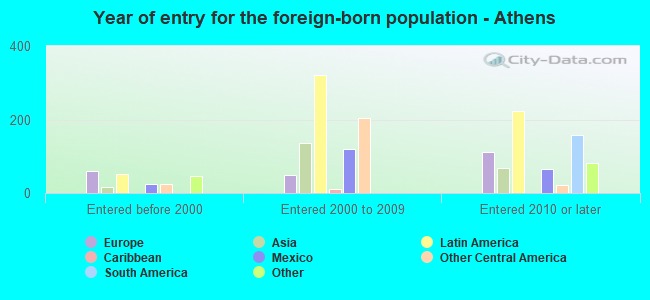
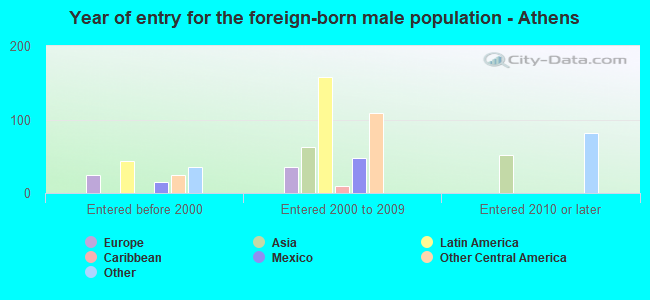
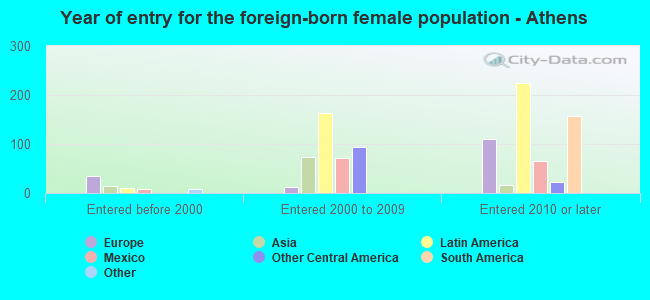
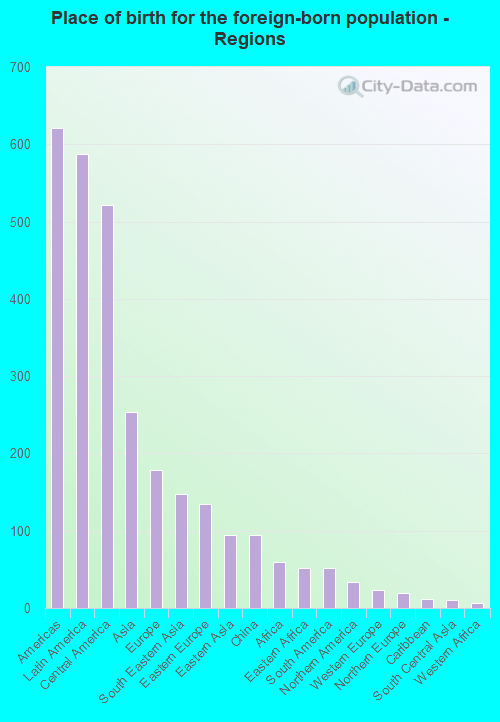
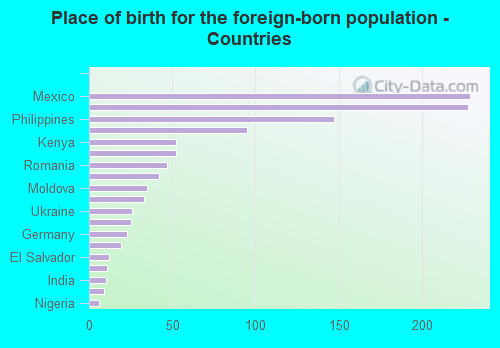
According to 2022 data, the most numerous races in Athens, AL are White alone (18,754 residents), Black alone (4,490 residents), and Hispanic (2,269 residents). 93.3% of Athens residents speak English at home. 4.0% of Athens, AL residents are foreign-born (2.2% born in Latin America, 1.0% born in Asia, 0.7% born in Europe), which is 24.8% greater than the foreign-born rate of 3.0% across the entire state of Alabama.
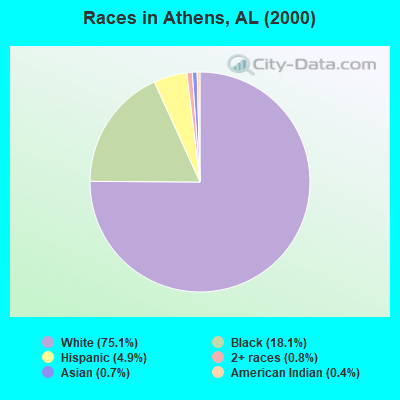
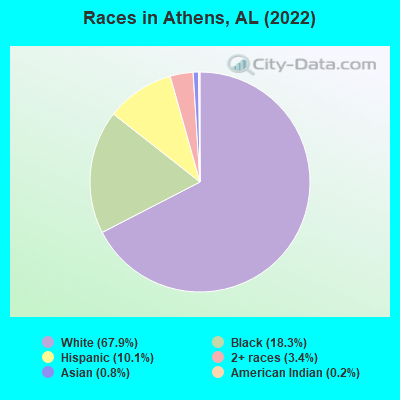
Race distribution in Athens
2000 2022
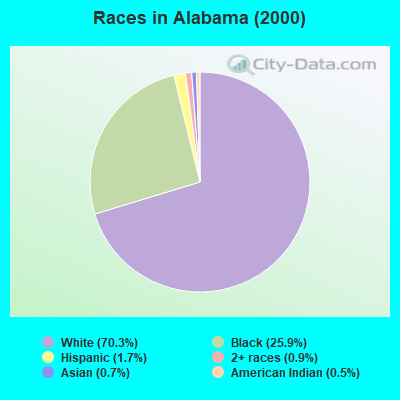
3,125,819 70.3% White alone 1,150,076 25.9% Black alone 75,830 1.7% Hispanic 39,086 0.9% Two or more races 30,989 0.7% Asian alone 21,618 0.5% American Indian alone 2,623 0.06% Other race alone 1,059 0.02% Native Hawaiian and Other
3,250,182 64.1% White alone 1,296,500 25.6% Black alone 246,477 4.9% Hispanic 169,880 3.3% Two or more races 76,682 1.5% Asian alone 19,927 0.4% Other race alone 12,694 0.3% American Indian alone 1,954 0.04% Native Hawaiian and Other
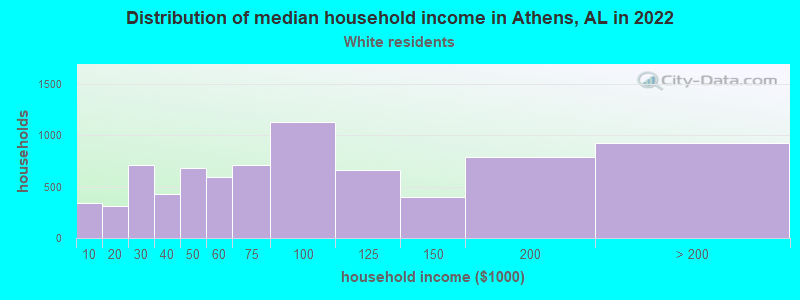
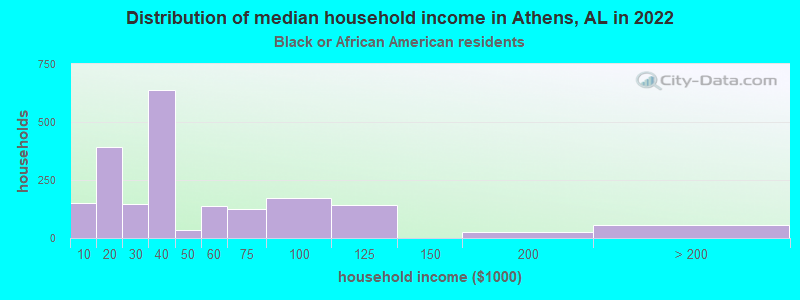
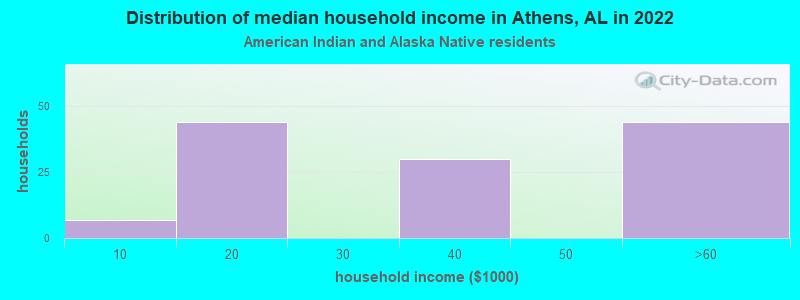
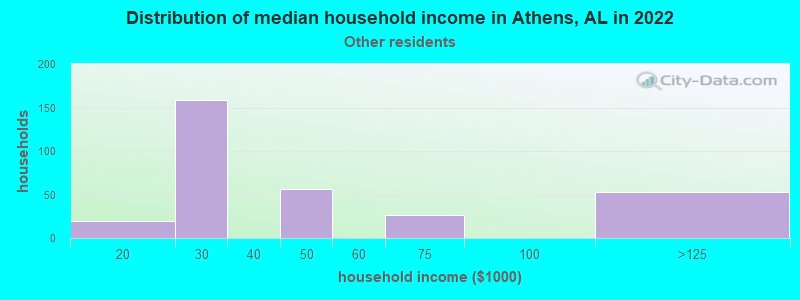
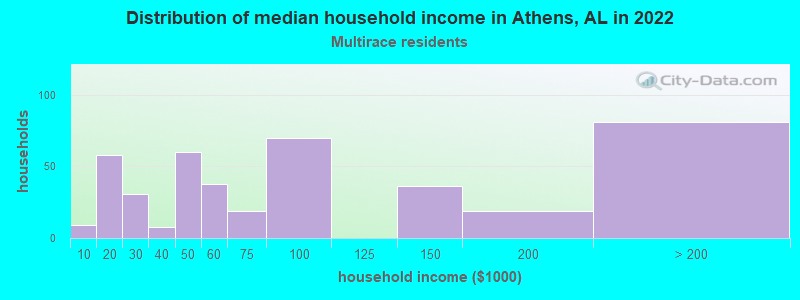
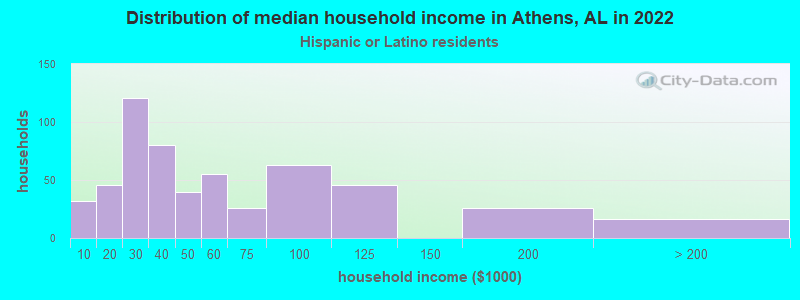
Income and house value in Athens Median household income in 2022 $76,076 White non-Hispanic householders$43,097 Black householders$40,691 American Indian and Alaska Native householdersover $200,000 Asian householders$48,853 Some other race householders$18,456 Two or more races householders$24,107 Hispanic or Latino race householdersMedian 2022 house value $253,285 White Non-Hispanic householders$150,871 Black or African American householders$491,117 American Indian or Alaska Native householders $360,153 Asian householders$200,900 Two or more races householders$240,189 Hispanic or Latino householders
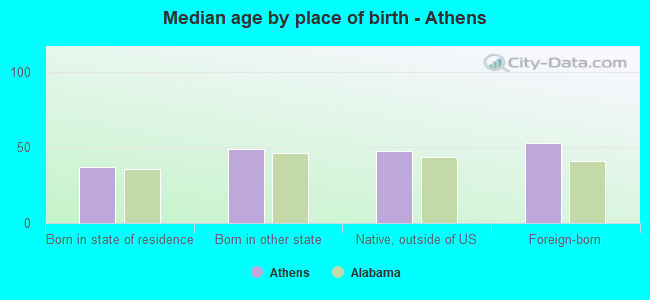
Median age by race in Athens
43.2 Median age for White residents43.6 43.8 40.9 Median age for Black or African American residents41.9 40.8 59.0 Median age for American Indian / Alaska Native residents43.6 64.2 26.8 Median age for Asian residents26.6 20.2 41.0 Median age for Native Hawaiian / Pacific Islander residents27.8 Median age for Other race residents24.6 32.2 25.0 Median age for Two or more races residents26.7 23.7 44.4 Median age for White alone residents43.5 45.9 20.3 Median age for Hispanic or Latino residents15.0 27.3
Owner/renter occupied households by race in Athens
House owners and renters - White residents 5,746 77.6% Owner occupied1,662 22.4% Renter occupiedHouse owners and renters - Black or African American residents 624 35.1% Owner occupied1,152 64.9% Renter occupiedHouse owners and renters - American Indian / Alaska Native residents 30 60.5% Owner occupied19 39.5% Renter occupiedHouse owners and renters - Asian residents 68 100.0% Owner occupiedHouse owners and renters - Native Hawaiian / Pacific Islander residents 48 100.0% Renter occupiedHouse owners and renters - Other race residents 26 13.9% Owner occupied162 86.1% Renter occupiedHouse owners and renters - Two or more races residents 87 41.3% Owner occupied123 58.7% Renter occupiedHouse owners and renters - White alone residents 5,606 77.5% Owner occupied1,627 22.5% Renter occupiedHouse owners and renters - Hispanic or Latino residents 205 35.5% Owner occupied372 64.5% Renter occupied
Language usage in Athens
English speakers - Total 93.3% of residents of Athens speak English at home.
4.9% of residents speak Spanish at home 748 59.9% Speak English very well500 40.1% Speak English less than very well1.8% of residents speak other language at home 361 77.3% Speak English very well106 22.7% Speak English less than very well
English speakers - Born in the United States 95.7% of residents of Athens speak English at home.
3.5% of residents speak Spanish at home 221 78.6% Speak English very well60 21.4% Speak English less than very well0.8% of residents speak other language at home 62 100.0% Speak English very well
English speakers - Native, born elsewhere 80.4% of residents of Athens speak English at home.
21.3% of residents speak other language at home 47 77.0% Speak English very well14 23.0% Speak English less than very well
English speakers - Foreign-born 25.8% of residents of Athens speak English at home.
45.0% of residents speak Spanish at home 190 36.7% Speak English very well328 63.3% Speak English less than very well29.1% of residents speak other language at home 254 75.8% Speak English very well81 24.2% Speak English less than very well
White (Caucasian) - Speak only English Native:
97.8% (17,764)Foreign-born:
35.2% (132)
White (Caucasian) - Speak another language Native:
2.1% (382)Foreign-born:
65.6% (247)
Black or African American - Speak another language Native:
1.2% (51)Foreign-born:
84.0% (41)
American Indian / Alaska Native - Speak another language Native:
52.2% (60)Foreign-born:
100.0% (46)
Asian - Speak only English Native:
100.0% (152)Foreign-born:
52.7% (145)
Other race - Speak only English Native:
49.8% (328)Foreign-born:
2.5% (7)
Other race - Speak another language Native:
53.1% (349)Foreign-born:
96.7% (262)
White alone - Speak only English Native:
99.3% (17,486)Foreign-born:
68.0% (156)
White alone - Speak another language Native:
0.7% (121)Foreign-born:
30.0% (69)
Hispanic or Latino - Speak only English Native:
52.2% (861)Foreign-born:
0.6% (3)
Hispanic or Latino - Speak another language Native:
48.6% (801)Foreign-born:
100.0% (555)
Foreign-born residents in Athens 1,114 residents are foreign born (2.2% Latin America , 1.0% Asia , 0.7% Europe ).
This city:
4.0%Alabama:
100.0%
Marital status for residents in Athens Marital status - White (Caucasian) population 15 years and over
Males 26.1% Never married57.6% Now married1.4% Separated4.3% Widowed10.6% DivorcedFemales 23.5% Never married45.7% Now married1.9% Separated14.6% Widowed14.3% DivorcedWomen who gave birth in the past 12 months Now married:
5.0% (8)Unmarried:
95.0% (157)
Women who did not give birth in the past 12 months Now married:
43.3% (1,921)Unmarried:
56.7% (2,515)
Marital status - Black or African American population 15 years and over
Males 53.9% Never married29.7% Now married3.8% Separated2.5% Widowed10.2% DivorcedFemales 33.4% Never married35.4% Now married3.2% Separated9.9% Widowed18.0% DivorcedWomen who gave birth in the past 12 months Now married:
0.0% (0)Unmarried:
100.0% (20)
Women who did not give birth in the past 12 months Now married:
39.2% (402)Unmarried:
60.8% (623)
Marital status - American Indian / Alaska Native population 15 years and over
Males 0.0% Never married76.7% Now married6.8% Separated0.0% Widowed16.4% DivorcedFemales 56.7% Never married26.8% Now married5.5% Separated11.0% Widowed0.0% DivorcedWomen who did not give birth in the past 12 months Now married:
39.2% (14)Unmarried:
60.8% (21)
Marital status - Asian population 15 years and over
Males 78.5% Never married21.5% Now married0.0% Separated0.0% Widowed0.0% DivorcedFemales 52.1% Never married47.9% Now married0.0% Separated0.0% Widowed0.0% DivorcedWomen who did not give birth in the past 12 months Now married:
43.4% (69)Unmarried:
56.6% (90)
Marital status - Other race population 15 years and over
Males 55.0% Never married38.9% Now married0.0% Separated0.0% Widowed6.2% DivorcedFemales 9.3% Never married55.9% Now married0.0% Separated0.0% Widowed34.8% DivorcedWomen who gave birth in the past 12 months Now married:
100.0% (58)Unmarried:
0.0% (0)
Women who did not give birth in the past 12 months Now married:
55.9% (128)Unmarried:
44.1% (101)
Marital status - Two or more races population 15 years and over
Males 43.5% Never married39.6% Now married0.0% Separated0.0% Widowed16.9% DivorcedFemales 63.0% Never married29.2% Now married0.0% Separated3.9% Widowed3.9% DivorcedWomen who did not give birth in the past 12 months Now married:
29.5% (126)Unmarried:
70.5% (301)
Marital status - White alone, not Hispanic / Latino population 15 years and over
Males 26.2% Never married58.4% Now married0.3% Separated4.0% Widowed11.0% DivorcedFemales 23.7% Never married45.7% Now married1.4% Separated14.9% Widowed14.4% DivorcedWomen who gave birth in the past 12 months Now married:
5.0% (8)Unmarried:
95.0% (159)
Women who did not give birth in the past 12 months Now married:
41.8% (1,798)Unmarried:
58.2% (2,504)
Marital status - Hispanic or Latino population 15 years and over
Males 37.2% Never married39.5% Now married14.1% Separated5.8% Widowed3.4% DivorcedFemales 16.8% Never married46.3% Now married7.0% Separated2.4% Widowed27.6% DivorcedWomen who gave birth in the past 12 months Now married:
100.0% (53)Unmarried:
0.0% (0)
Women who did not give birth in the past 12 months Now married:
55.3% (332)Unmarried:
44.7% (268)
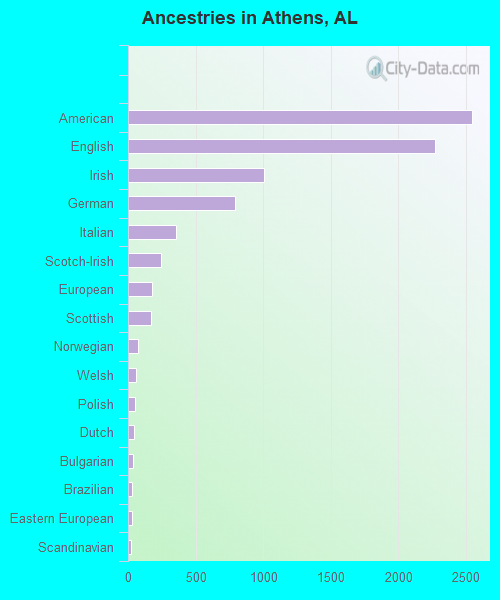
Ancestries in Athens
3,704 24.5% American2,001 13.3% English702 4.7% Irish395 2.6% German342 2.3% European287 1.9% Italian257 1.7% Scottish172 1.1% Scotch-Irish80 0.5% Brazilian62 0.4% Polish59 0.4% Dutch48 0.3% Scandinavian45 0.3% Eastern European39 0.3% Canadian37 0.2% British35 0.2% Welsh34 0.2% Kenyan30 0.2% Norwegian26 0.2% Russian19 0.1% French15 0.10% Swedish13 0.09% Lithuanian12 0.08% Austrian12 0.08% French Canadian9 0.06% Czech7 0.05% Belgian7 0.05% Pennsylvania German5 0.03% African
Geographical mobility in Athens Same house 1 year ago 17,403 87.9% White (Caucasian)4,216 91.5% Black or African American76 44.5% American Indian / Alaska Native325 75.6% Asian63 74.4% Native Hawaiian / Pacific Islander594 65.3% Other race979 76.9% Two or more races16,281 87.7% White alone, not Hispanic / Latino1,527 72.1% Hispanic or LatinoMoved within same county 1,047 5.3% White / Caucasian208 4.5% Black or African American23 13.5% American Indian / Alaska Native56 6.1% Other race82 6.4% Two or more races1,092 5.9% White alone, not Hispanic / Latino84 4.0% Hispanic or LatinoMoved within same state 735 3.7% White / Caucasian270 5.9% Black or African American46 26.8% American Indian / Alaska Native81 18.8% Asian136 15.0% Other race187 14.7% Two or more races629 3.4% White alone, not Hispanic / Latino418 19.7% Hispanic or LatinoMoved from different state 519 2.6% White / Caucasian6 0.1% Black or African American22 12.8% American Indian / Alaska Native169 18.5% Other race516 2.8% White alone, not Hispanic / Latino147 7.0% Hispanic or LatinoMoved from abroad 101 0.5% White5 0.1% Black or African American53 0.3% White alone, not Hispanic / Latino27 1.3% Hispanic or Latino
Children Nativity (place of birth) in Athens
Children under 6 years - Living with two parents Both parents native 726 100.0% NativeBoth parents foreign-born 52 100.0% NativeOne native, one foreign-born parent 101 100.0% NativeChildren under 6 years - Living with one parent Native parent 762 100.0% NativeChildren 6 to 17 years - Living with two parents Both parents native 1,843 94.5% Native107 5.5% Foreign-bornBoth parents foreign-born 266 82.3% Native57 17.7% Foreign-bornOne native, one foreign-born parent 108 100.0% NativeChildren 6 to 17 years - Living with one parent Native parent 1,039 97.8% Native23 2.2% Foreign-bornForeign-born parent 50 80.5% Native12 19.5% Foreign-born
Grandparents responsible for own grandchildren in Athens
Grandparents (30 to 59 years) White / Caucasian 81 65.5% Responsible for grandchildren43 34.5% Not responsible for grandchildrenBlack or African American 13 24.6% Responsible for grandchildren39 75.4% Not responsible for grandchildrenWhite alone, not Hispanic / Latino 79 63.3% Responsible for grandchildren46 36.7% Not responsible for grandchildrenGrandparents (60 years and over) White / Caucasian 80 34.4% Responsible for grandchildren152 65.6% Not responsible for grandchildrenBlack or African American 9 100.0% Responsible for grandchildrenWhite alone, not Hispanic / Latino 81 33.7% Responsible for grandchildren159 66.3% Not responsible for grandchildren