Races in Avocado Heights, California (CA) Detailed Stats
Data:
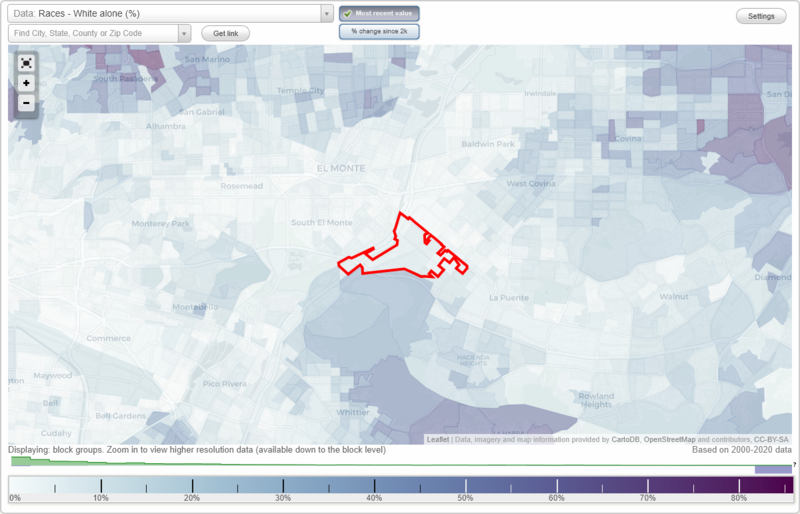
Races - White alone (%)
Races - White alone (% change since 2000)
Races - Black alone (%)
Races - Black alone (% change since 2000)
Races - American Indian alone (%)
Races - American Indian alone (% change since 2000)
Races - Asian alone (%)
Races - Asian alone (% change since 2000)
Races - Hispanic (%)
Races - Hispanic (% change since 2000)
Races - Native Hawaiian and Other Pacific Islander alone (%)
Races - Native Hawaiian and Other Pacific Islander alone (% change since 2000)
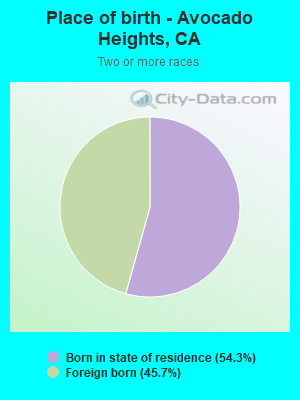
Races - Two or more races(%)
Races - Two or more races(% change since 2000)
Races - Other race alone (%)
Races - Other race alone (% change since 2000)
Racial diversity
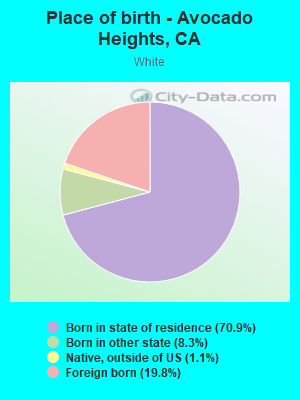
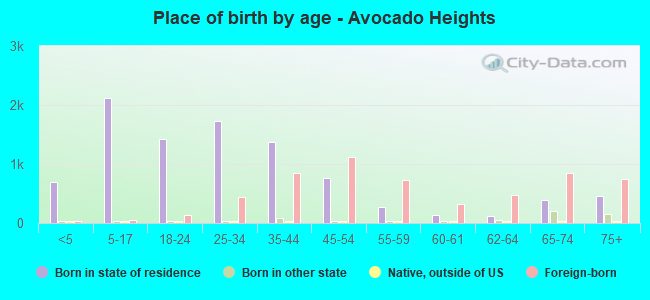
Place of birth - Born in state of residence (%)
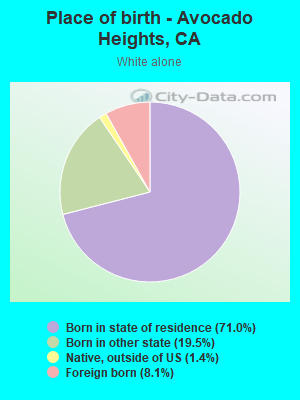
Place of birth - Born in state of residence (%) - White
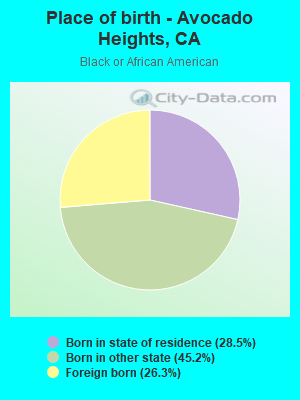
Place of birth - Born in state of residence (%) - Black or African American
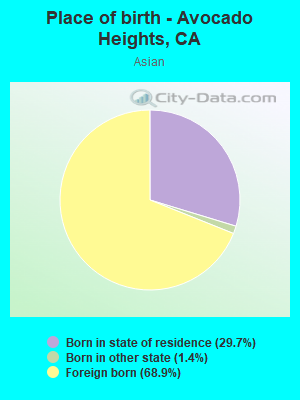
Place of birth - Born in state of residence (%) - Asian
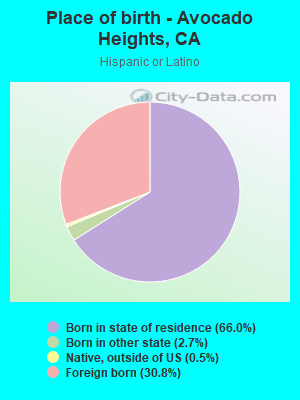
Place of birth - Born in state of residence (%) - Hispanic or Latino
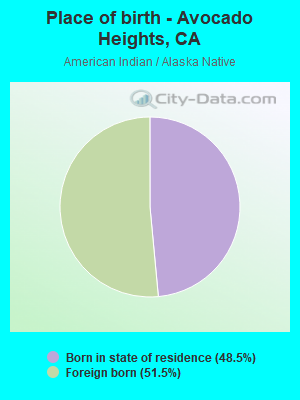
Place of birth - Born in state of residence (%) - American Indian and Alaska Native
Place of birth - Born in state of residence (%) - Multirace
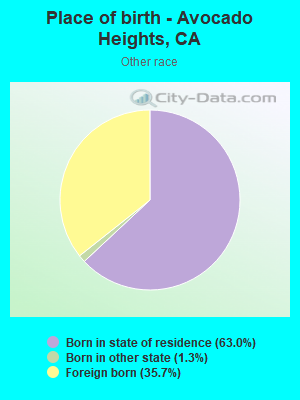
Place of birth - Born in state of residence (%) - Other Race
Place of birth - Born in other state (%)
Place of birth - Born in other state (%) - White
Place of birth - Born in other state (%) - Black or African American
Place of birth - Born in other state (%) - Asian
Place of birth - Born in other state (%) - Hispanic or Latino
Place of birth - Born in other state (%) - American Indian and Alaska Native
Place of birth - Born in other state (%) - Multirace
Place of birth - Born in other state (%) - Other Race
Place of birth - Native, outside of US (%)
Place of birth - Native, outside of US (%) - White
Place of birth - Native, outside of US (%) - Black or African American
Place of birth - Native, outside of US (%) - Asian
Place of birth - Native, outside of US (%) - Hispanic or Latino
Place of birth - Native, outside of US (%) - American Indian and Alaska Native
Place of birth - Native, outside of US (%) - Multirace
Place of birth - Native, outside of US (%) - Other Race
Place of birth - Foreign born (%)
Place of birth - Foreign born (%) - White
Place of birth - Foreign born (%) - Black or African American
Place of birth - Foreign born (%) - Asian
Place of birth - Foreign born (%) - Hispanic or Latino
Place of birth - Foreign born (%) - American Indian and Alaska Native
Place of birth - Foreign born (%) - Multirace
Place of birth - Foreign born (%) - Other Race
Residents speaking English at home (%)
Residents speaking English at home - Born in the United States (%)
Residents speaking English at home - Native, born elsewhere (%)
Residents speaking English at home - Foreign born (%)
Residents speaking Spanish at home (%)
Residents speaking Spanish at home - Born in the United States (%)
Residents speaking Spanish at home - Native, born elsewhere (%)
Residents speaking Spanish at home - Foreign born (%)
Residents speaking other language at home (%)
Residents speaking other language at home - Born in the United States (%)
Residents speaking other language at home - Native, born elsewhere (%)
Residents speaking other language at home - Foreign born (%)
Marital status - Never married (%)
Marital status - Now married (%)
Marital status - Separated (%)
Marital status - Widowed (%)
Marital status - Divorced (%)
Ancestries Reported - Arab (%)
Ancestries Reported - Czech (%)
Ancestries Reported - Danish (%)
Ancestries Reported - Dutch (%)
Ancestries Reported - English (%)
Ancestries Reported - French (%)
Ancestries Reported - French Canadian (%)
Ancestries Reported - German (%)
Ancestries Reported - Greek (%)
Ancestries Reported - Hungarian (%)
Ancestries Reported - Irish (%)
Ancestries Reported - Italian (%)
Ancestries Reported - Lithuanian (%)
Ancestries Reported - Norwegian (%)
Ancestries Reported - Polish (%)
Ancestries Reported - Portuguese (%)
Ancestries Reported - Russian (%)
Ancestries Reported - Scotch-Irish (%)
Ancestries Reported - Scottish (%)
Ancestries Reported - Slovak (%)
Ancestries Reported - Subsaharan African (%)
Ancestries Reported - Swedish (%)
Ancestries Reported - Swiss (%)
Ancestries Reported - Ukrainian (%)
Ancestries Reported - United States (%)
Ancestries Reported - Welsh (%)
Ancestries Reported - West Indian (%)
Ancestries Reported - Other (%)
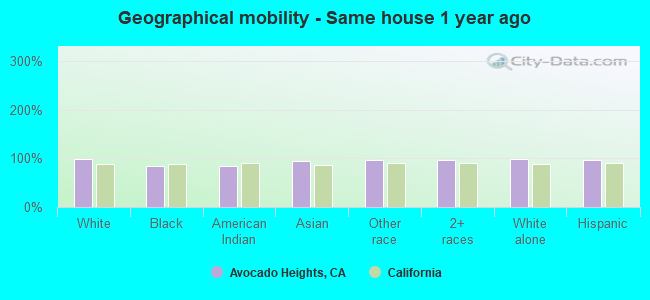
Geographical mobility - Same house 1 year ago (%)
Geographical mobility - Same house 1 year ago (%) - White
Geographical mobility - Same house 1 year ago (%) - Black or African American
Geographical mobility - Same house 1 year ago (%) - Asian
Geographical mobility - Same house 1 year ago (%) - Hispanic or Latino
Geographical mobility - Same house 1 year ago (%) - American Indian and Alaska Native
Geographical mobility - Same house 1 year ago (%) - Multirace
Geographical mobility - Same house 1 year ago (%) - Other Race
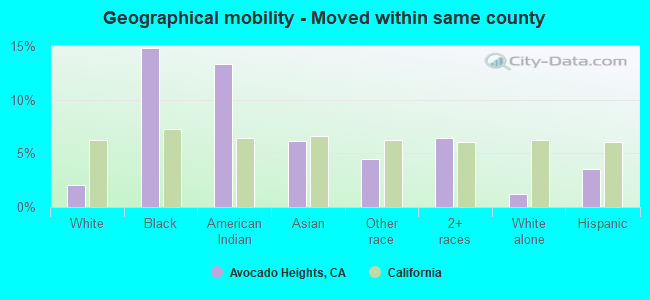
Geographical mobility - Moved within same county (%)
Geographical mobility - Moved within same county (%) - White
Geographical mobility - Moved within same county (%) - Black or African American
Geographical mobility - Moved within same county (%) - Asian
Geographical mobility - Moved within same county (%) - Hispanic or Latino
Geographical mobility - Moved within same county (%) - American Indian and Alaska Native
Geographical mobility - Moved within same county (%) - Multirace
Geographical mobility - Moved within same county (%) - Other Race
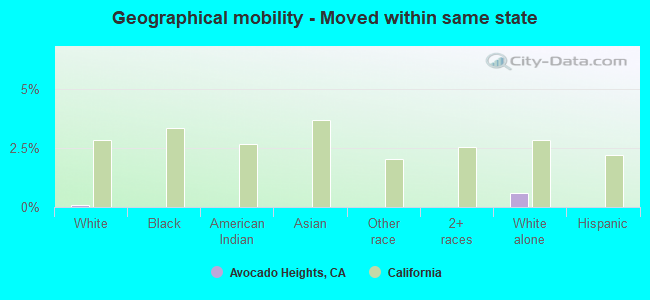
Geographical mobility - Moved from different county within same state (%)
Geographical mobility - Moved from different county within same state (%) - White
Geographical mobility - Moved from different county within same state (%) - Black or African American
Geographical mobility - Moved from different county within same state (%) - Asian
Geographical mobility - Moved from different county within same state (%) - Hispanic or Latino
Geographical mobility - Moved from different county within same state (%) - American Indian and Alaska Native
Geographical mobility - Moved from different county within same state (%) - Multirace
Geographical mobility - Moved from different county within same state (%) - Other Race
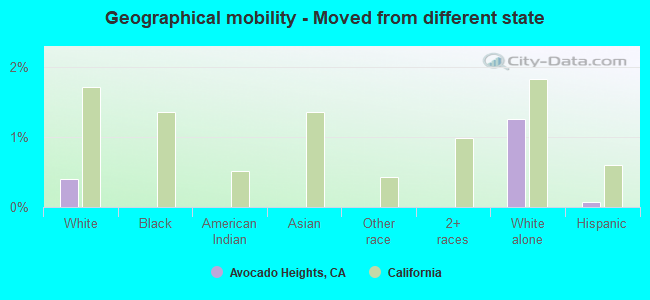
Geographical mobility - Moved from different state (%)
Geographical mobility - Moved from different state (%) - White
Geographical mobility - Moved from different state (%) - Black or African American
Geographical mobility - Moved from different state (%) - Asian
Geographical mobility - Moved from different state (%) - Hispanic or Latino
Geographical mobility - Moved from different state (%) - American Indian and Alaska Native
Geographical mobility - Moved from different state (%) - Multirace
Geographical mobility - Moved from different state (%) - Other Race
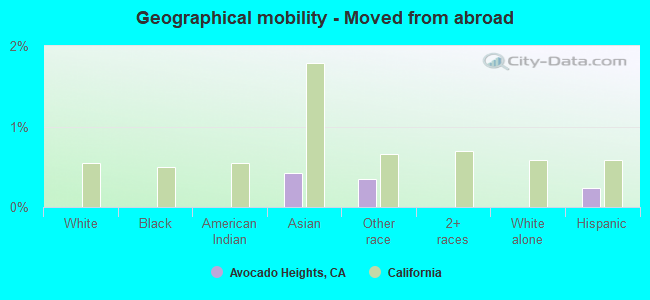
Geographical mobility - Moved from abroad (%)
Geographical mobility - Moved from abroad (%) - White
Geographical mobility - Moved from abroad (%) - Black or African American
Geographical mobility - Moved from abroad (%) - Asian
Geographical mobility - Moved from abroad (%) - Hispanic or Latino
Geographical mobility - Moved from abroad (%) - American Indian and Alaska Native
Geographical mobility - Moved from abroad (%) - Multirace
Geographical mobility - Moved from abroad (%) - Other Race
Place of birth for the foreign-born population - Ireland (%)
Place of birth for the foreign-born population - Denmark (%)
Place of birth for the foreign-born population - Norway (%)
Place of birth for the foreign-born population - Sweden (%)
Place of birth for the foreign-born population - United Kingdom (%)
Place of birth for the foreign-born population - England (%)
Place of birth for the foreign-born population - Scotland (%)
Place of birth for the foreign-born population - Other Northern Europe (%)
Place of birth for the foreign-born population - Austria (%)
Place of birth for the foreign-born population - Belgium (%)
Place of birth for the foreign-born population - France (%)
Place of birth for the foreign-born population - Germany (%)
Place of birth for the foreign-born population - Netherlands (%)
Place of birth for the foreign-born population - Switzerland (%)
Place of birth for the foreign-born population - Other Western Europe (%)
Place of birth for the foreign-born population - Greece (%)
Place of birth for the foreign-born population - Italy (%)
Place of birth for the foreign-born population - Portugal (%)
Place of birth for the foreign-born population - Spain (%)
Place of birth for the foreign-born population - Other Southern Europe (%)
Place of birth for the foreign-born population - Albania (%)
Place of birth for the foreign-born population - Belarus (%)
Place of birth for the foreign-born population - Bosnia and Herzegovina (%)
Place of birth for the foreign-born population - Bulgaria (%)
Place of birth for the foreign-born population - Croatia (%)
Place of birth for the foreign-born population - Czechoslovakia (%)
Place of birth for the foreign-born population - Hungary (%)
Place of birth for the foreign-born population - Latvia (%)
Place of birth for the foreign-born population - Lithuania (%)
Place of birth for the foreign-born population - North Macedonia (Macedonia) (%)
Place of birth for the foreign-born population - Moldova (%)
Place of birth for the foreign-born population - Poland (%)
Place of birth for the foreign-born population - Romania (%)
Place of birth for the foreign-born population - Russia (%)
Place of birth for the foreign-born population - Serbia (%)
Place of birth for the foreign-born population - Ukraine (%)
Place of birth for the foreign-born population - Other Eastern Europe (%)
Place of birth for the foreign-born population - China (%)
Place of birth for the foreign-born population - Hong Kong (%)
Place of birth for the foreign-born population - Taiwan (%)
Place of birth for the foreign-born population - Japan (%)
Place of birth for the foreign-born population - Korea (%)
Place of birth for the foreign-born population - Other Eastern Asia (%)
Place of birth for the foreign-born population - Afghanistan (%)
Place of birth for the foreign-born population - Bangladesh (%)
Place of birth for the foreign-born population - India (%)
Place of birth for the foreign-born population - Iran (%)
Place of birth for the foreign-born population - Kazakhstan (%)
Place of birth for the foreign-born population - Nepal (%)
Place of birth for the foreign-born population - Pakistan (%)
Place of birth for the foreign-born population - Sri Lanka (%)
Place of birth for the foreign-born population - Uzbekistan (%)
Place of birth for the foreign-born population - Other South Central Asia (%)
Place of birth for the foreign-born population - Burma (%)
Place of birth for the foreign-born population - Cambodia (%)
Place of birth for the foreign-born population - Indonesia (%)
Place of birth for the foreign-born population - Laos (%)
Place of birth for the foreign-born population - Malaysia (%)
Place of birth for the foreign-born population - Philippines (%)
Place of birth for the foreign-born population - Singapore (%)
Place of birth for the foreign-born population - Thailand (%)
Place of birth for the foreign-born population - Vietnam (%)
Place of birth for the foreign-born population - Other South Eastern Asia (%)
Place of birth for the foreign-born population - Armenia (%)
Place of birth for the foreign-born population - Iraq (%)
Place of birth for the foreign-born population - Israel (%)
Place of birth for the foreign-born population - Jordan (%)
Place of birth for the foreign-born population - Kuwait (%)
Place of birth for the foreign-born population - Lebanon (%)
Place of birth for the foreign-born population - Saudi Arabia (%)
Place of birth for the foreign-born population - Syria (%)
Place of birth for the foreign-born population - Turkey (%)
Place of birth for the foreign-born population - Yemen (%)
Place of birth for the foreign-born population - Other Western Asia (%)
Place of birth for the foreign-born population - Eritrea (%)
Place of birth for the foreign-born population - Ethiopia (%)
Place of birth for the foreign-born population - Kenya (%)
Place of birth for the foreign-born population - Somalia (%)
Place of birth for the foreign-born population - Uganda (%)
Place of birth for the foreign-born population - Zimbabwe (%)
Place of birth for the foreign-born population - Other Eastern Africa (%)
Place of birth for the foreign-born population - Cameroon (%)
Place of birth for the foreign-born population - Congo (%)
Place of birth for the foreign-born population - Democratic Republic of Congo (Zaire) (%)
Place of birth for the foreign-born population - Other Middle Africa (%)
Place of birth for the foreign-born population - Egypt (%)
Place of birth for the foreign-born population - Morocco (%)
Place of birth for the foreign-born population - Sudan (%)
Place of birth for the foreign-born population - Other Northern Africa (%)
Place of birth for the foreign-born population - South Africa (%)
Place of birth for the foreign-born population - Other Southern Africa (%)
Place of birth for the foreign-born population - Cabo Verde (%)
Place of birth for the foreign-born population - Ghana (%)
Place of birth for the foreign-born population - Liberia (%)
Place of birth for the foreign-born population - Nigeria (%)
Place of birth for the foreign-born population - Senegal (%)
Place of birth for the foreign-born population - Sierra Leone (%)
Place of birth for the foreign-born population - Other Western Africa (%)
Place of birth for the foreign-born population - Australia (%)
Place of birth for the foreign-born population - New Zealand (%)
Place of birth for the foreign-born population - Fiji (%)
Place of birth for the foreign-born population - Micronesia (%)
Place of birth for the foreign-born population - Bahamas (%)
Place of birth for the foreign-born population - Barbados (%)
Place of birth for the foreign-born population - Cuba (%)
Place of birth for the foreign-born population - Dominica (%)
Place of birth for the foreign-born population - Dominican Republic (%)
Place of birth for the foreign-born population - Grenada (%)
Place of birth for the foreign-born population - Haiti (%)
Place of birth for the foreign-born population - Jamaica (%)
Place of birth for the foreign-born population - St. Vincent and the Grenadines (%)
Place of birth for the foreign-born population - Trinidad and Tobago (%)
Place of birth for the foreign-born population - West Indies (%)
Place of birth for the foreign-born population - Other Caribbean (%)
Place of birth for the foreign-born population - Belize (%)
Place of birth for the foreign-born population - Costa Rica (%)
Place of birth for the foreign-born population - El Salvador (%)
Place of birth for the foreign-born population - Guatemala (%)
Place of birth for the foreign-born population - Honduras (%)
Place of birth for the foreign-born population - Mexico (%)
Place of birth for the foreign-born population - Nicaragua (%)
Place of birth for the foreign-born population - Panama (%)
Place of birth for the foreign-born population - Other Central America (%)
Place of birth for the foreign-born population - Argentina (%)
Place of birth for the foreign-born population - Bolivia (%)
Place of birth for the foreign-born population - Brazil (%)
Place of birth for the foreign-born population - Chile (%)
Place of birth for the foreign-born population - Colombia (%)
Place of birth for the foreign-born population - Ecuador (%)
Place of birth for the foreign-born population - Guyana (%)
Place of birth for the foreign-born population - Peru (%)
Place of birth for the foreign-born population - Uruguay (%)
Place of birth for the foreign-born population - Venezuela (%)
Place of birth for the foreign-born population - Other South America (%)
Place of birth for the foreign-born population - Canada (%)
Place of birth for the foreign-born population - Other Northern America (%)
Place of birth for the foreign-born population - Other (%)
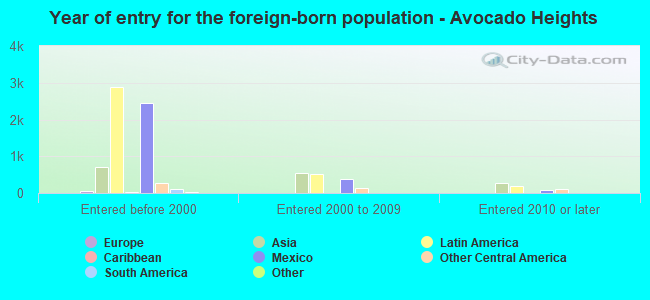
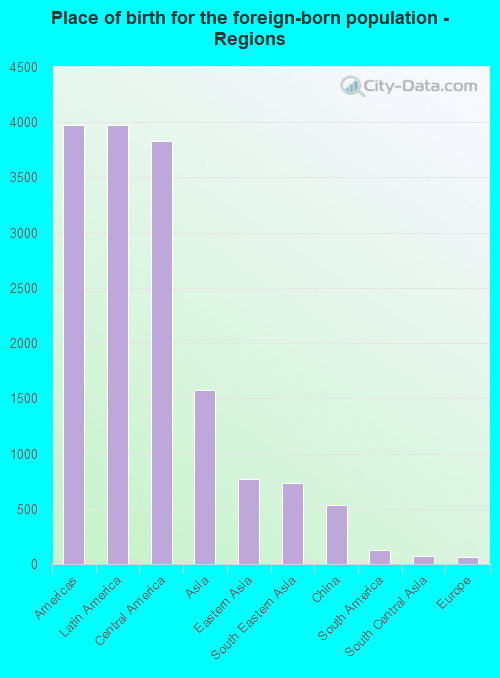
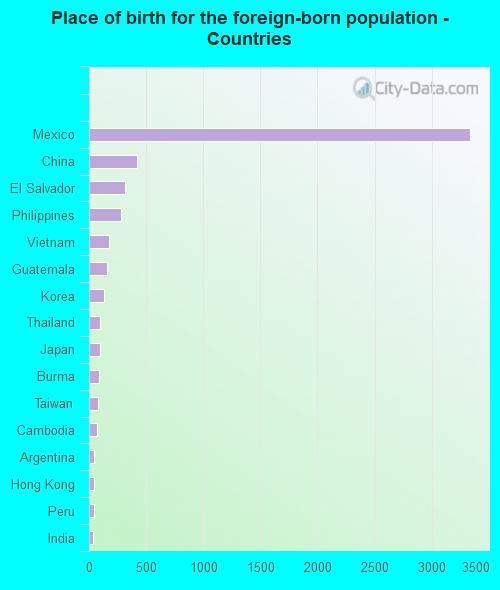
According to 2022 data, the most numerous races in Avocado Heights, CA are Hispanic (12,355 residents), White alone (973 residents), and Asian alone (2,180 residents). 27.2% of Avocado Heights residents speak English at home. 36.8% of Avocado Heights, CA residents are foreign-born (25.4% born in Latin America, 10.1% born in Asia), which is 29.3% greater than the foreign-born rate of 26.0% across the entire state of California.
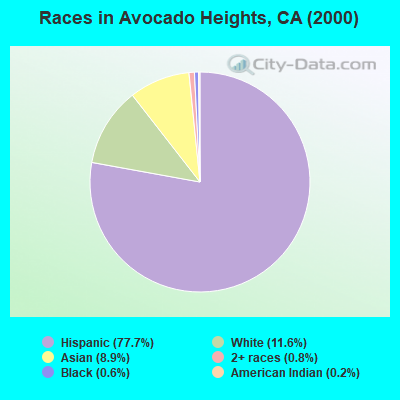
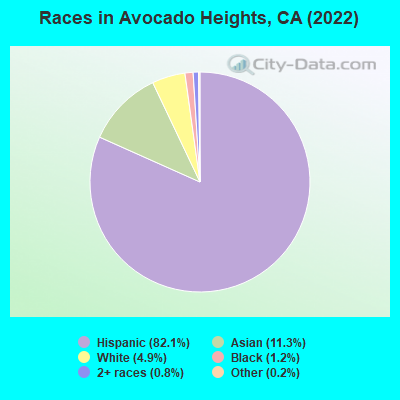
Race distribution in Avocado Heights
2000 2022
15,816,790 46.7% White alone 10,966,556 32.4% Hispanic 3,648,860 10.8% Asian alone 2,181,926 6.4% Black alone 903,115 2.7% Two or more races 178,984 0.5% American Indian alone 103,736 0.3% Native Hawaiian and Other 71,681 0.2% Other race alone
15,732,184 40.3% Hispanic 13,160,426 33.7% White alone 5,957,867 15.3% Asian alone 2,025,218 5.2% Black alone 1,663,222 4.3% Two or more races 251,618 0.6% Other race alone 135,777 0.3% Native Hawaiian and Other 103,030 0.3% American Indian alone
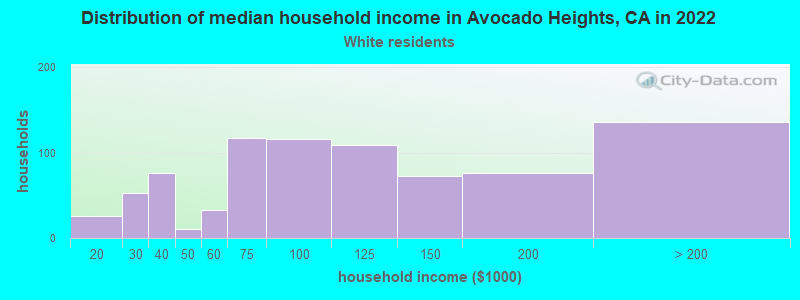
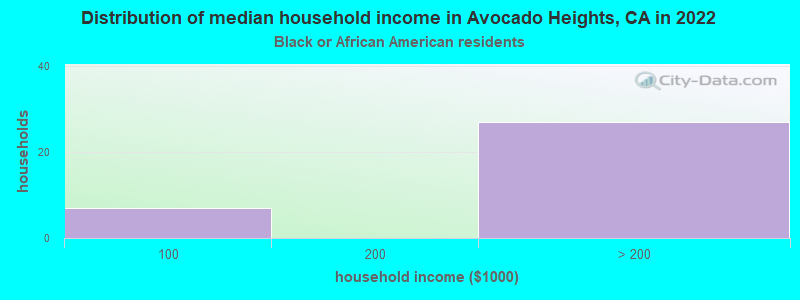
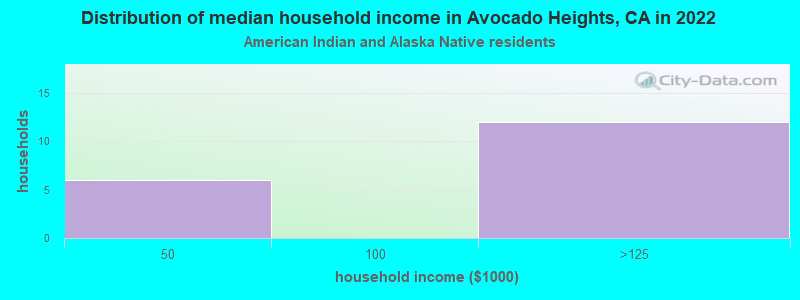
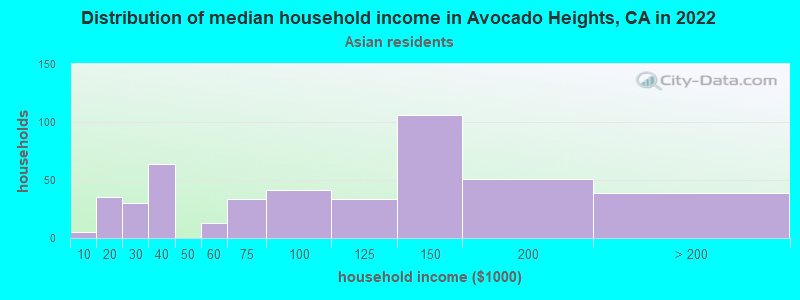
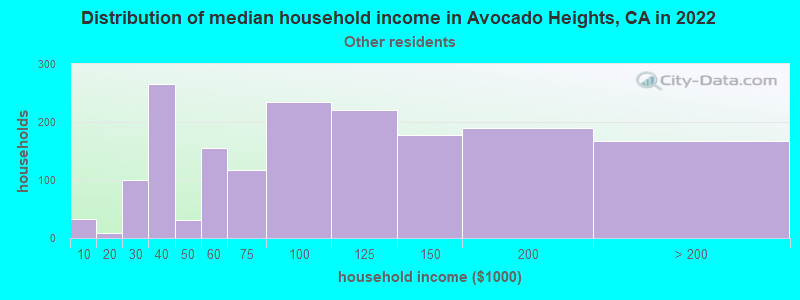
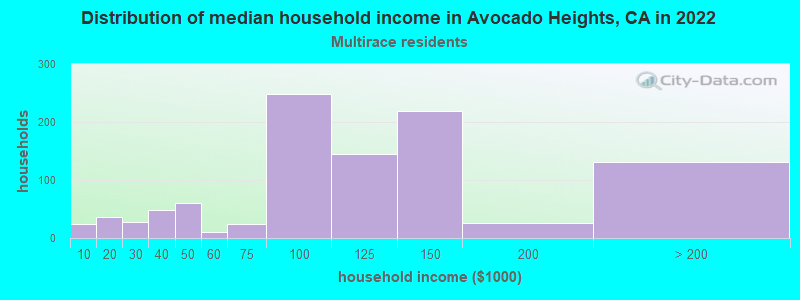
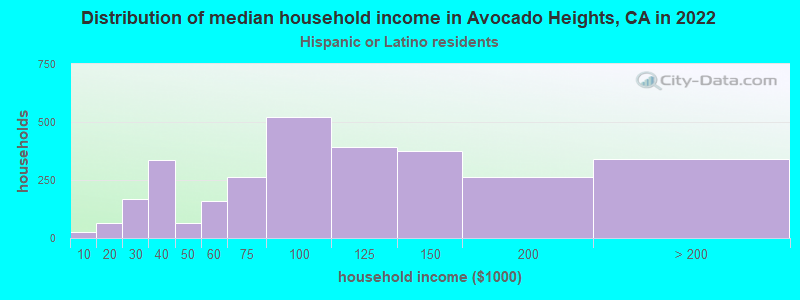
Income and house value in Avocado Heights Median household income in 2022 $102,736 White non-Hispanic householders$56,893 Black householders$42,700 American Indian and Alaska Native householders$98,401 Asian householders$86,459 Native Hawaiian and other Pacific Islander householders$86,852 Some other race householders$162,104 Two or more races householders$105,432 Hispanic or Latino race householdersMedian 2022 house value $646,073 White Non-Hispanic householders$787,525 Black or African American householders $701,142 Asian householders$404,920 Native Hawaiian and other Pacific Islander householders$642,834 Some other race householders$628,077 Two or more races householders$637,435 Hispanic or Latino householders
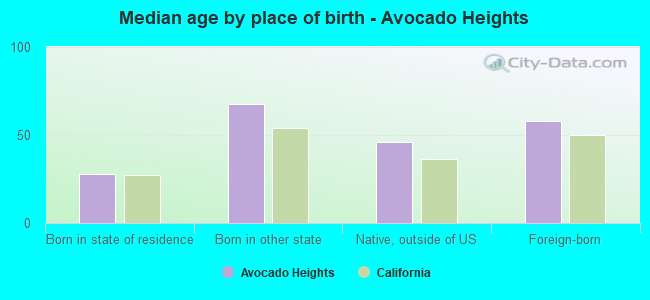
Median age by race in Avocado Heights
44.3 Median age for White residents43.7 44.3 30.9 Median age for Black or African American residents55.9 29.6 23.1 Median age for American Indian / Alaska Native residents49.1 Median age for Asian residents48.8 50.7 36.2 Median age for Other race residents36.6 35.4 32.5 Median age for Two or more races residents24.8 68.6 56.2 Median age for White alone residents52.4 65.4 38.3 Median age for Hispanic or Latino residents38.7 37.7
Owner/renter occupied households by race in Avocado Heights
House owners and renters - White residents 1,264 83.0% Owner occupied259 17.0% Renter occupiedHouse owners and renters - Black or African American residents 23 100.0% Owner occupiedHouse owners and renters - American Indian / Alaska Native residents 20 100.0% Owner occupiedHouse owners and renters - Asian residents 629 88.2% Owner occupied84 11.8% Renter occupiedHouse owners and renters - Other race residents 1,127 65.2% Owner occupied602 34.8% Renter occupiedHouse owners and renters - Two or more races residents 169 100.0% Owner occupiedHouse owners and renters - White alone residents 383 90.4% Owner occupied41 9.6% Renter occupiedHouse owners and renters - Hispanic or Latino residents 2,249 73.1% Owner occupied828 26.9% Renter occupied
Language usage in Avocado Heights
English speakers - Total 27.2% of residents of Avocado Heights speak English at home.
60.3% of residents speak Spanish at home 5,681 64.0% Speak English very well3,200 36.0% Speak English less than very well11.8% of residents speak other language at home 637 36.8% Speak English very well1,095 63.2% Speak English less than very well
English speakers - Born in the United States 59.9% of residents of Avocado Heights speak English at home.
40.2% of residents speak Spanish at home 214 91.1% Speak English very well21 8.9% Speak English less than very well
English speakers - Native, born elsewhere 20.9% of residents of Avocado Heights speak English at home.
79.1% of residents speak Spanish at home 22 41.5% Speak English very well31 58.5% Speak English less than very well
English speakers - Foreign-born 5.1% of residents of Avocado Heights speak English at home.
66.7% of residents speak Spanish at home 1,002 27.2% Speak English very well2,686 72.8% Speak English less than very well26.0% of residents speak other language at home 358 24.9% Speak English very well1,079 75.1% Speak English less than very well
White (Caucasian) - Speak only English Native:
53.6% (1,996)Foreign-born:
9.0% (86)
White (Caucasian) - Speak another language Native:
38.1% (1,419)Foreign-born:
88.4% (845)
American Indian / Alaska Native - Speak another language Native:
100.0% (24)Foreign-born:
99.6% (40)
Asian - Speak only English Native:
65.7% (404)Foreign-born:
8.5% (131)
Asian - Speak another language Native:
34.8% (214)Foreign-born:
91.2% (1,412)
Other race - Speak only English Native:
27.6% (1,241)Foreign-born:
2.3% (61)
Other race - Speak another language Native:
71.9% (3,239)Foreign-born:
96.8% (2,513)
Two or more races - Speak another language Native:
100.0% (641)Foreign-born:
100.0% (666)
White alone - Speak only English Native:
91.9% (808)Foreign-born:
73.7% (59)
White alone - Speak another language Native:
8.2% (72)Foreign-born:
23.5% (19)
Hispanic or Latino - Speak only English Native:
34.0% (2,775)Foreign-born:
2.5% (95)
Hispanic or Latino - Speak another language Native:
65.3% (5,334)Foreign-born:
96.7% (3,615)
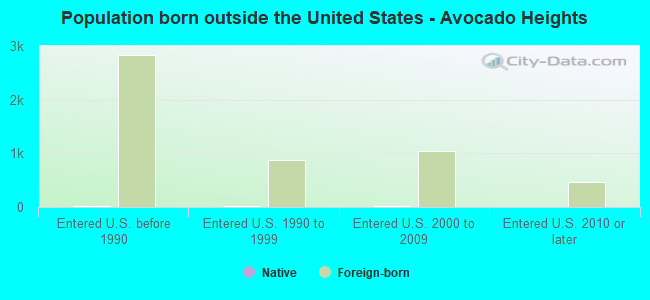
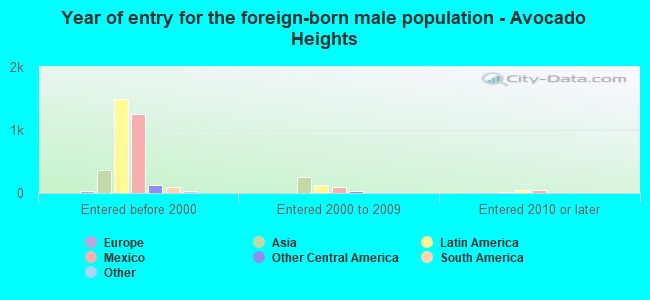
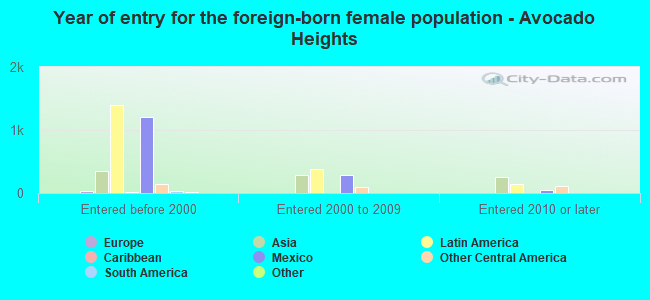
Foreign-born residents in Avocado Heights 5,657 residents are foreign born (25.4% Latin America , 10.1% Asia ).
This city:
36.8%California:
100.0%
Marital status for residents in Avocado Heights Marital status - White (Caucasian) population 15 years and over
Males 36.0% Never married48.5% Now married1.6% Separated3.7% Widowed10.1% DivorcedFemales 36.9% Never married40.9% Now married3.2% Separated10.9% Widowed8.1% DivorcedWomen who gave birth in the past 12 months Now married:
60.9% (30)Unmarried:
39.1% (20)
Women who did not give birth in the past 12 months Now married:
28.8% (310)Unmarried:
71.2% (765)
Marital status - Black or African American population 15 years and over
Males 29.2% Never married37.5% Now married0.0% Separated33.3% Widowed0.0% DivorcedFemales 87.3% Never married0.0% Now married0.0% Separated0.0% Widowed12.7% DivorcedWomen who did not give birth in the past 12 months Now married:
0.0% (0)Unmarried:
100.0% (44)
Marital status - American Indian / Alaska Native population 15 years and over
Males 48.0% Never married28.0% Now married0.0% Separated0.0% Widowed24.0% DivorcedFemales 0.0% Never married100.0% Now married0.0% Separated0.0% Widowed0.0% DivorcedWomen who gave birth in the past 12 months Now married:
100.0% (9)Unmarried:
0.0% (0)
Marital status - Asian population 15 years and over
Males 29.1% Never married67.4% Now married0.2% Separated2.5% Widowed0.8% DivorcedFemales 23.4% Never married65.1% Now married1.9% Separated7.7% Widowed2.0% DivorcedWomen who gave birth in the past 12 months Now married:
100.0% (28)Unmarried:
0.0% (0)
Women who did not give birth in the past 12 months Now married:
66.2% (308)Unmarried:
33.8% (157)
Marital status - Other race population 15 years and over
Males 43.4% Never married47.6% Now married0.6% Separated1.7% Widowed6.6% DivorcedFemales 44.9% Never married43.2% Now married3.0% Separated4.2% Widowed4.6% DivorcedWomen who gave birth in the past 12 months Now married:
100.0% (80)Unmarried:
0.0% (0)
Women who did not give birth in the past 12 months Now married:
38.5% (760)Unmarried:
61.5% (1,212)
Marital status - Two or more races population 15 years and over
Males 57.0% Never married8.6% Now married0.0% Separated0.0% Widowed34.4% DivorcedFemales 41.5% Never married34.3% Now married0.0% Separated2.9% Widowed21.3% DivorcedWomen who gave birth in the past 12 months Now married:
0.0% (0)Unmarried:
100.0% (24)
Women who did not give birth in the past 12 months Now married:
0.0% (0)Unmarried:
100.0% (221)
Marital status - White alone, not Hispanic / Latino population 15 years and over
Males 29.1% Never married50.5% Now married2.9% Separated0.8% Widowed16.7% DivorcedFemales 19.1% Never married46.3% Now married0.0% Separated19.7% Widowed14.9% DivorcedWomen who gave birth in the past 12 months Now married:
100.0% (14)Unmarried:
0.0% (0)
Women who did not give birth in the past 12 months Now married:
20.1% (24)Unmarried:
79.9% (97)
Marital status - Hispanic or Latino population 15 years and over
Males 41.6% Never married46.6% Now married0.9% Separated2.8% Widowed8.1% DivorcedFemales 43.4% Never married41.3% Now married3.3% Separated6.0% Widowed6.0% DivorcedWomen who gave birth in the past 12 months Now married:
75.9% (104)Unmarried:
24.1% (33)
Women who did not give birth in the past 12 months Now married:
34.5% (1,100)Unmarried:
65.5% (2,092)
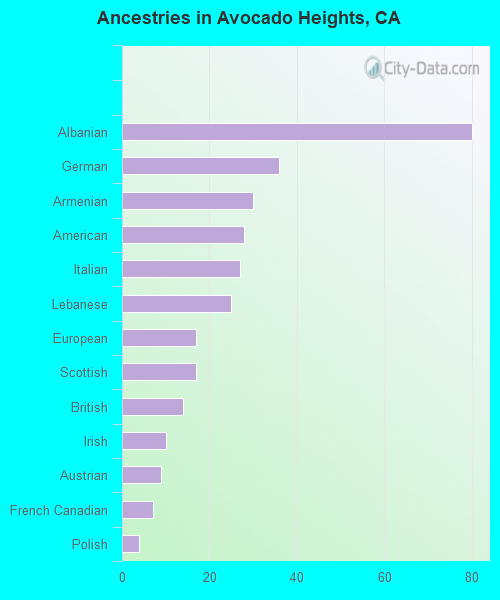
Ancestries in Avocado Heights
92 0.8% German56 0.5% American36 0.3% English33 0.3% British31 0.3% Italian27 0.2% Russian25 0.2% European19 0.2% Irish18 0.2% Austrian11 0.10% French Canadian11 0.10% Norwegian11 0.10% Polish3 0.03% African
Children Nativity (place of birth) in Avocado Heights
Children under 6 years - Living with two parents Both parents native 311 100.0% NativeBoth parents foreign-born 195 100.0% NativeOne native, one foreign-born parent 19 100.0% NativeChildren under 6 years - Living with one parent Native parent 154 100.0% NativeForeign-born parent 84 100.0% NativeChildren 6 to 17 years - Living with two parents Both parents native 399 100.0% NativeBoth parents foreign-born 629 94.1% Native40 5.9% Foreign-bornOne native, one foreign-born parent 189 100.0% NativeChildren 6 to 17 years - Living with one parent Native parent 411 100.0% NativeForeign-born parent 287 50.8% Native279 49.2% Foreign-born
Grandparents responsible for own grandchildren in Avocado Heights
Grandparents (30 to 59 years) White / Caucasian 58 100.0% Not responsible for grandchildrenOther race 19 26.7% Responsible for grandchildren51 73.3% Not responsible for grandchildrenWhite alone, not Hispanic / Latino 4 100.0% Not responsible for grandchildrenHispanic or Latino 15 10.3% Responsible for grandchildren130 89.7% Not responsible for grandchildrenGrandparents (60 years and over) White / Caucasian 18 12.5% Responsible for grandchildren125 87.5% Not responsible for grandchildrenOther race 14 6.0% Responsible for grandchildren214 94.0% Not responsible for grandchildrenWhite alone, not Hispanic / Latino 16 100.0% Not responsible for grandchildrenHispanic or Latino 36 9.8% Responsible for grandchildren327 90.2% Not responsible for grandchildren