Races in Avon, Indiana (IN) Detailed Stats
Data:
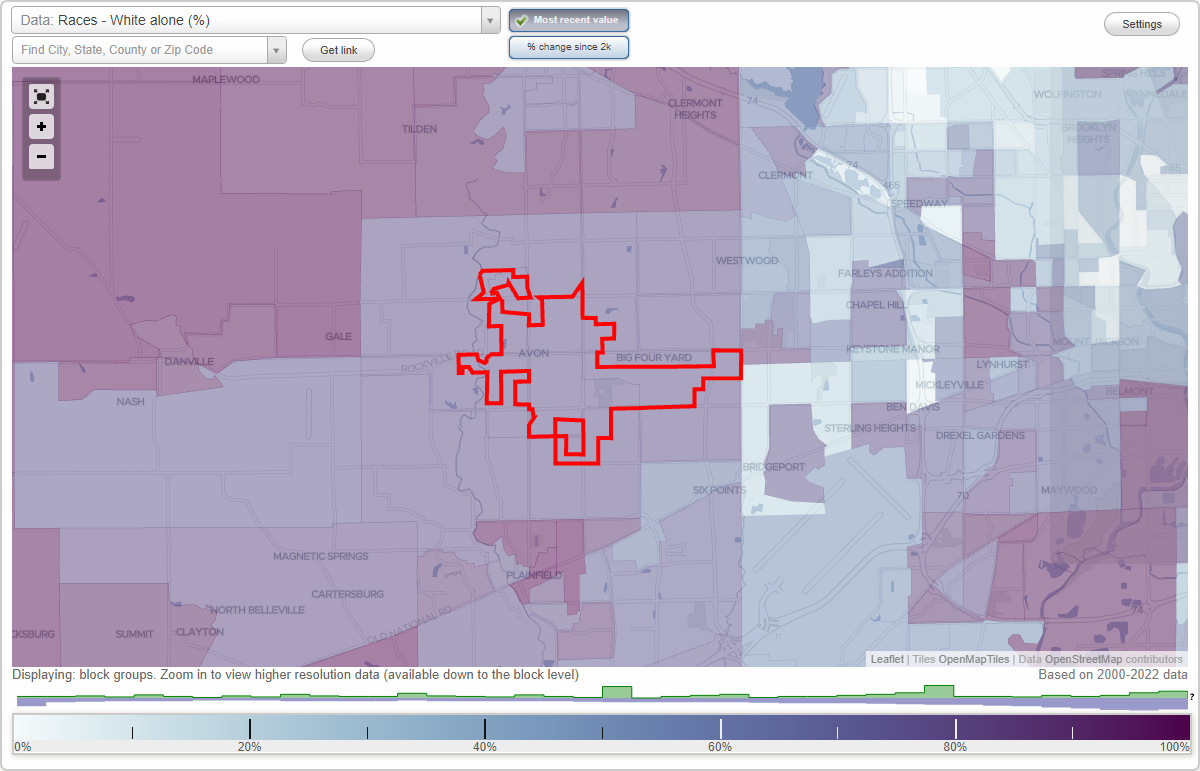
Races - White alone (%)
Races - White alone (% change since 2000)
Races - Black alone (%)
Races - Black alone (% change since 2000)
Races - American Indian alone (%)
Races - American Indian alone (% change since 2000)
Races - Asian alone (%)
Races - Asian alone (% change since 2000)
Races - Hispanic (%)
Races - Hispanic (% change since 2000)
Races - Native Hawaiian and Other Pacific Islander alone (%)
Races - Native Hawaiian and Other Pacific Islander alone (% change since 2000)
Races - Two or more races(%)
Races - Two or more races(% change since 2000)
Races - Other race alone (%)
Races - Other race alone (% change since 2000)
Racial diversity
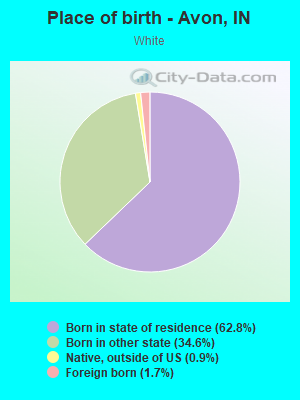
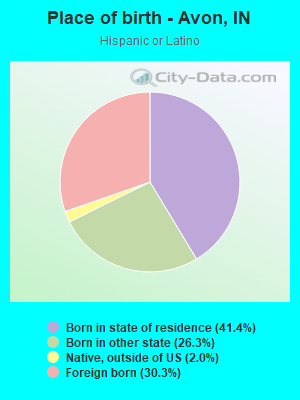
Place of birth - Born in state of residence (%)
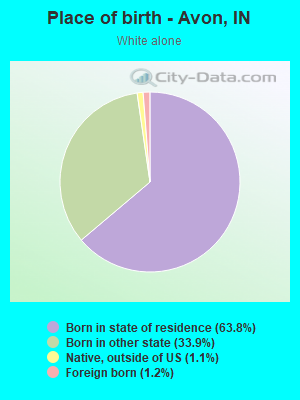
Place of birth - Born in state of residence (%) - White
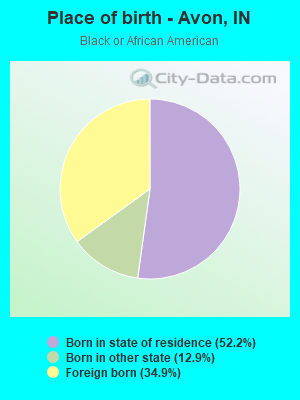
Place of birth - Born in state of residence (%) - Black or African American
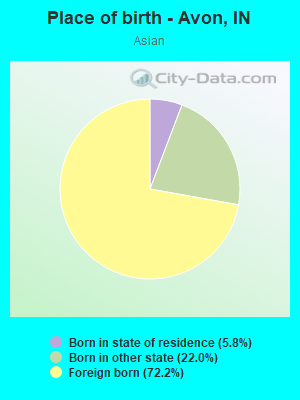
Place of birth - Born in state of residence (%) - Asian
Place of birth - Born in state of residence (%) - Hispanic or Latino
Place of birth - Born in state of residence (%) - American Indian and Alaska Native
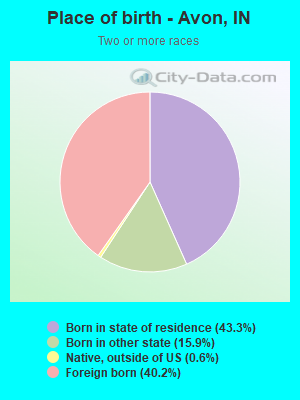
Place of birth - Born in state of residence (%) - Multirace
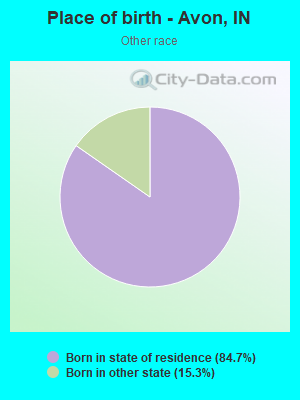
Place of birth - Born in state of residence (%) - Other Race
Place of birth - Born in other state (%)
Place of birth - Born in other state (%) - White
Place of birth - Born in other state (%) - Black or African American
Place of birth - Born in other state (%) - Asian
Place of birth - Born in other state (%) - Hispanic or Latino
Place of birth - Born in other state (%) - American Indian and Alaska Native
Place of birth - Born in other state (%) - Multirace
Place of birth - Born in other state (%) - Other Race
Place of birth - Native, outside of US (%)
Place of birth - Native, outside of US (%) - White
Place of birth - Native, outside of US (%) - Black or African American
Place of birth - Native, outside of US (%) - Asian
Place of birth - Native, outside of US (%) - Hispanic or Latino
Place of birth - Native, outside of US (%) - American Indian and Alaska Native
Place of birth - Native, outside of US (%) - Multirace
Place of birth - Native, outside of US (%) - Other Race
Place of birth - Foreign born (%)
Place of birth - Foreign born (%) - White
Place of birth - Foreign born (%) - Black or African American
Place of birth - Foreign born (%) - Asian
Place of birth - Foreign born (%) - Hispanic or Latino
Place of birth - Foreign born (%) - American Indian and Alaska Native
Place of birth - Foreign born (%) - Multirace
Place of birth - Foreign born (%) - Other Race
Residents speaking English at home (%)
Residents speaking English at home - Born in the United States (%)
Residents speaking English at home - Native, born elsewhere (%)
Residents speaking English at home - Foreign born (%)
Residents speaking Spanish at home (%)
Residents speaking Spanish at home - Born in the United States (%)
Residents speaking Spanish at home - Native, born elsewhere (%)
Residents speaking Spanish at home - Foreign born (%)
Residents speaking other language at home (%)
Residents speaking other language at home - Born in the United States (%)
Residents speaking other language at home - Native, born elsewhere (%)
Residents speaking other language at home - Foreign born (%)
Marital status - Never married (%)
Marital status - Now married (%)
Marital status - Separated (%)
Marital status - Widowed (%)
Marital status - Divorced (%)
Ancestries Reported - Arab (%)
Ancestries Reported - Czech (%)
Ancestries Reported - Danish (%)
Ancestries Reported - Dutch (%)
Ancestries Reported - English (%)
Ancestries Reported - French (%)
Ancestries Reported - French Canadian (%)
Ancestries Reported - German (%)
Ancestries Reported - Greek (%)
Ancestries Reported - Hungarian (%)
Ancestries Reported - Irish (%)
Ancestries Reported - Italian (%)
Ancestries Reported - Lithuanian (%)
Ancestries Reported - Norwegian (%)
Ancestries Reported - Polish (%)
Ancestries Reported - Portuguese (%)
Ancestries Reported - Russian (%)
Ancestries Reported - Scotch-Irish (%)
Ancestries Reported - Scottish (%)
Ancestries Reported - Slovak (%)
Ancestries Reported - Subsaharan African (%)
Ancestries Reported - Swedish (%)
Ancestries Reported - Swiss (%)
Ancestries Reported - Ukrainian (%)
Ancestries Reported - United States (%)
Ancestries Reported - Welsh (%)
Ancestries Reported - West Indian (%)
Ancestries Reported - Other (%)
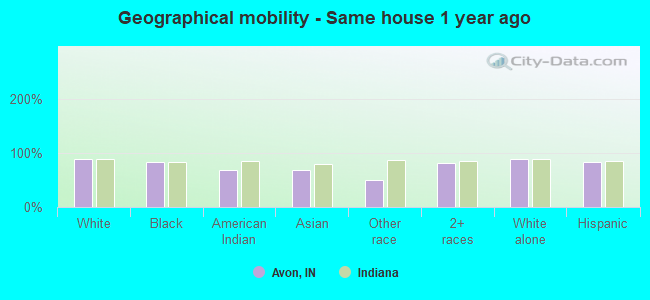
Geographical mobility - Same house 1 year ago (%)
Geographical mobility - Same house 1 year ago (%) - White
Geographical mobility - Same house 1 year ago (%) - Black or African American
Geographical mobility - Same house 1 year ago (%) - Asian
Geographical mobility - Same house 1 year ago (%) - Hispanic or Latino
Geographical mobility - Same house 1 year ago (%) - American Indian and Alaska Native
Geographical mobility - Same house 1 year ago (%) - Multirace
Geographical mobility - Same house 1 year ago (%) - Other Race
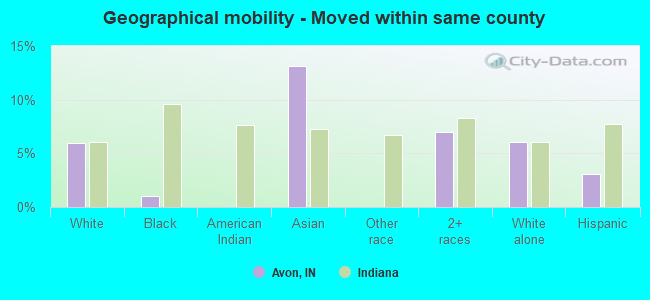
Geographical mobility - Moved within same county (%)
Geographical mobility - Moved within same county (%) - White
Geographical mobility - Moved within same county (%) - Black or African American
Geographical mobility - Moved within same county (%) - Asian
Geographical mobility - Moved within same county (%) - Hispanic or Latino
Geographical mobility - Moved within same county (%) - American Indian and Alaska Native
Geographical mobility - Moved within same county (%) - Multirace
Geographical mobility - Moved within same county (%) - Other Race
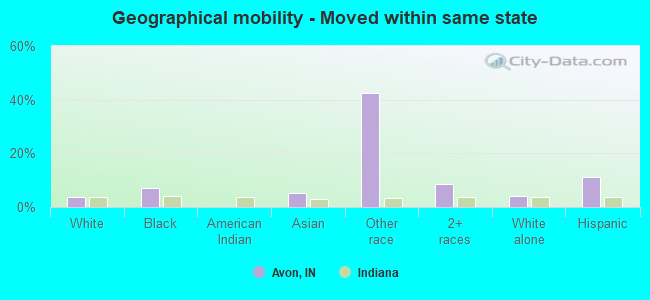
Geographical mobility - Moved from different county within same state (%)
Geographical mobility - Moved from different county within same state (%) - White
Geographical mobility - Moved from different county within same state (%) - Black or African American
Geographical mobility - Moved from different county within same state (%) - Asian
Geographical mobility - Moved from different county within same state (%) - Hispanic or Latino
Geographical mobility - Moved from different county within same state (%) - American Indian and Alaska Native
Geographical mobility - Moved from different county within same state (%) - Multirace
Geographical mobility - Moved from different county within same state (%) - Other Race
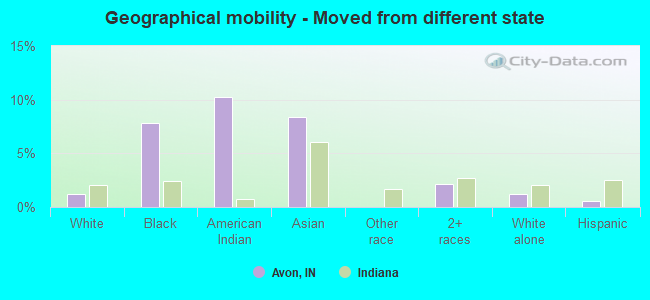
Geographical mobility - Moved from different state (%)
Geographical mobility - Moved from different state (%) - White
Geographical mobility - Moved from different state (%) - Black or African American
Geographical mobility - Moved from different state (%) - Asian
Geographical mobility - Moved from different state (%) - Hispanic or Latino
Geographical mobility - Moved from different state (%) - American Indian and Alaska Native
Geographical mobility - Moved from different state (%) - Multirace
Geographical mobility - Moved from different state (%) - Other Race
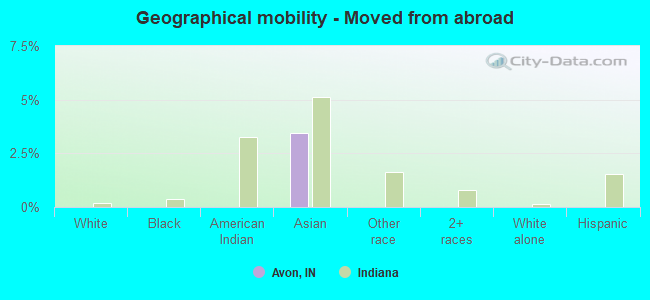
Geographical mobility - Moved from abroad (%)
Geographical mobility - Moved from abroad (%) - White
Geographical mobility - Moved from abroad (%) - Black or African American
Geographical mobility - Moved from abroad (%) - Asian
Geographical mobility - Moved from abroad (%) - Hispanic or Latino
Geographical mobility - Moved from abroad (%) - American Indian and Alaska Native
Geographical mobility - Moved from abroad (%) - Multirace
Geographical mobility - Moved from abroad (%) - Other Race
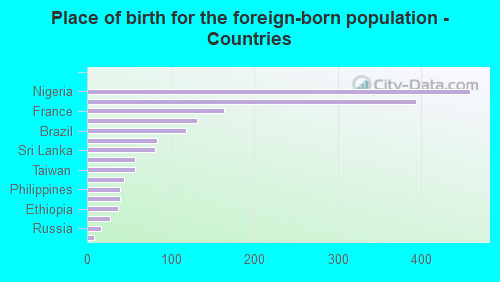
Place of birth for the foreign-born population - Ireland (%)
Place of birth for the foreign-born population - Denmark (%)
Place of birth for the foreign-born population - Norway (%)
Place of birth for the foreign-born population - Sweden (%)
Place of birth for the foreign-born population - United Kingdom (%)
Place of birth for the foreign-born population - England (%)
Place of birth for the foreign-born population - Scotland (%)
Place of birth for the foreign-born population - Other Northern Europe (%)
Place of birth for the foreign-born population - Austria (%)
Place of birth for the foreign-born population - Belgium (%)
Place of birth for the foreign-born population - France (%)
Place of birth for the foreign-born population - Germany (%)
Place of birth for the foreign-born population - Netherlands (%)
Place of birth for the foreign-born population - Switzerland (%)
Place of birth for the foreign-born population - Other Western Europe (%)
Place of birth for the foreign-born population - Greece (%)
Place of birth for the foreign-born population - Italy (%)
Place of birth for the foreign-born population - Portugal (%)
Place of birth for the foreign-born population - Spain (%)
Place of birth for the foreign-born population - Other Southern Europe (%)
Place of birth for the foreign-born population - Albania (%)
Place of birth for the foreign-born population - Belarus (%)
Place of birth for the foreign-born population - Bosnia and Herzegovina (%)
Place of birth for the foreign-born population - Bulgaria (%)
Place of birth for the foreign-born population - Croatia (%)
Place of birth for the foreign-born population - Czechoslovakia (%)
Place of birth for the foreign-born population - Hungary (%)
Place of birth for the foreign-born population - Latvia (%)
Place of birth for the foreign-born population - Lithuania (%)
Place of birth for the foreign-born population - North Macedonia (Macedonia) (%)
Place of birth for the foreign-born population - Moldova (%)
Place of birth for the foreign-born population - Poland (%)
Place of birth for the foreign-born population - Romania (%)
Place of birth for the foreign-born population - Russia (%)
Place of birth for the foreign-born population - Serbia (%)
Place of birth for the foreign-born population - Ukraine (%)
Place of birth for the foreign-born population - Other Eastern Europe (%)
Place of birth for the foreign-born population - China (%)
Place of birth for the foreign-born population - Hong Kong (%)
Place of birth for the foreign-born population - Taiwan (%)
Place of birth for the foreign-born population - Japan (%)
Place of birth for the foreign-born population - Korea (%)
Place of birth for the foreign-born population - Other Eastern Asia (%)
Place of birth for the foreign-born population - Afghanistan (%)
Place of birth for the foreign-born population - Bangladesh (%)
Place of birth for the foreign-born population - India (%)
Place of birth for the foreign-born population - Iran (%)
Place of birth for the foreign-born population - Kazakhstan (%)
Place of birth for the foreign-born population - Nepal (%)
Place of birth for the foreign-born population - Pakistan (%)
Place of birth for the foreign-born population - Sri Lanka (%)
Place of birth for the foreign-born population - Uzbekistan (%)
Place of birth for the foreign-born population - Other South Central Asia (%)
Place of birth for the foreign-born population - Burma (%)
Place of birth for the foreign-born population - Cambodia (%)
Place of birth for the foreign-born population - Indonesia (%)
Place of birth for the foreign-born population - Laos (%)
Place of birth for the foreign-born population - Malaysia (%)
Place of birth for the foreign-born population - Philippines (%)
Place of birth for the foreign-born population - Singapore (%)
Place of birth for the foreign-born population - Thailand (%)
Place of birth for the foreign-born population - Vietnam (%)
Place of birth for the foreign-born population - Other South Eastern Asia (%)
Place of birth for the foreign-born population - Armenia (%)
Place of birth for the foreign-born population - Iraq (%)
Place of birth for the foreign-born population - Israel (%)
Place of birth for the foreign-born population - Jordan (%)
Place of birth for the foreign-born population - Kuwait (%)
Place of birth for the foreign-born population - Lebanon (%)
Place of birth for the foreign-born population - Saudi Arabia (%)
Place of birth for the foreign-born population - Syria (%)
Place of birth for the foreign-born population - Turkey (%)
Place of birth for the foreign-born population - Yemen (%)
Place of birth for the foreign-born population - Other Western Asia (%)
Place of birth for the foreign-born population - Eritrea (%)
Place of birth for the foreign-born population - Ethiopia (%)
Place of birth for the foreign-born population - Kenya (%)
Place of birth for the foreign-born population - Somalia (%)
Place of birth for the foreign-born population - Uganda (%)
Place of birth for the foreign-born population - Zimbabwe (%)
Place of birth for the foreign-born population - Other Eastern Africa (%)
Place of birth for the foreign-born population - Cameroon (%)
Place of birth for the foreign-born population - Congo (%)
Place of birth for the foreign-born population - Democratic Republic of Congo (Zaire) (%)
Place of birth for the foreign-born population - Other Middle Africa (%)
Place of birth for the foreign-born population - Egypt (%)
Place of birth for the foreign-born population - Morocco (%)
Place of birth for the foreign-born population - Sudan (%)
Place of birth for the foreign-born population - Other Northern Africa (%)
Place of birth for the foreign-born population - South Africa (%)
Place of birth for the foreign-born population - Other Southern Africa (%)
Place of birth for the foreign-born population - Cabo Verde (%)
Place of birth for the foreign-born population - Ghana (%)
Place of birth for the foreign-born population - Liberia (%)
Place of birth for the foreign-born population - Nigeria (%)
Place of birth for the foreign-born population - Senegal (%)
Place of birth for the foreign-born population - Sierra Leone (%)
Place of birth for the foreign-born population - Other Western Africa (%)
Place of birth for the foreign-born population - Australia (%)
Place of birth for the foreign-born population - New Zealand (%)
Place of birth for the foreign-born population - Fiji (%)
Place of birth for the foreign-born population - Micronesia (%)
Place of birth for the foreign-born population - Bahamas (%)
Place of birth for the foreign-born population - Barbados (%)
Place of birth for the foreign-born population - Cuba (%)
Place of birth for the foreign-born population - Dominica (%)
Place of birth for the foreign-born population - Dominican Republic (%)
Place of birth for the foreign-born population - Grenada (%)
Place of birth for the foreign-born population - Haiti (%)
Place of birth for the foreign-born population - Jamaica (%)
Place of birth for the foreign-born population - St. Vincent and the Grenadines (%)
Place of birth for the foreign-born population - Trinidad and Tobago (%)
Place of birth for the foreign-born population - West Indies (%)
Place of birth for the foreign-born population - Other Caribbean (%)
Place of birth for the foreign-born population - Belize (%)
Place of birth for the foreign-born population - Costa Rica (%)
Place of birth for the foreign-born population - El Salvador (%)
Place of birth for the foreign-born population - Guatemala (%)
Place of birth for the foreign-born population - Honduras (%)
Place of birth for the foreign-born population - Mexico (%)
Place of birth for the foreign-born population - Nicaragua (%)
Place of birth for the foreign-born population - Panama (%)
Place of birth for the foreign-born population - Other Central America (%)
Place of birth for the foreign-born population - Argentina (%)
Place of birth for the foreign-born population - Bolivia (%)
Place of birth for the foreign-born population - Brazil (%)
Place of birth for the foreign-born population - Chile (%)
Place of birth for the foreign-born population - Colombia (%)
Place of birth for the foreign-born population - Ecuador (%)
Place of birth for the foreign-born population - Guyana (%)
Place of birth for the foreign-born population - Peru (%)
Place of birth for the foreign-born population - Uruguay (%)
Place of birth for the foreign-born population - Venezuela (%)
Place of birth for the foreign-born population - Other South America (%)
Place of birth for the foreign-born population - Canada (%)
Place of birth for the foreign-born population - Other Northern America (%)
Place of birth for the foreign-born population - Other (%)
Latest news about races in Avon, IN collected exclusively by city-data.com from local newspapers, TV, and radio stations
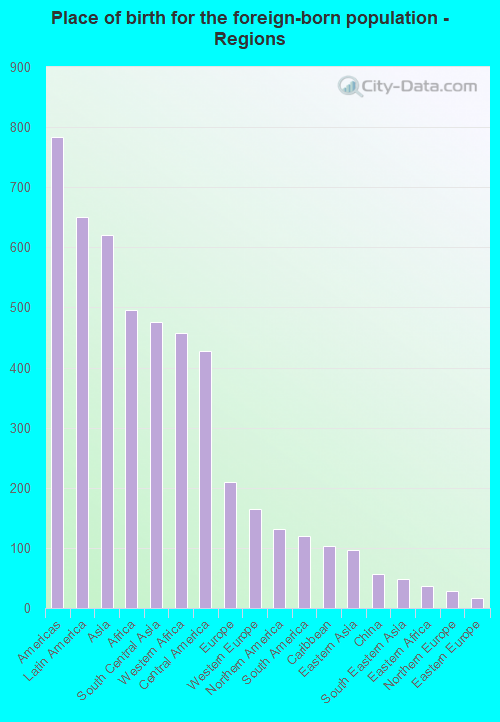
According to 2022 data, the most numerous races in Avon, IN are White alone (15,750 residents), Black alone (3,664 residents), and Hispanic (1,724 residents). 84.3% of Avon residents speak English at home. 9.3% of Avon, IN residents are foreign-born (2.7% born in Latin America, 2.6% born in Asia, 2.1% born in Africa), which is 35.7% greater than the foreign-born rate of 6.0% across the entire state of Indiana.
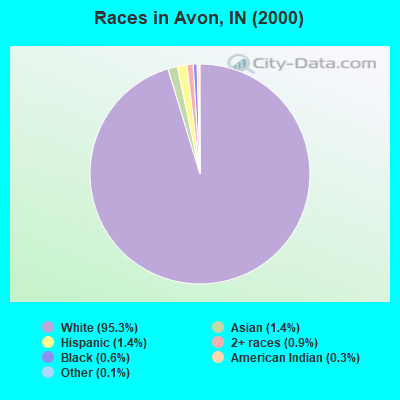
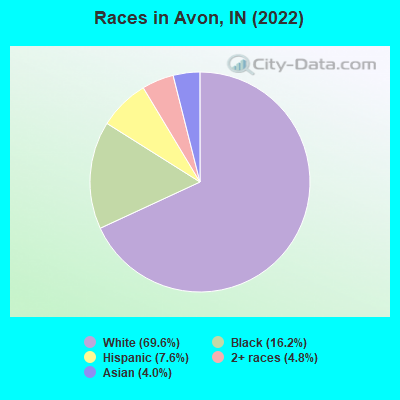
Race distribution in Avon
2000 2022
5,219,373 85.8% White alone 505,462 8.3% Black alone 214,536 3.5% Hispanic 61,115 1.0% Two or more races 58,424 1.0% Asian alone 13,654 0.2% American Indian alone 6,348 0.1% Other race alone 1,573 0.03% Native Hawaiian and Other
5,192,455 76.0% White alone 628,054 9.2% Black alone 534,528 7.8% Hispanic 263,242 3.9% Two or more races 172,880 2.5% Asian alone 33,467 0.5% Other race alone 5,866 0.09% American Indian alone 2,545 0.04% Native Hawaiian and Other
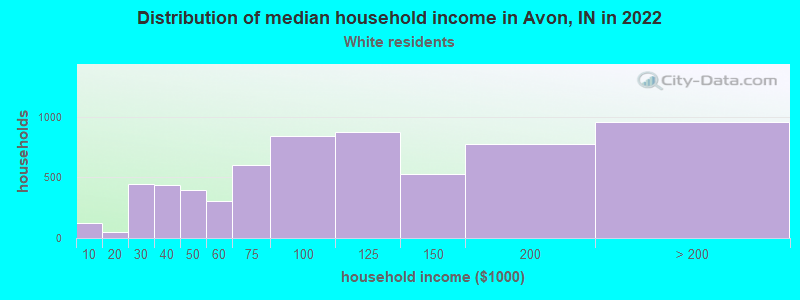
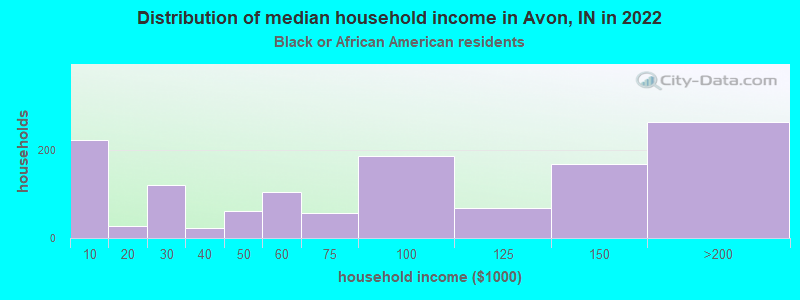
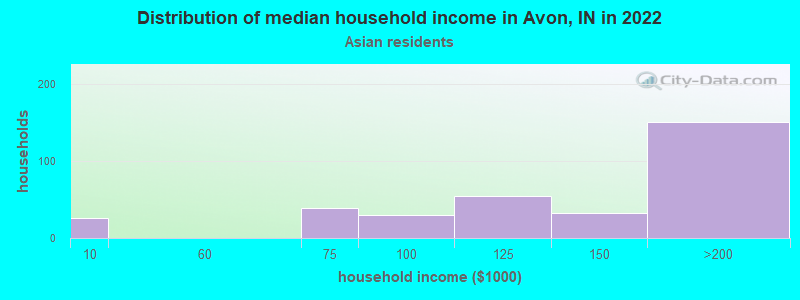
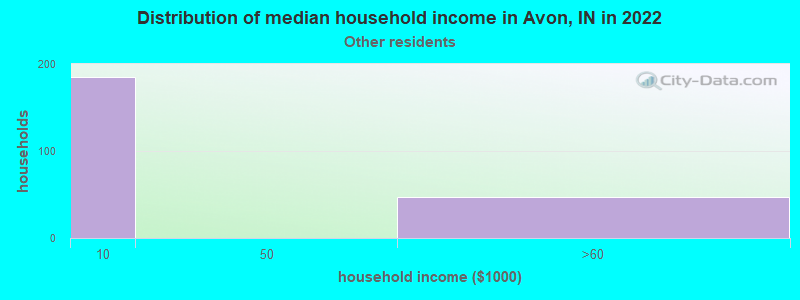
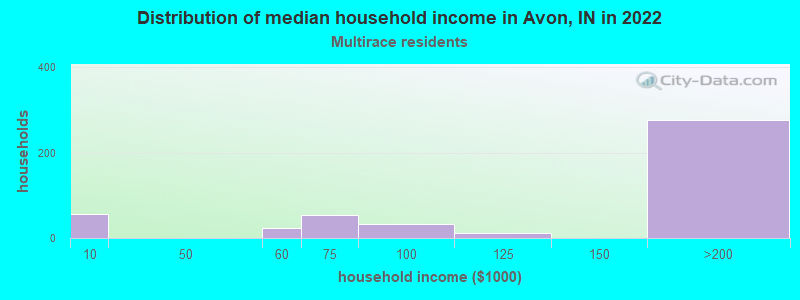
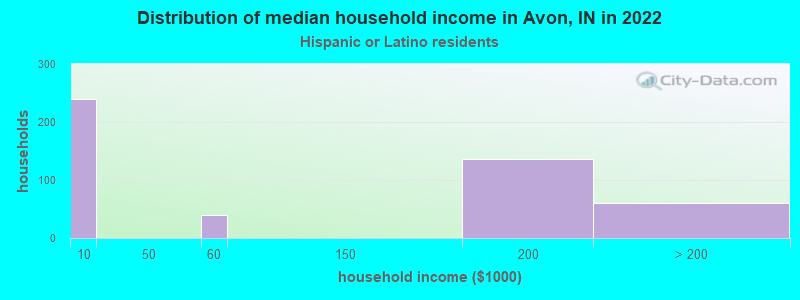
Income and house value in Avon Median household income in 2022 $98,514 White non-Hispanic householders$64,038 Black householders$175,850 Asian householders$175,599 Two or more races householdersMedian 2022 house value $304,753 White Non-Hispanic householders$235,149 Black or African American householders $316,876 Asian householders$188,119 Two or more races householders$235,149 Hispanic or Latino householders
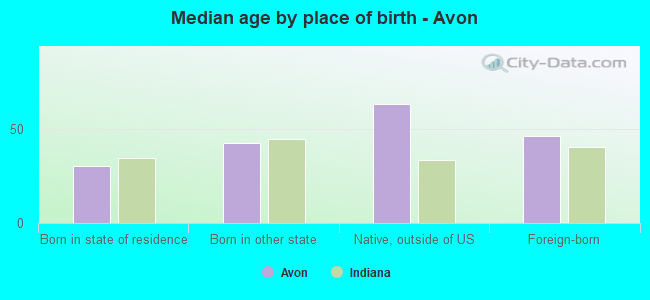
Median age by race in Avon
40.6 Median age for White residents40.1 40.8 38.5 Median age for Black or African American residents32.2 46.1 -558,797,523.8 Median age for American Indian / Alaska Native residents-654,255,318.5 -491,600,353.2 30.0 Median age for Asian residents31.2 26.6 -666,666,666.0 Median age for Native Hawaiian / Pacific Islander residents-666,666,666.0 -666,666,666.0 16.9 Median age for Other race residents6.9 18.7 23.6 Median age for Two or more races residents21.7 27.5 40.5 Median age for White alone residents39.9 40.7 26.0 Median age for Hispanic or Latino residents15.3 37.6
Owner/renter occupied households by race in Avon
House owners and renters - White residents 4,978 79.9% Owner occupied1,251 20.1% Renter occupiedHouse owners and renters - Black or African American residents 639 48.7% Owner occupied673 51.3% Renter occupiedHouse owners and renters - Asian residents 421 95.3% Owner occupied21 4.7% Renter occupiedHouse owners and renters - Other race residents 267 100.0% Renter occupiedHouse owners and renters - Two or more races residents 203 38.4% Owner occupied326 61.6% Renter occupiedHouse owners and renters - White alone residents 4,928 79.3% Owner occupied1,288 20.7% Renter occupiedHouse owners and renters - Hispanic or Latino residents 86 22.8% Owner occupied290 77.2% Renter occupied
Language usage in Avon
English speakers - Total 84.3% of residents of Avon speak English at home.
7.2% of residents speak Spanish at home 1,373 89.9% Speak English very well154 10.1% Speak English less than very well10.9% of residents speak other language at home 1,319 57.0% Speak English very well996 43.0% Speak English less than very well
English speakers - Born in the United States 91.8% of residents of Avon speak English at home.
5.3% of residents speak Spanish at home 325 95.9% Speak English very well14 4.1% Speak English less than very well2.5% of residents speak other language at home 137 83.5% Speak English very well27 16.5% Speak English less than very well
English speakers - Native, born elsewhere 90.4% of residents of Avon speak English at home.
English speakers - Foreign-born 8.5% of residents of Avon speak English at home.
20.9% of residents speak Spanish at home 544 90.7% Speak English very well56 9.3% Speak English less than very well72.9% of residents speak other language at home 1,187 56.7% Speak English very well906 43.3% Speak English less than very well
White (Caucasian) - Speak only English Native:
98.4% (14,692)Foreign-born:
18.3% (49)
White (Caucasian) - Speak another language Native:
1.6% (233)Foreign-born:
63.1% (167)
Black or African American - Speak only English Native:
92.4% (1,767)Foreign-born:
13.2% (164)
Black or African American - Speak another language Native:
5.5% (105)Foreign-born:
87.0% (1,084)
Asian - Speak only English Native:
10.8% (22)Foreign-born:
2.1% (13)
Asian - Speak another language Native:
75.1% (152)Foreign-born:
100.0% (631)
Two or more races - Speak another language Native:
33.7% (442)Foreign-born:
100.0% (1,016)
White alone - Speak only English Native:
99.1% (14,691)Foreign-born:
31.0% (60)
White alone - Speak another language Native:
0.8% (121)Foreign-born:
71.2% (137)
Hispanic or Latino - Speak another language Native:
67.6% (717)Foreign-born:
100.0% (530)
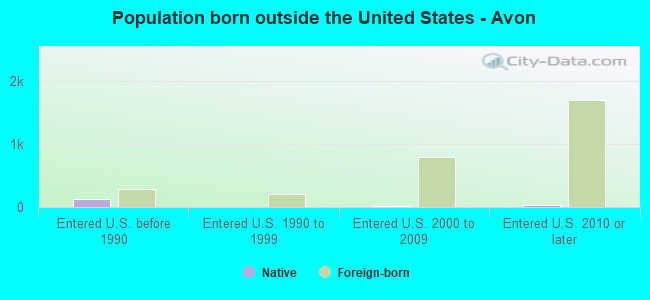
Foreign-born residents in Avon 2,112 residents are foreign born (2.7% Latin America , 2.6% Asia , 2.1% Africa ).
This city:
9.3%Indiana:
5.6%
Marital status for residents in Avon Marital status - White (Caucasian) population 15 years and over
Males 25.2% Never married63.3% Now married0.0% Separated2.0% Widowed9.5% DivorcedFemales 22.3% Never married55.8% Now married0.3% Separated8.8% Widowed12.8% DivorcedWomen who gave birth in the past 12 months Now married:
95.1% (320)Unmarried:
4.9% (16)
Women who did not give birth in the past 12 months Now married:
46.6% (1,693)Unmarried:
53.4% (1,944)
Marital status - Black or African American population 15 years and over
Males 55.9% Never married43.8% Now married0.0% Separated0.0% Widowed0.3% DivorcedFemales 34.9% Never married36.5% Now married0.0% Separated9.4% Widowed19.2% DivorcedWomen who gave birth in the past 12 months Now married:
45.4% (80)Unmarried:
54.6% (96)
Women who did not give birth in the past 12 months Now married:
27.9% (161)Unmarried:
72.1% (417)
Marital status - American Indian / Alaska Native population 15 years and over
Males 0.0% Never married100.0% Now married0.0% Separated0.0% Widowed0.0% DivorcedFemales 0.0% Never married100.0% Now married0.0% Separated0.0% Widowed0.0% DivorcedWomen who did not give birth in the past 12 months Now married:
100.0% (38)Unmarried:
0.0% (0)
Marital status - Asian population 15 years and over
Males 38.0% Never married57.6% Now married0.0% Separated4.4% Widowed0.0% DivorcedFemales 15.8% Never married76.0% Now married8.2% Separated0.0% Widowed0.0% DivorcedWomen who did not give birth in the past 12 months Now married:
80.5% (190)Unmarried:
19.5% (46)
Marital status - Other race population 15 years and over
Males 0.0% Never married100.0% Now married0.0% Separated0.0% Widowed0.0% DivorcedFemales 0.0% Never married13.1% Now married0.0% Separated0.0% Widowed86.9% DivorcedWomen who did not give birth in the past 12 months Now married:
0.0% (0)Unmarried:
100.0% (250)
Marital status - Two or more races population 15 years and over
Males 65.6% Never married34.4% Now married0.0% Separated0.0% Widowed0.0% DivorcedFemales 21.5% Never married55.2% Now married0.0% Separated0.0% Widowed23.3% DivorcedWomen who did not give birth in the past 12 months Now married:
60.2% (246)Unmarried:
39.8% (163)
Marital status - White alone, not Hispanic / Latino population 15 years and over
Males 24.1% Never married64.0% Now married0.0% Separated2.1% Widowed9.7% DivorcedFemales 22.0% Never married55.6% Now married0.3% Separated9.0% Widowed13.1% DivorcedWomen who gave birth in the past 12 months Now married:
95.1% (327)Unmarried:
4.9% (17)
Women who did not give birth in the past 12 months Now married:
46.0% (1,647)Unmarried:
54.0% (1,933)
Marital status - Hispanic or Latino population 15 years and over
Males 59.8% Never married40.2% Now married0.0% Separated0.0% Widowed0.0% DivorcedFemales 8.8% Never married38.4% Now married0.0% Separated0.0% Widowed52.8% DivorcedWomen who did not give birth in the past 12 months Now married:
24.7% (92)Unmarried:
75.3% (281)
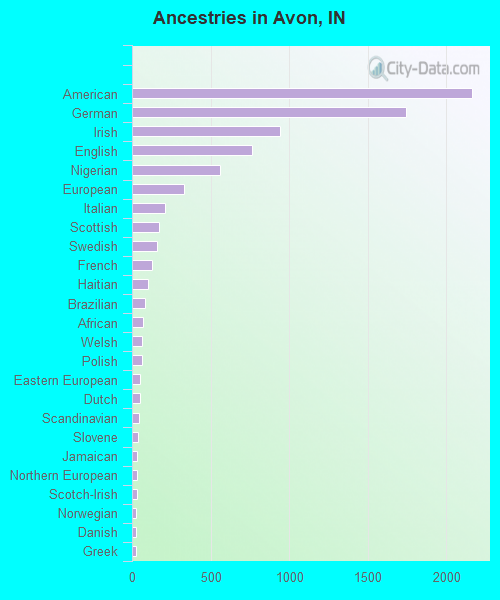
Ancestries in Avon
2,165 20.9% American1,745 16.9% German941 9.1% Irish767 7.4% English560 5.4% Nigerian331 3.2% European211 2.0% Italian173 1.7% Scottish157 1.5% Swedish130 1.3% French103 1.0% Haitian83 0.8% Brazilian69 0.7% African64 0.6% Welsh63 0.6% Polish54 0.5% Eastern European50 0.5% Dutch47 0.5% Scandinavian37 0.4% Slovene35 0.3% Jamaican33 0.3% Northern European32 0.3% Scotch-Irish27 0.3% Norwegian26 0.3% Danish26 0.3% Greek25 0.2% Ethiopian21 0.2% Finnish18 0.2% Slovak17 0.2% Russian14 0.1% British10 0.10% French Canadian
Children Nativity (place of birth) in Avon
Children under 6 years - Living with two parents Both parents native 941 100.0% NativeBoth parents foreign-born 287 100.0% NativeOne native, one foreign-born parent 86 100.0% NativeChildren under 6 years - Living with one parent Native parent 161 100.0% NativeForeign-born parent 26 100.0% NativeChildren 6 to 17 years - Living with two parents Both parents native 2,276 100.0% NativeBoth parents foreign-born 369 74.9% Native124 25.1% Foreign-bornOne native, one foreign-born parent 197 100.0% NativeChildren 6 to 17 years - Living with one parent Native parent 600 100.0% NativeForeign-born parent 203 52.1% Native187 47.9% Foreign-born
Grandparents responsible for own grandchildren in Avon
Grandparents (30 to 59 years) White / Caucasian 10 24.6% Responsible for grandchildren30 75.4% Not responsible for grandchildrenBlack or African American 331 84.0% Responsible for grandchildren63 16.0% Not responsible for grandchildrenWhite alone, not Hispanic / Latino 10 24.1% Responsible for grandchildren32 75.9% Not responsible for grandchildrenGrandparents (60 years and over) White / Caucasian 28 19.9% Responsible for grandchildren114 80.1% Not responsible for grandchildrenBlack or African American 45 100.0% Responsible for grandchildrenWhite alone, not Hispanic / Latino 29 19.8% Responsible for grandchildren116 80.2% Not responsible for grandchildren