Races in Babylon, New York (NY) Detailed Stats
Data:
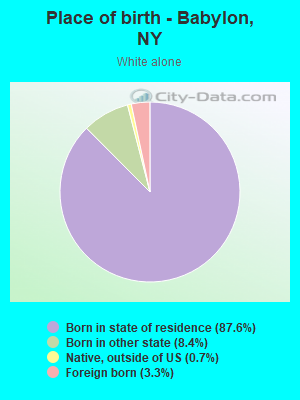
Races - White alone (%)
Races - White alone (% change since 2000)
Races - Black alone (%)
Races - Black alone (% change since 2000)
Races - American Indian alone (%)
Races - American Indian alone (% change since 2000)
Races - Asian alone (%)
Races - Asian alone (% change since 2000)
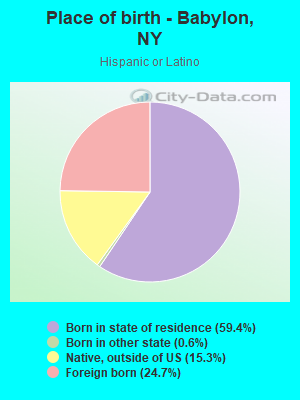
Races - Hispanic (%)
Races - Hispanic (% change since 2000)
Races - Native Hawaiian and Other Pacific Islander alone (%)
Races - Native Hawaiian and Other Pacific Islander alone (% change since 2000)
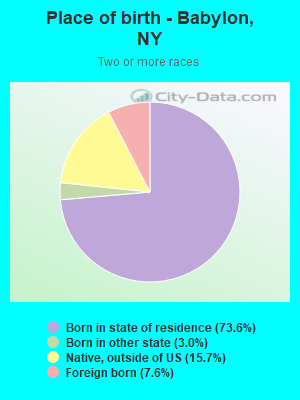
Races - Two or more races(%)
Races - Two or more races(% change since 2000)
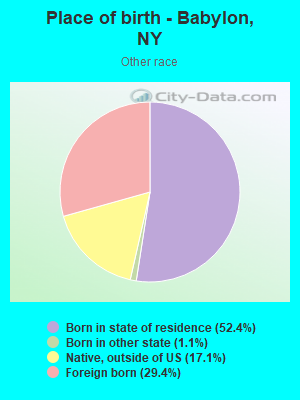
Races - Other race alone (%)
Races - Other race alone (% change since 2000)
Racial diversity
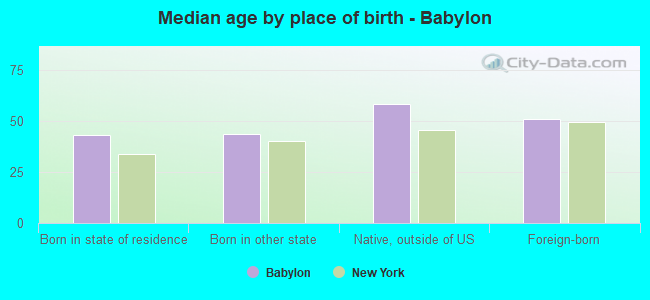
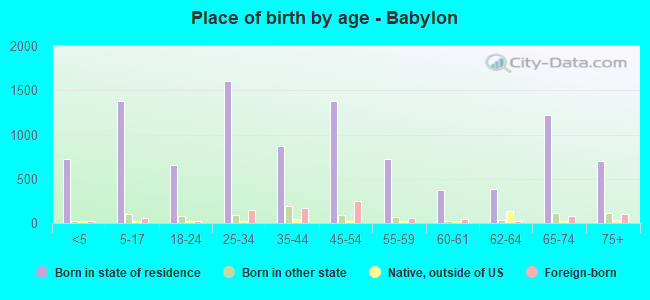
Place of birth - Born in state of residence (%)
Place of birth - Born in state of residence (%) - White
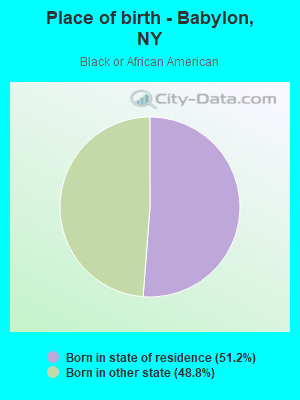
Place of birth - Born in state of residence (%) - Black or African American
Place of birth - Born in state of residence (%) - Asian
Place of birth - Born in state of residence (%) - Hispanic or Latino
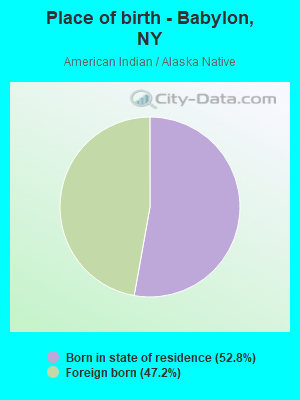
Place of birth - Born in state of residence (%) - American Indian and Alaska Native
Place of birth - Born in state of residence (%) - Multirace
Place of birth - Born in state of residence (%) - Other Race
Place of birth - Born in other state (%)
Place of birth - Born in other state (%) - White
Place of birth - Born in other state (%) - Black or African American
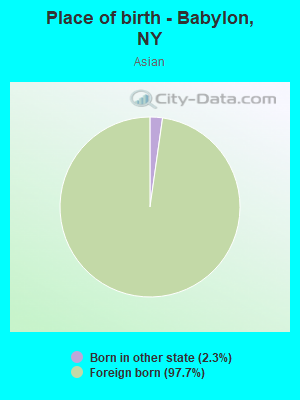
Place of birth - Born in other state (%) - Asian
Place of birth - Born in other state (%) - Hispanic or Latino
Place of birth - Born in other state (%) - American Indian and Alaska Native
Place of birth - Born in other state (%) - Multirace
Place of birth - Born in other state (%) - Other Race
Place of birth - Native, outside of US (%)
Place of birth - Native, outside of US (%) - White
Place of birth - Native, outside of US (%) - Black or African American
Place of birth - Native, outside of US (%) - Asian
Place of birth - Native, outside of US (%) - Hispanic or Latino
Place of birth - Native, outside of US (%) - American Indian and Alaska Native
Place of birth - Native, outside of US (%) - Multirace
Place of birth - Native, outside of US (%) - Other Race
Place of birth - Foreign born (%)
Place of birth - Foreign born (%) - White
Place of birth - Foreign born (%) - Black or African American
Place of birth - Foreign born (%) - Asian
Place of birth - Foreign born (%) - Hispanic or Latino
Place of birth - Foreign born (%) - American Indian and Alaska Native
Place of birth - Foreign born (%) - Multirace
Place of birth - Foreign born (%) - Other Race
Residents speaking English at home (%)
Residents speaking English at home - Born in the United States (%)
Residents speaking English at home - Native, born elsewhere (%)
Residents speaking English at home - Foreign born (%)
Residents speaking Spanish at home (%)
Residents speaking Spanish at home - Born in the United States (%)
Residents speaking Spanish at home - Native, born elsewhere (%)
Residents speaking Spanish at home - Foreign born (%)
Residents speaking other language at home (%)
Residents speaking other language at home - Born in the United States (%)
Residents speaking other language at home - Native, born elsewhere (%)
Residents speaking other language at home - Foreign born (%)
Marital status - Never married (%)
Marital status - Now married (%)
Marital status - Separated (%)
Marital status - Widowed (%)
Marital status - Divorced (%)
Ancestries Reported - Arab (%)
Ancestries Reported - Czech (%)
Ancestries Reported - Danish (%)
Ancestries Reported - Dutch (%)
Ancestries Reported - English (%)
Ancestries Reported - French (%)
Ancestries Reported - French Canadian (%)
Ancestries Reported - German (%)
Ancestries Reported - Greek (%)
Ancestries Reported - Hungarian (%)
Ancestries Reported - Irish (%)
Ancestries Reported - Italian (%)
Ancestries Reported - Lithuanian (%)
Ancestries Reported - Norwegian (%)
Ancestries Reported - Polish (%)
Ancestries Reported - Portuguese (%)
Ancestries Reported - Russian (%)
Ancestries Reported - Scotch-Irish (%)
Ancestries Reported - Scottish (%)
Ancestries Reported - Slovak (%)
Ancestries Reported - Subsaharan African (%)
Ancestries Reported - Swedish (%)
Ancestries Reported - Swiss (%)
Ancestries Reported - Ukrainian (%)
Ancestries Reported - United States (%)
Ancestries Reported - Welsh (%)
Ancestries Reported - West Indian (%)
Ancestries Reported - Other (%)
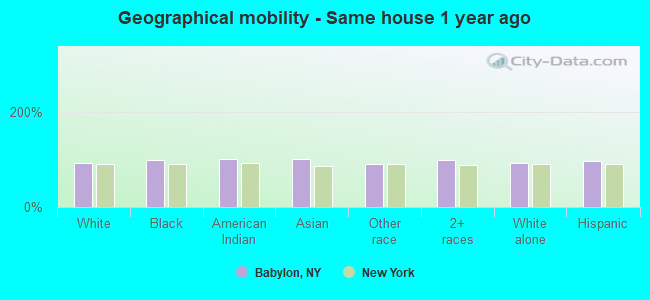
Geographical mobility - Same house 1 year ago (%)
Geographical mobility - Same house 1 year ago (%) - White
Geographical mobility - Same house 1 year ago (%) - Black or African American
Geographical mobility - Same house 1 year ago (%) - Asian
Geographical mobility - Same house 1 year ago (%) - Hispanic or Latino
Geographical mobility - Same house 1 year ago (%) - American Indian and Alaska Native
Geographical mobility - Same house 1 year ago (%) - Multirace
Geographical mobility - Same house 1 year ago (%) - Other Race
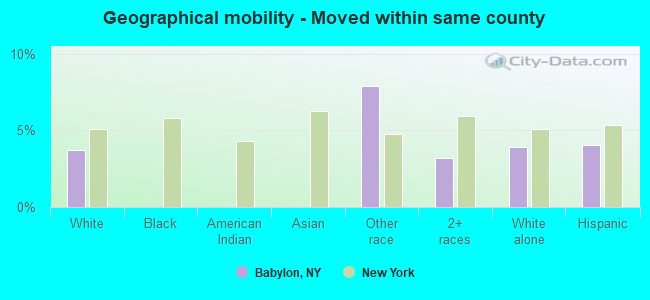
Geographical mobility - Moved within same county (%)
Geographical mobility - Moved within same county (%) - White
Geographical mobility - Moved within same county (%) - Black or African American
Geographical mobility - Moved within same county (%) - Asian
Geographical mobility - Moved within same county (%) - Hispanic or Latino
Geographical mobility - Moved within same county (%) - American Indian and Alaska Native
Geographical mobility - Moved within same county (%) - Multirace
Geographical mobility - Moved within same county (%) - Other Race
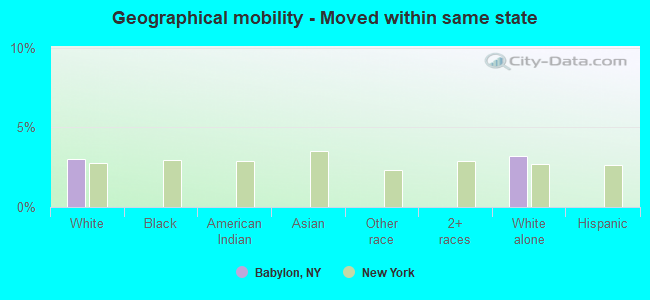
Geographical mobility - Moved from different county within same state (%)
Geographical mobility - Moved from different county within same state (%) - White
Geographical mobility - Moved from different county within same state (%) - Black or African American
Geographical mobility - Moved from different county within same state (%) - Asian
Geographical mobility - Moved from different county within same state (%) - Hispanic or Latino
Geographical mobility - Moved from different county within same state (%) - American Indian and Alaska Native
Geographical mobility - Moved from different county within same state (%) - Multirace
Geographical mobility - Moved from different county within same state (%) - Other Race
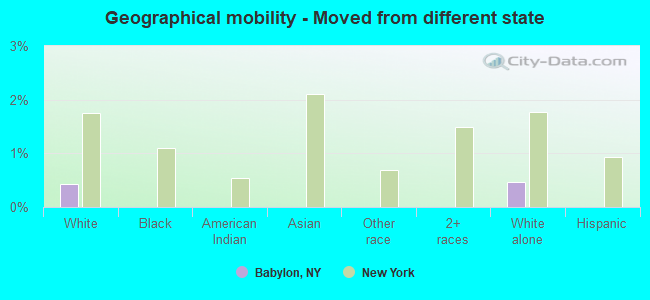
Geographical mobility - Moved from different state (%)
Geographical mobility - Moved from different state (%) - White
Geographical mobility - Moved from different state (%) - Black or African American
Geographical mobility - Moved from different state (%) - Asian
Geographical mobility - Moved from different state (%) - Hispanic or Latino
Geographical mobility - Moved from different state (%) - American Indian and Alaska Native
Geographical mobility - Moved from different state (%) - Multirace
Geographical mobility - Moved from different state (%) - Other Race
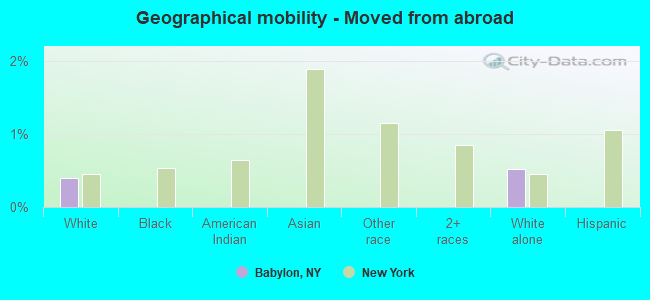
Geographical mobility - Moved from abroad (%)
Geographical mobility - Moved from abroad (%) - White
Geographical mobility - Moved from abroad (%) - Black or African American
Geographical mobility - Moved from abroad (%) - Asian
Geographical mobility - Moved from abroad (%) - Hispanic or Latino
Geographical mobility - Moved from abroad (%) - American Indian and Alaska Native
Geographical mobility - Moved from abroad (%) - Multirace
Geographical mobility - Moved from abroad (%) - Other Race
Place of birth for the foreign-born population - Ireland (%)
Place of birth for the foreign-born population - Denmark (%)
Place of birth for the foreign-born population - Norway (%)
Place of birth for the foreign-born population - Sweden (%)
Place of birth for the foreign-born population - United Kingdom (%)
Place of birth for the foreign-born population - England (%)
Place of birth for the foreign-born population - Scotland (%)
Place of birth for the foreign-born population - Other Northern Europe (%)
Place of birth for the foreign-born population - Austria (%)
Place of birth for the foreign-born population - Belgium (%)
Place of birth for the foreign-born population - France (%)
Place of birth for the foreign-born population - Germany (%)
Place of birth for the foreign-born population - Netherlands (%)
Place of birth for the foreign-born population - Switzerland (%)
Place of birth for the foreign-born population - Other Western Europe (%)
Place of birth for the foreign-born population - Greece (%)
Place of birth for the foreign-born population - Italy (%)
Place of birth for the foreign-born population - Portugal (%)
Place of birth for the foreign-born population - Spain (%)
Place of birth for the foreign-born population - Other Southern Europe (%)
Place of birth for the foreign-born population - Albania (%)
Place of birth for the foreign-born population - Belarus (%)
Place of birth for the foreign-born population - Bosnia and Herzegovina (%)
Place of birth for the foreign-born population - Bulgaria (%)
Place of birth for the foreign-born population - Croatia (%)
Place of birth for the foreign-born population - Czechoslovakia (%)
Place of birth for the foreign-born population - Hungary (%)
Place of birth for the foreign-born population - Latvia (%)
Place of birth for the foreign-born population - Lithuania (%)
Place of birth for the foreign-born population - North Macedonia (Macedonia) (%)
Place of birth for the foreign-born population - Moldova (%)
Place of birth for the foreign-born population - Poland (%)
Place of birth for the foreign-born population - Romania (%)
Place of birth for the foreign-born population - Russia (%)
Place of birth for the foreign-born population - Serbia (%)
Place of birth for the foreign-born population - Ukraine (%)
Place of birth for the foreign-born population - Other Eastern Europe (%)
Place of birth for the foreign-born population - China (%)
Place of birth for the foreign-born population - Hong Kong (%)
Place of birth for the foreign-born population - Taiwan (%)
Place of birth for the foreign-born population - Japan (%)
Place of birth for the foreign-born population - Korea (%)
Place of birth for the foreign-born population - Other Eastern Asia (%)
Place of birth for the foreign-born population - Afghanistan (%)
Place of birth for the foreign-born population - Bangladesh (%)
Place of birth for the foreign-born population - India (%)
Place of birth for the foreign-born population - Iran (%)
Place of birth for the foreign-born population - Kazakhstan (%)
Place of birth for the foreign-born population - Nepal (%)
Place of birth for the foreign-born population - Pakistan (%)
Place of birth for the foreign-born population - Sri Lanka (%)
Place of birth for the foreign-born population - Uzbekistan (%)
Place of birth for the foreign-born population - Other South Central Asia (%)
Place of birth for the foreign-born population - Burma (%)
Place of birth for the foreign-born population - Cambodia (%)
Place of birth for the foreign-born population - Indonesia (%)
Place of birth for the foreign-born population - Laos (%)
Place of birth for the foreign-born population - Malaysia (%)
Place of birth for the foreign-born population - Philippines (%)
Place of birth for the foreign-born population - Singapore (%)
Place of birth for the foreign-born population - Thailand (%)
Place of birth for the foreign-born population - Vietnam (%)
Place of birth for the foreign-born population - Other South Eastern Asia (%)
Place of birth for the foreign-born population - Armenia (%)
Place of birth for the foreign-born population - Iraq (%)
Place of birth for the foreign-born population - Israel (%)
Place of birth for the foreign-born population - Jordan (%)
Place of birth for the foreign-born population - Kuwait (%)
Place of birth for the foreign-born population - Lebanon (%)
Place of birth for the foreign-born population - Saudi Arabia (%)
Place of birth for the foreign-born population - Syria (%)
Place of birth for the foreign-born population - Turkey (%)
Place of birth for the foreign-born population - Yemen (%)
Place of birth for the foreign-born population - Other Western Asia (%)
Place of birth for the foreign-born population - Eritrea (%)
Place of birth for the foreign-born population - Ethiopia (%)
Place of birth for the foreign-born population - Kenya (%)
Place of birth for the foreign-born population - Somalia (%)
Place of birth for the foreign-born population - Uganda (%)
Place of birth for the foreign-born population - Zimbabwe (%)
Place of birth for the foreign-born population - Other Eastern Africa (%)
Place of birth for the foreign-born population - Cameroon (%)
Place of birth for the foreign-born population - Congo (%)
Place of birth for the foreign-born population - Democratic Republic of Congo (Zaire) (%)
Place of birth for the foreign-born population - Other Middle Africa (%)
Place of birth for the foreign-born population - Egypt (%)
Place of birth for the foreign-born population - Morocco (%)
Place of birth for the foreign-born population - Sudan (%)
Place of birth for the foreign-born population - Other Northern Africa (%)
Place of birth for the foreign-born population - South Africa (%)
Place of birth for the foreign-born population - Other Southern Africa (%)
Place of birth for the foreign-born population - Cabo Verde (%)
Place of birth for the foreign-born population - Ghana (%)
Place of birth for the foreign-born population - Liberia (%)
Place of birth for the foreign-born population - Nigeria (%)
Place of birth for the foreign-born population - Senegal (%)
Place of birth for the foreign-born population - Sierra Leone (%)
Place of birth for the foreign-born population - Other Western Africa (%)
Place of birth for the foreign-born population - Australia (%)
Place of birth for the foreign-born population - New Zealand (%)
Place of birth for the foreign-born population - Fiji (%)
Place of birth for the foreign-born population - Micronesia (%)
Place of birth for the foreign-born population - Bahamas (%)
Place of birth for the foreign-born population - Barbados (%)
Place of birth for the foreign-born population - Cuba (%)
Place of birth for the foreign-born population - Dominica (%)
Place of birth for the foreign-born population - Dominican Republic (%)
Place of birth for the foreign-born population - Grenada (%)
Place of birth for the foreign-born population - Haiti (%)
Place of birth for the foreign-born population - Jamaica (%)
Place of birth for the foreign-born population - St. Vincent and the Grenadines (%)
Place of birth for the foreign-born population - Trinidad and Tobago (%)
Place of birth for the foreign-born population - West Indies (%)
Place of birth for the foreign-born population - Other Caribbean (%)
Place of birth for the foreign-born population - Belize (%)
Place of birth for the foreign-born population - Costa Rica (%)
Place of birth for the foreign-born population - El Salvador (%)
Place of birth for the foreign-born population - Guatemala (%)
Place of birth for the foreign-born population - Honduras (%)
Place of birth for the foreign-born population - Mexico (%)
Place of birth for the foreign-born population - Nicaragua (%)
Place of birth for the foreign-born population - Panama (%)
Place of birth for the foreign-born population - Other Central America (%)
Place of birth for the foreign-born population - Argentina (%)
Place of birth for the foreign-born population - Bolivia (%)
Place of birth for the foreign-born population - Brazil (%)
Place of birth for the foreign-born population - Chile (%)
Place of birth for the foreign-born population - Colombia (%)
Place of birth for the foreign-born population - Ecuador (%)
Place of birth for the foreign-born population - Guyana (%)
Place of birth for the foreign-born population - Peru (%)
Place of birth for the foreign-born population - Uruguay (%)
Place of birth for the foreign-born population - Venezuela (%)
Place of birth for the foreign-born population - Other South America (%)
Place of birth for the foreign-born population - Canada (%)
Place of birth for the foreign-born population - Other Northern America (%)
Place of birth for the foreign-born population - Other (%)
Latest news about races in Babylon, NY collected exclusively by city-data.com from local newspapers, TV, and radio stations
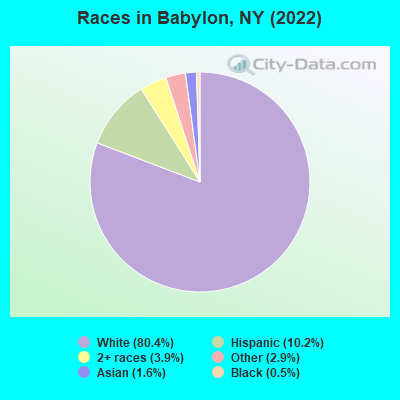
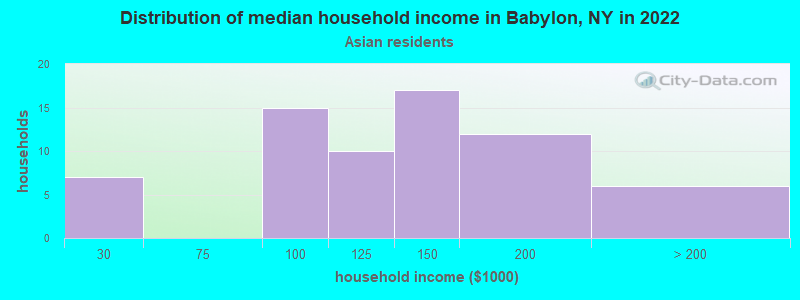
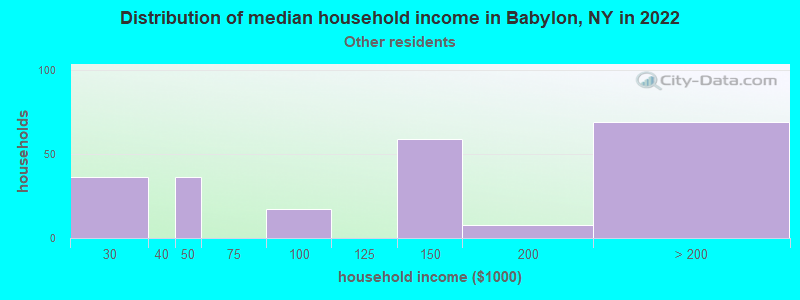
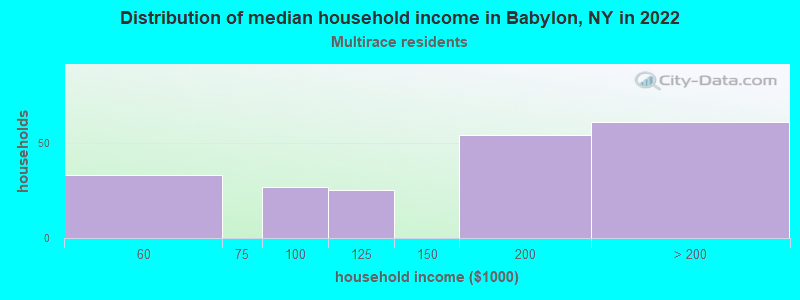
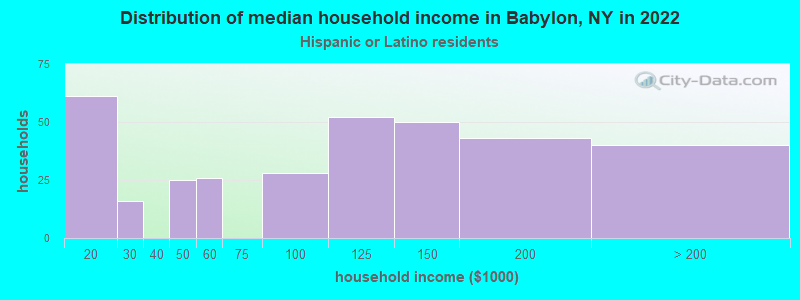
According to 2022 data, the most numerous races in Babylon, NY are White alone (9,801 residents), Hispanic (1,247 residents), and Black alone (67 residents). 86.6% of Babylon residents speak English at home. 7.0% of Babylon, NY residents are foreign-born (3.0% born in Latin America, 1.7% born in Asia, 1.6% born in Europe, 0.7% born in North America), which is 214.1% less than the foreign-born rate of 22.0% across the entire state of New York.
Race distribution in Babylon
2000 2022
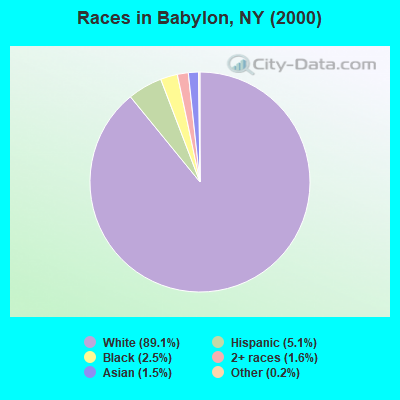
11,760,981 62.0% White alone 2,867,583 15.1% Hispanic 2,812,623 14.8% Black alone 1,035,926 5.5% Asian alone 366,116 1.9% Two or more races 75,499 0.4% Other race alone 52,499 0.3% American Indian alone 5,230 0.03% Native Hawaiian and Other
10,408,933 52.9% White alone 3,867,299 19.7% Hispanic 2,633,840 13.4% Black alone 1,776,286 9.0% Asian alone 732,670 3.7% Two or more races 216,110 1.1% Other race alone 35,082 0.2% American Indian alone 6,931 0.04% Native Hawaiian and Other
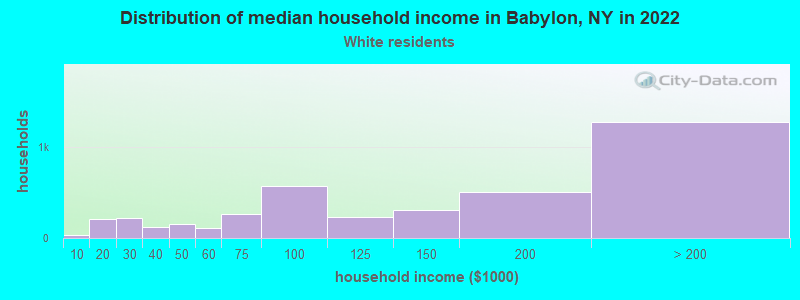
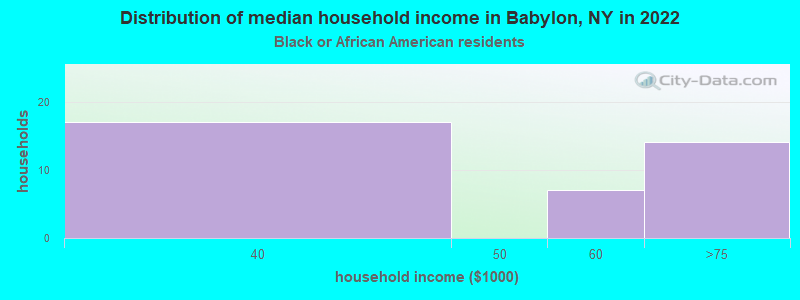
Income and house value in Babylon Median household income in 2022 $135,904 White non-Hispanic householders$60,553 Black householders$116,329 Asian householders$146,983 Some other race householders$162,277 Two or more races householders$96,885 Hispanic or Latino race householdersMedian 2022 house value $667,920 White Non-Hispanic householders$537,103 Black or African American householders $864,774 Asian householders$622,322 Some other race householders$622,322 Two or more races householders$572,008 Hispanic or Latino householders
Median age by race in Babylon
47.7 Median age for White residents47.6 47.4 59.8 Median age for Black or African American residents-660,784,313.1 59.5 35.2 Median age for American Indian / Alaska Native residents28.2 -513,692,161.9 44.8 Median age for Asian residents63.0 44.2 -742,816,091.2 Median age for Native Hawaiian / Pacific Islander residents-831,187,409.8 -771,300,447.7 33.1 Median age for Other race residents32.7 33.7 43.5 Median age for Two or more races residents25.6 60.2 47.7 Median age for White alone residents48.0 47.0 35.4 Median age for Hispanic or Latino residents29.9 41.5
Owner/renter occupied households by race in Babylon
House owners and renters - White residents 3,217 80.7% Owner occupied769 19.3% Renter occupiedHouse owners and renters - Black or African American residents 21 57.4% Owner occupied16 42.6% Renter occupiedHouse owners and renters - American Indian / Alaska Native residents 40 100.0% Renter occupiedHouse owners and renters - Asian residents 50 72.4% Owner occupied19 27.6% Renter occupiedHouse owners and renters - Other race residents 212 89.1% Owner occupied26 10.9% Renter occupiedHouse owners and renters - Two or more races residents 110 54.6% Owner occupied91 45.4% Renter occupiedHouse owners and renters - White alone residents 3,177 79.6% Owner occupied813 20.4% Renter occupiedHouse owners and renters - Hispanic or Latino residents 259 69.8% Owner occupied112 30.2% Renter occupied
Language usage in Babylon
English speakers - Total 86.6% of residents of Babylon speak English at home.
5.8% of residents speak Spanish at home 476 71.2% Speak English very well193 28.8% Speak English less than very well6.6% of residents speak other language at home 579 77.0% Speak English very well173 23.0% Speak English less than very well
English speakers - Born in the United States 97.1% of residents of Babylon speak English at home.
3.8% of residents speak other language at home 34 100.0% Speak English very well
English speakers - Native, born elsewhere 26.4% of residents of Babylon speak English at home.
59.2% of residents speak Spanish at home 68 43.3% Speak English very well89 56.7% Speak English less than very well8.3% of residents speak other language at home 22 100.0% Speak English very well
English speakers - Foreign-born 31.4% of residents of Babylon speak English at home.
20.7% of residents speak Spanish at home 119 62.0% Speak English very well73 38.0% Speak English less than very well44.3% of residents speak other language at home 267 65.0% Speak English very well144 35.0% Speak English less than very well
White (Caucasian) - Speak only English Native:
97.2% (8,887)Foreign-born:
47.3% (156)
White (Caucasian) - Speak another language Native:
3.4% (315)Foreign-born:
58.1% (192)
American Indian / Alaska Native - Speak another language Native:
100.0% (37)Foreign-born:
100.0% (66)
Asian - Speak another language Native:
100.0% (6)Foreign-born:
83.9% (148)
Other race - Speak only English Native:
46.2% (160)Foreign-born:
37.5% (75)
Other race - Speak another language Native:
54.6% (189)Foreign-born:
55.7% (111)
Two or more races - Speak only English Native:
72.0% (403)Foreign-born:
32.4% (17)
Two or more races - Speak another language Native:
28.3% (158)Foreign-born:
64.9% (34)
White alone - Speak only English Native:
96.0% (8,693)Foreign-born:
36.8% (120)
White alone - Speak another language Native:
4.0% (358)Foreign-born:
63.2% (207)
Hispanic or Latino - Speak only English Native:
56.2% (447)Foreign-born:
35.7% (108)
Hispanic or Latino - Speak another language Native:
44.2% (352)Foreign-born:
61.5% (186)
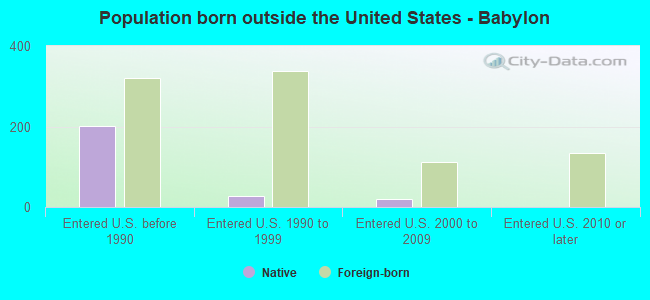
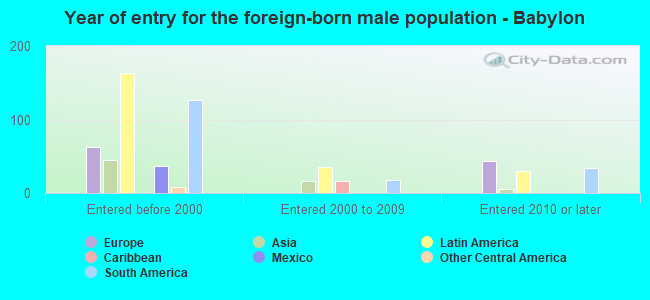
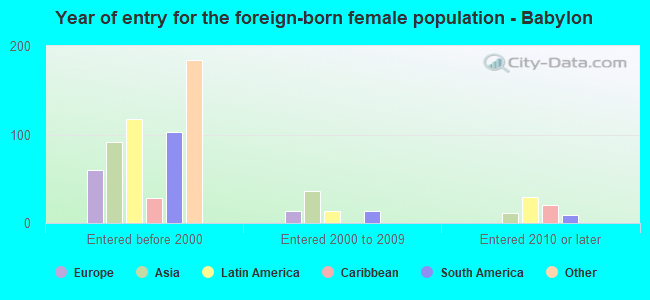
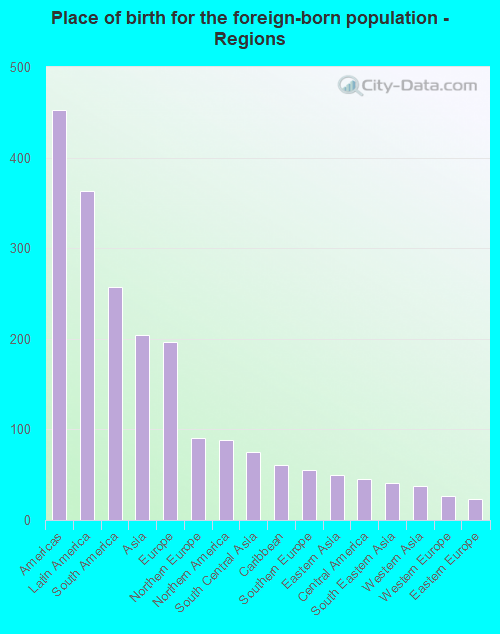
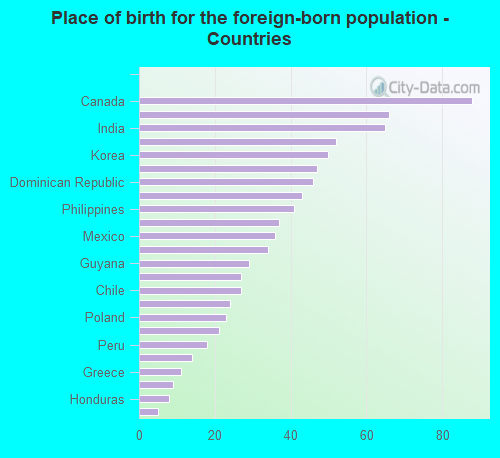
Foreign-born residents in Babylon 854 residents are foreign born (3.0% Latin America , 1.7% Asia , 1.6% Europe , 0.7% North America ).
This city:
7.0%New York:
22.6%
Marital status for residents in Babylon Marital status - White (Caucasian) population 15 years and over
Males 31.5% Never married57.3% Now married0.7% Separated4.1% Widowed6.4% DivorcedFemales 23.1% Never married52.9% Now married0.6% Separated12.7% Widowed10.6% DivorcedWomen who gave birth in the past 12 months Now married:
100.0% (109)Unmarried:
0.0% (0)
Women who did not give birth in the past 12 months Now married:
51.3% (1,032)Unmarried:
48.7% (979)
Marital status - American Indian / Alaska Native population 15 years and over
Males 46.9% Never married53.1% Now married0.0% Separated0.0% Widowed0.0% DivorcedFemales 0.0% Never married44.4% Now married0.0% Separated55.6% Widowed0.0% DivorcedWomen who did not give birth in the past 12 months Now married:
100.0% (17)Unmarried:
0.0% (0)
Marital status - Asian population 15 years and over
Males 30.4% Never married69.6% Now married0.0% Separated0.0% Widowed0.0% DivorcedFemales 9.7% Never married83.1% Now married0.0% Separated7.3% Widowed0.0% DivorcedWomen who did not give birth in the past 12 months Now married:
85.5% (74)Unmarried:
14.5% (12)
Marital status - Other race population 15 years and over
Males 15.5% Never married84.5% Now married0.0% Separated0.0% Widowed0.0% DivorcedFemales 15.2% Never married65.5% Now married0.0% Separated19.3% Widowed0.0% DivorcedWomen who gave birth in the past 12 months Now married:
100.0% (71)Unmarried:
0.0% (0)
Women who did not give birth in the past 12 months Now married:
65.1% (60)Unmarried:
34.9% (32)
Marital status - Two or more races population 15 years and over
Males 37.1% Never married40.0% Now married13.6% Separated0.0% Widowed9.3% DivorcedFemales 20.5% Never married72.1% Now married0.0% Separated0.0% Widowed7.4% DivorcedWomen who did not give birth in the past 12 months Now married:
20.6% (20)Unmarried:
79.4% (79)
Marital status - White alone, not Hispanic / Latino population 15 years and over
Males 32.2% Never married56.5% Now married0.7% Separated4.4% Widowed6.2% DivorcedFemales 23.8% Never married53.1% Now married0.6% Separated11.8% Widowed10.6% DivorcedWomen who gave birth in the past 12 months Now married:
100.0% (100)Unmarried:
0.0% (0)
Women who did not give birth in the past 12 months Now married:
50.6% (1,048)Unmarried:
49.4% (1,025)
Marital status - Hispanic or Latino population 15 years and over
Males 19.0% Never married67.7% Now married4.4% Separated0.0% Widowed8.9% DivorcedFemales 11.7% Never married54.5% Now married0.0% Separated26.4% Widowed7.4% DivorcedWomen who gave birth in the past 12 months Now married:
100.0% (20)Unmarried:
0.0% (0)
Women who did not give birth in the past 12 months Now married:
58.9% (113)Unmarried:
41.1% (78)
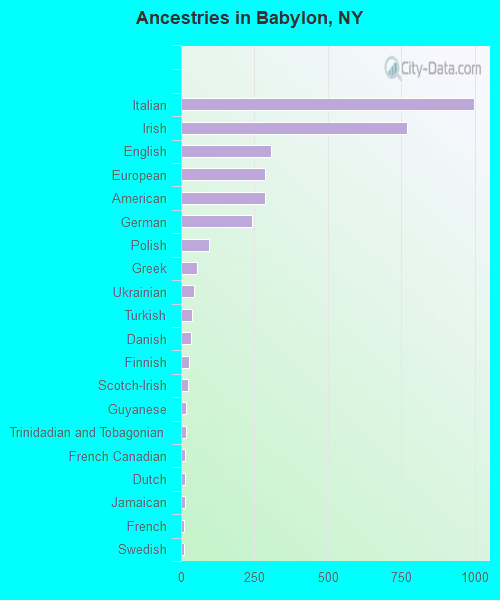
Ancestries in Babylon
998 24.0% Italian770 18.5% Irish306 7.3% English287 6.9% European285 6.8% American240 5.8% German95 2.3% Polish53 1.3% Greek44 1.1% Ukrainian36 0.9% Turkish33 0.8% Danish26 0.6% Finnish25 0.6% Scotch-Irish18 0.4% Guyanese16 0.4% Trinidadian and Tobagonian15 0.4% French Canadian12 0.3% Dutch12 0.3% Jamaican10 0.2% French10 0.2% Swedish9 0.2% Eastern European8 0.2% Croatian8 0.2% Welsh5 0.1% Northern European5 0.1% Russian3 0.07% Norwegian
Children Nativity (place of birth) in Babylon
Children under 6 years - Living with two parents Both parents native 630 99.6% Native3 0.4% Foreign-bornBoth parents foreign-born 4 100.0% Foreign-bornOne native, one foreign-born parent 97 100.0% NativeChildren under 6 years - Living with one parent Native parent 82 100.0% NativeChildren 6 to 17 years - Living with two parents Both parents native 857 100.0% Native0 0.0% Foreign-bornBoth parents foreign-born 91 95.5% Native4 4.5% Foreign-bornOne native, one foreign-born parent 48 75.7% Native15 24.3% Foreign-bornChildren 6 to 17 years - Living with one parent Native parent 192 89.7% Native22 10.3% Foreign-bornForeign-born parent 20 100.0% Native
Grandparents responsible for own grandchildren in Babylon
Grandparents (30 to 59 years) White / Caucasian 11 100.0% Not responsible for grandchildrenAmerican Indian / Alaska Native 31 100.0% Not responsible for grandchildrenWhite alone, not Hispanic / Latino 13 100.0% Not responsible for grandchildrenHispanic or Latino 16 100.0% Not responsible for grandchildrenGrandparents (60 years and over) White / Caucasian 13 15.5% Responsible for grandchildren72 84.5% Not responsible for grandchildrenWhite alone, not Hispanic / Latino 16 17.0% Responsible for grandchildren78 83.0% Not responsible for grandchildren