Races in Baltimore Highlands, Maryland (MD) Detailed Stats
Data:
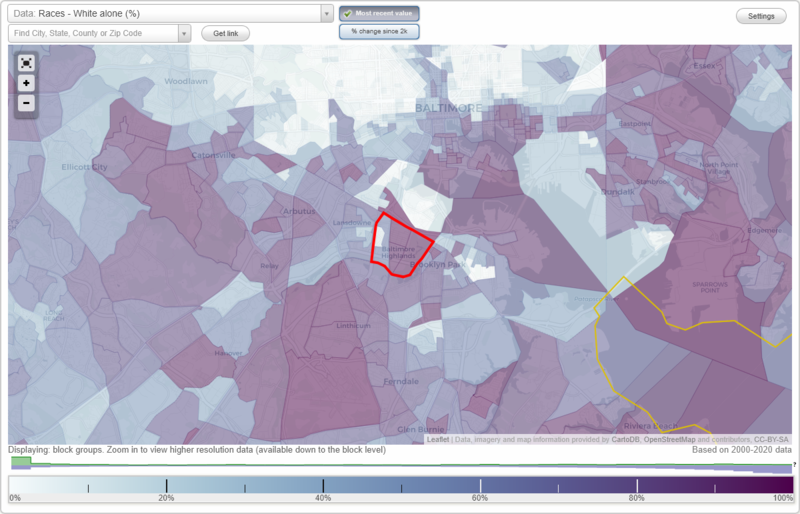
Races - White alone (%)
Races - White alone (% change since 2000)
Races - Black alone (%)
Races - Black alone (% change since 2000)
Races - American Indian alone (%)
Races - American Indian alone (% change since 2000)
Races - Asian alone (%)
Races - Asian alone (% change since 2000)
Races - Hispanic (%)
Races - Hispanic (% change since 2000)
Races - Native Hawaiian and Other Pacific Islander alone (%)
Races - Native Hawaiian and Other Pacific Islander alone (% change since 2000)
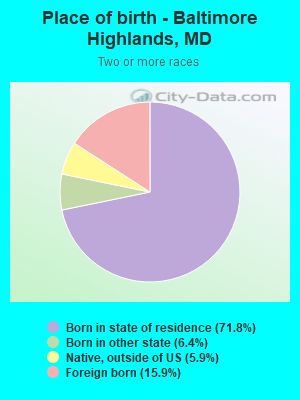
Races - Two or more races(%)
Races - Two or more races(% change since 2000)
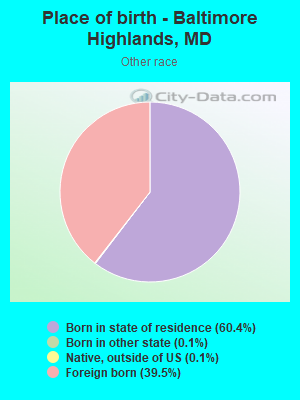
Races - Other race alone (%)
Races - Other race alone (% change since 2000)
Racial diversity
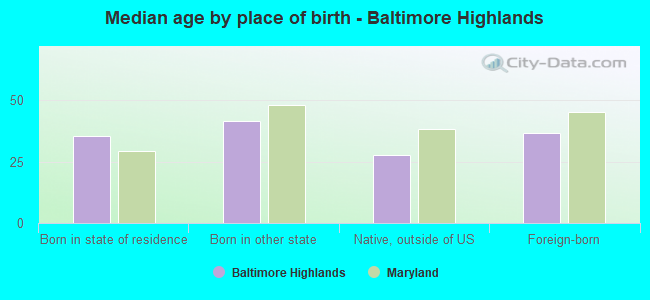
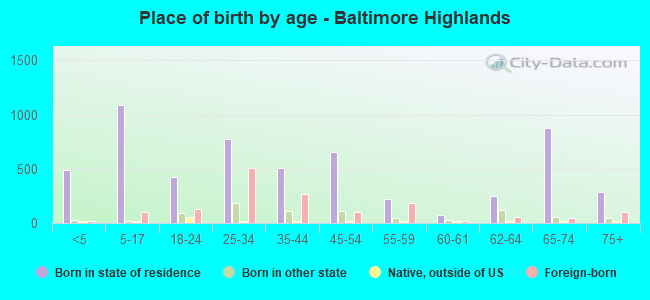
Place of birth - Born in state of residence (%)
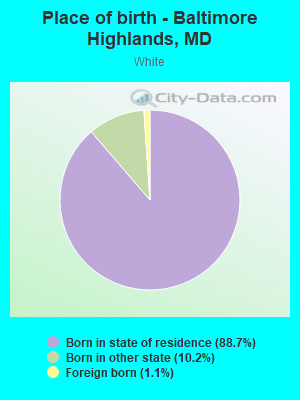
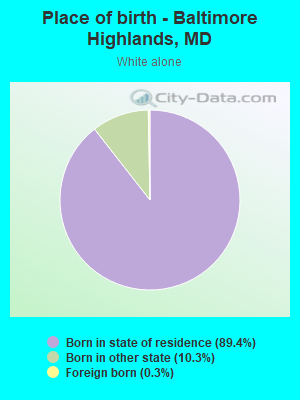
Place of birth - Born in state of residence (%) - White
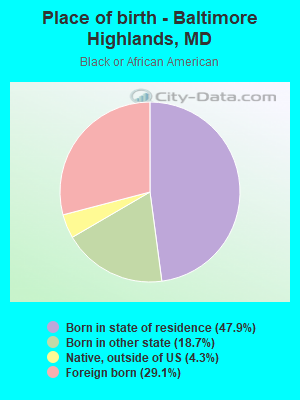
Place of birth - Born in state of residence (%) - Black or African American
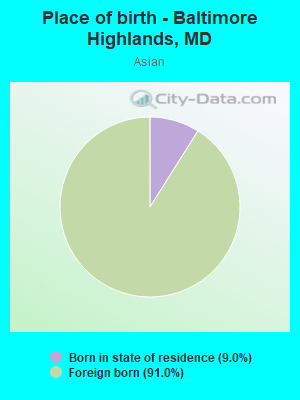
Place of birth - Born in state of residence (%) - Asian
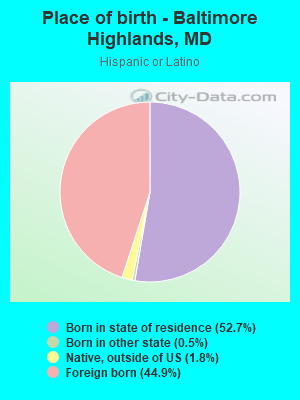
Place of birth - Born in state of residence (%) - Hispanic or Latino
Place of birth - Born in state of residence (%) - American Indian and Alaska Native
Place of birth - Born in state of residence (%) - Multirace
Place of birth - Born in state of residence (%) - Other Race
Place of birth - Born in other state (%)
Place of birth - Born in other state (%) - White
Place of birth - Born in other state (%) - Black or African American
Place of birth - Born in other state (%) - Asian
Place of birth - Born in other state (%) - Hispanic or Latino
Place of birth - Born in other state (%) - American Indian and Alaska Native
Place of birth - Born in other state (%) - Multirace
Place of birth - Born in other state (%) - Other Race
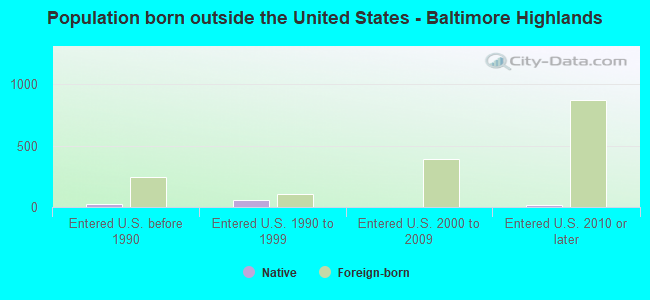
Place of birth - Native, outside of US (%)
Place of birth - Native, outside of US (%) - White
Place of birth - Native, outside of US (%) - Black or African American
Place of birth - Native, outside of US (%) - Asian
Place of birth - Native, outside of US (%) - Hispanic or Latino
Place of birth - Native, outside of US (%) - American Indian and Alaska Native
Place of birth - Native, outside of US (%) - Multirace
Place of birth - Native, outside of US (%) - Other Race
Place of birth - Foreign born (%)
Place of birth - Foreign born (%) - White
Place of birth - Foreign born (%) - Black or African American
Place of birth - Foreign born (%) - Asian
Place of birth - Foreign born (%) - Hispanic or Latino
Place of birth - Foreign born (%) - American Indian and Alaska Native
Place of birth - Foreign born (%) - Multirace
Place of birth - Foreign born (%) - Other Race
Residents speaking English at home (%)
Residents speaking English at home - Born in the United States (%)
Residents speaking English at home - Native, born elsewhere (%)
Residents speaking English at home - Foreign born (%)
Residents speaking Spanish at home (%)
Residents speaking Spanish at home - Born in the United States (%)
Residents speaking Spanish at home - Native, born elsewhere (%)
Residents speaking Spanish at home - Foreign born (%)
Residents speaking other language at home (%)
Residents speaking other language at home - Born in the United States (%)
Residents speaking other language at home - Native, born elsewhere (%)
Residents speaking other language at home - Foreign born (%)
Marital status - Never married (%)
Marital status - Now married (%)
Marital status - Separated (%)
Marital status - Widowed (%)
Marital status - Divorced (%)
Ancestries Reported - Arab (%)
Ancestries Reported - Czech (%)
Ancestries Reported - Danish (%)
Ancestries Reported - Dutch (%)
Ancestries Reported - English (%)
Ancestries Reported - French (%)
Ancestries Reported - French Canadian (%)
Ancestries Reported - German (%)
Ancestries Reported - Greek (%)
Ancestries Reported - Hungarian (%)
Ancestries Reported - Irish (%)
Ancestries Reported - Italian (%)
Ancestries Reported - Lithuanian (%)
Ancestries Reported - Norwegian (%)
Ancestries Reported - Polish (%)
Ancestries Reported - Portuguese (%)
Ancestries Reported - Russian (%)
Ancestries Reported - Scotch-Irish (%)
Ancestries Reported - Scottish (%)
Ancestries Reported - Slovak (%)
Ancestries Reported - Subsaharan African (%)
Ancestries Reported - Swedish (%)
Ancestries Reported - Swiss (%)
Ancestries Reported - Ukrainian (%)
Ancestries Reported - United States (%)
Ancestries Reported - Welsh (%)
Ancestries Reported - West Indian (%)
Ancestries Reported - Other (%)
Geographical mobility - Same house 1 year ago (%)
Geographical mobility - Same house 1 year ago (%) - White
Geographical mobility - Same house 1 year ago (%) - Black or African American
Geographical mobility - Same house 1 year ago (%) - Asian
Geographical mobility - Same house 1 year ago (%) - Hispanic or Latino
Geographical mobility - Same house 1 year ago (%) - American Indian and Alaska Native
Geographical mobility - Same house 1 year ago (%) - Multirace
Geographical mobility - Same house 1 year ago (%) - Other Race
Geographical mobility - Moved within same county (%)
Geographical mobility - Moved within same county (%) - White
Geographical mobility - Moved within same county (%) - Black or African American
Geographical mobility - Moved within same county (%) - Asian
Geographical mobility - Moved within same county (%) - Hispanic or Latino
Geographical mobility - Moved within same county (%) - American Indian and Alaska Native
Geographical mobility - Moved within same county (%) - Multirace
Geographical mobility - Moved within same county (%) - Other Race
Geographical mobility - Moved from different county within same state (%)
Geographical mobility - Moved from different county within same state (%) - White
Geographical mobility - Moved from different county within same state (%) - Black or African American
Geographical mobility - Moved from different county within same state (%) - Asian
Geographical mobility - Moved from different county within same state (%) - Hispanic or Latino
Geographical mobility - Moved from different county within same state (%) - American Indian and Alaska Native
Geographical mobility - Moved from different county within same state (%) - Multirace
Geographical mobility - Moved from different county within same state (%) - Other Race
Geographical mobility - Moved from different state (%)
Geographical mobility - Moved from different state (%) - White
Geographical mobility - Moved from different state (%) - Black or African American
Geographical mobility - Moved from different state (%) - Asian
Geographical mobility - Moved from different state (%) - Hispanic or Latino
Geographical mobility - Moved from different state (%) - American Indian and Alaska Native
Geographical mobility - Moved from different state (%) - Multirace
Geographical mobility - Moved from different state (%) - Other Race
Geographical mobility - Moved from abroad (%)
Geographical mobility - Moved from abroad (%) - White
Geographical mobility - Moved from abroad (%) - Black or African American
Geographical mobility - Moved from abroad (%) - Asian
Geographical mobility - Moved from abroad (%) - Hispanic or Latino
Geographical mobility - Moved from abroad (%) - American Indian and Alaska Native
Geographical mobility - Moved from abroad (%) - Multirace
Geographical mobility - Moved from abroad (%) - Other Race
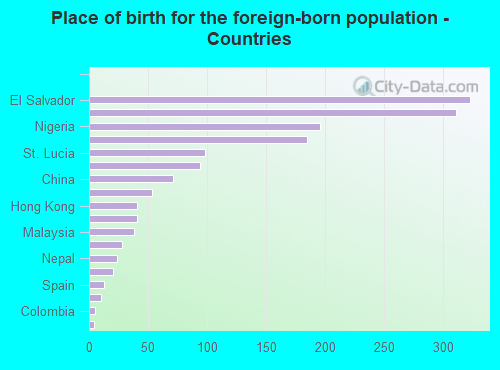
Place of birth for the foreign-born population - Ireland (%)
Place of birth for the foreign-born population - Denmark (%)
Place of birth for the foreign-born population - Norway (%)
Place of birth for the foreign-born population - Sweden (%)
Place of birth for the foreign-born population - United Kingdom (%)
Place of birth for the foreign-born population - England (%)
Place of birth for the foreign-born population - Scotland (%)
Place of birth for the foreign-born population - Other Northern Europe (%)
Place of birth for the foreign-born population - Austria (%)
Place of birth for the foreign-born population - Belgium (%)
Place of birth for the foreign-born population - France (%)
Place of birth for the foreign-born population - Germany (%)
Place of birth for the foreign-born population - Netherlands (%)
Place of birth for the foreign-born population - Switzerland (%)
Place of birth for the foreign-born population - Other Western Europe (%)
Place of birth for the foreign-born population - Greece (%)
Place of birth for the foreign-born population - Italy (%)
Place of birth for the foreign-born population - Portugal (%)
Place of birth for the foreign-born population - Spain (%)
Place of birth for the foreign-born population - Other Southern Europe (%)
Place of birth for the foreign-born population - Albania (%)
Place of birth for the foreign-born population - Belarus (%)
Place of birth for the foreign-born population - Bosnia and Herzegovina (%)
Place of birth for the foreign-born population - Bulgaria (%)
Place of birth for the foreign-born population - Croatia (%)
Place of birth for the foreign-born population - Czechoslovakia (%)
Place of birth for the foreign-born population - Hungary (%)
Place of birth for the foreign-born population - Latvia (%)
Place of birth for the foreign-born population - Lithuania (%)
Place of birth for the foreign-born population - North Macedonia (Macedonia) (%)
Place of birth for the foreign-born population - Moldova (%)
Place of birth for the foreign-born population - Poland (%)
Place of birth for the foreign-born population - Romania (%)
Place of birth for the foreign-born population - Russia (%)
Place of birth for the foreign-born population - Serbia (%)
Place of birth for the foreign-born population - Ukraine (%)
Place of birth for the foreign-born population - Other Eastern Europe (%)
Place of birth for the foreign-born population - China (%)
Place of birth for the foreign-born population - Hong Kong (%)
Place of birth for the foreign-born population - Taiwan (%)
Place of birth for the foreign-born population - Japan (%)
Place of birth for the foreign-born population - Korea (%)
Place of birth for the foreign-born population - Other Eastern Asia (%)
Place of birth for the foreign-born population - Afghanistan (%)
Place of birth for the foreign-born population - Bangladesh (%)
Place of birth for the foreign-born population - India (%)
Place of birth for the foreign-born population - Iran (%)
Place of birth for the foreign-born population - Kazakhstan (%)
Place of birth for the foreign-born population - Nepal (%)
Place of birth for the foreign-born population - Pakistan (%)
Place of birth for the foreign-born population - Sri Lanka (%)
Place of birth for the foreign-born population - Uzbekistan (%)
Place of birth for the foreign-born population - Other South Central Asia (%)
Place of birth for the foreign-born population - Burma (%)
Place of birth for the foreign-born population - Cambodia (%)
Place of birth for the foreign-born population - Indonesia (%)
Place of birth for the foreign-born population - Laos (%)
Place of birth for the foreign-born population - Malaysia (%)
Place of birth for the foreign-born population - Philippines (%)
Place of birth for the foreign-born population - Singapore (%)
Place of birth for the foreign-born population - Thailand (%)
Place of birth for the foreign-born population - Vietnam (%)
Place of birth for the foreign-born population - Other South Eastern Asia (%)
Place of birth for the foreign-born population - Armenia (%)
Place of birth for the foreign-born population - Iraq (%)
Place of birth for the foreign-born population - Israel (%)
Place of birth for the foreign-born population - Jordan (%)
Place of birth for the foreign-born population - Kuwait (%)
Place of birth for the foreign-born population - Lebanon (%)
Place of birth for the foreign-born population - Saudi Arabia (%)
Place of birth for the foreign-born population - Syria (%)
Place of birth for the foreign-born population - Turkey (%)
Place of birth for the foreign-born population - Yemen (%)
Place of birth for the foreign-born population - Other Western Asia (%)
Place of birth for the foreign-born population - Eritrea (%)
Place of birth for the foreign-born population - Ethiopia (%)
Place of birth for the foreign-born population - Kenya (%)
Place of birth for the foreign-born population - Somalia (%)
Place of birth for the foreign-born population - Uganda (%)
Place of birth for the foreign-born population - Zimbabwe (%)
Place of birth for the foreign-born population - Other Eastern Africa (%)
Place of birth for the foreign-born population - Cameroon (%)
Place of birth for the foreign-born population - Congo (%)
Place of birth for the foreign-born population - Democratic Republic of Congo (Zaire) (%)
Place of birth for the foreign-born population - Other Middle Africa (%)
Place of birth for the foreign-born population - Egypt (%)
Place of birth for the foreign-born population - Morocco (%)
Place of birth for the foreign-born population - Sudan (%)
Place of birth for the foreign-born population - Other Northern Africa (%)
Place of birth for the foreign-born population - South Africa (%)
Place of birth for the foreign-born population - Other Southern Africa (%)
Place of birth for the foreign-born population - Cabo Verde (%)
Place of birth for the foreign-born population - Ghana (%)
Place of birth for the foreign-born population - Liberia (%)
Place of birth for the foreign-born population - Nigeria (%)
Place of birth for the foreign-born population - Senegal (%)
Place of birth for the foreign-born population - Sierra Leone (%)
Place of birth for the foreign-born population - Other Western Africa (%)
Place of birth for the foreign-born population - Australia (%)
Place of birth for the foreign-born population - New Zealand (%)
Place of birth for the foreign-born population - Fiji (%)
Place of birth for the foreign-born population - Micronesia (%)
Place of birth for the foreign-born population - Bahamas (%)
Place of birth for the foreign-born population - Barbados (%)
Place of birth for the foreign-born population - Cuba (%)
Place of birth for the foreign-born population - Dominica (%)
Place of birth for the foreign-born population - Dominican Republic (%)
Place of birth for the foreign-born population - Grenada (%)
Place of birth for the foreign-born population - Haiti (%)
Place of birth for the foreign-born population - Jamaica (%)
Place of birth for the foreign-born population - St. Vincent and the Grenadines (%)
Place of birth for the foreign-born population - Trinidad and Tobago (%)
Place of birth for the foreign-born population - West Indies (%)
Place of birth for the foreign-born population - Other Caribbean (%)
Place of birth for the foreign-born population - Belize (%)
Place of birth for the foreign-born population - Costa Rica (%)
Place of birth for the foreign-born population - El Salvador (%)
Place of birth for the foreign-born population - Guatemala (%)
Place of birth for the foreign-born population - Honduras (%)
Place of birth for the foreign-born population - Mexico (%)
Place of birth for the foreign-born population - Nicaragua (%)
Place of birth for the foreign-born population - Panama (%)
Place of birth for the foreign-born population - Other Central America (%)
Place of birth for the foreign-born population - Argentina (%)
Place of birth for the foreign-born population - Bolivia (%)
Place of birth for the foreign-born population - Brazil (%)
Place of birth for the foreign-born population - Chile (%)
Place of birth for the foreign-born population - Colombia (%)
Place of birth for the foreign-born population - Ecuador (%)
Place of birth for the foreign-born population - Guyana (%)
Place of birth for the foreign-born population - Peru (%)
Place of birth for the foreign-born population - Uruguay (%)
Place of birth for the foreign-born population - Venezuela (%)
Place of birth for the foreign-born population - Other South America (%)
Place of birth for the foreign-born population - Canada (%)
Place of birth for the foreign-born population - Other Northern America (%)
Place of birth for the foreign-born population - Other (%)
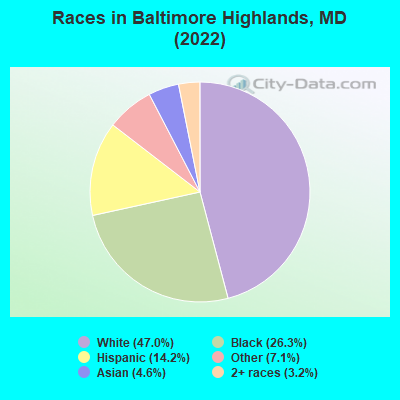
According to 2022 data, the most numerous races in Baltimore Highlands, MD are White alone (3,790 residents), Black alone (2,126 residents), and Hispanic (1,150 residents). 79.3% of Baltimore Highlands residents speak English at home.
Race distribution in Baltimore Highlands 3,790 47.0% White alone 2,126 26.3% Black alone 1,150 14.2% Hispanic 575 7.1% Other race alone 374 4.6% Asian alone 262 3.2% Two or more races
2000 2022
3,286,547 62.1% White alone 1,464,735 27.7% Black alone 227,916 4.3% Hispanic 209,738 4.0% Asian alone 82,946 1.6% Two or more races 13,312 0.3% American Indian alone 9,379 0.2% Other race alone 1,913 0.04% Native Hawaiian and Other
2,906,492 47.1% White alone 1,800,914 29.2% Black alone 705,842 11.4% Hispanic 401,818 6.5% Asian alone 291,317 4.7% Two or more races 46,930 0.8% Other race alone 8,930 0.1% American Indian alone 2,417 0.04% Native Hawaiian and Other
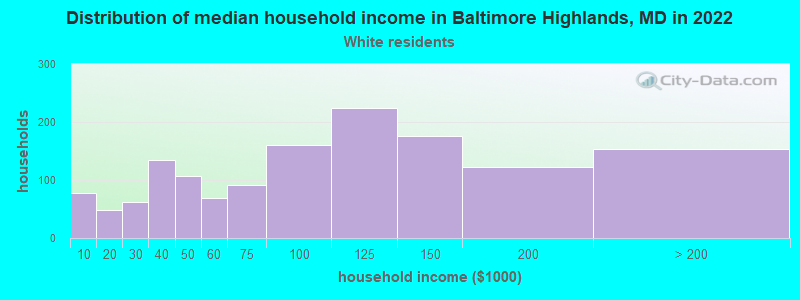
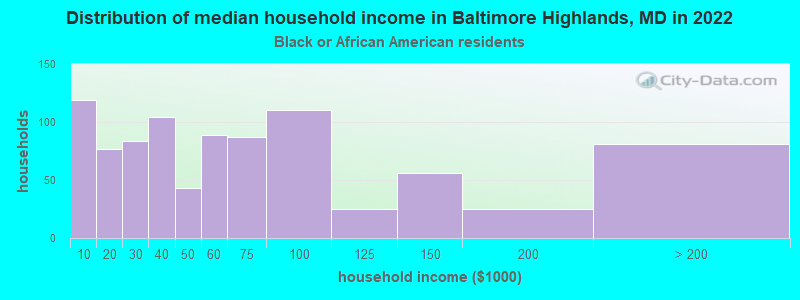
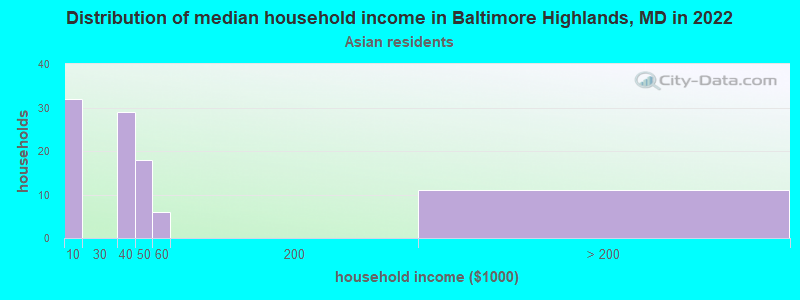
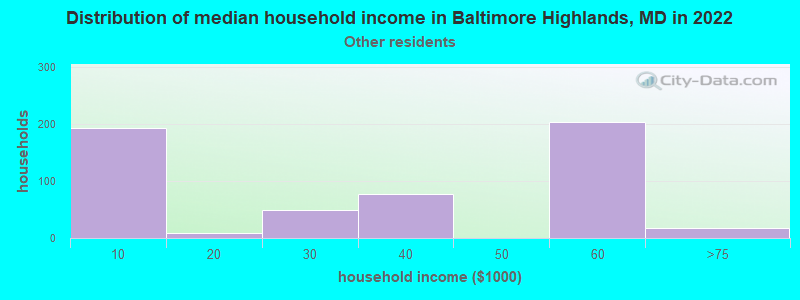
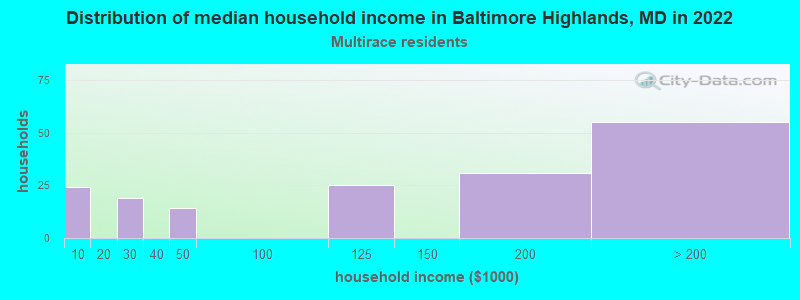
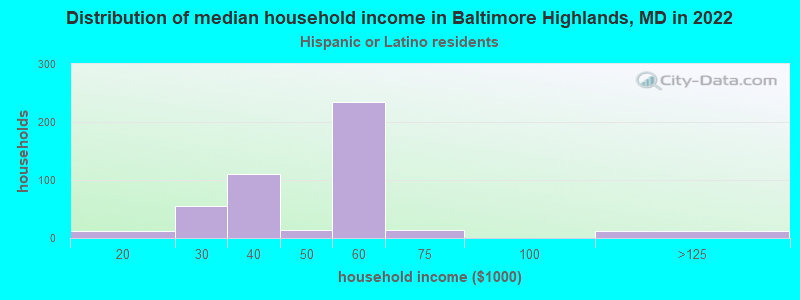
Income and house value in Baltimore Highlands Median household income in 2022 $89,834 White non-Hispanic householders$54,581 Black householders$37,132 Asian householders$44,478 Hispanic or Latino race householders
Median age by race in Baltimore Highlands
43.9 Median age for White residents42.1 44.7 33.6 Median age for Black or African American residents32.2 33.4 -768,041,236.3 Median age for American Indian / Alaska Native residents-867,632,849.4 -677,419,354.2 49.4 Median age for Asian residents37.3 62.0 -1,541,125,539.6 Median age for Native Hawaiian / Pacific Islander residents-790,901,136.6 -760,942,760.2 34.3 Median age for Other race residents38.2 32.2 27.3 Median age for Two or more races residents51.4 16.4 43.6 Median age for White alone residents41.8 44.7 15.8 Median age for Hispanic or Latino residents31.9 13.0
Owner/renter occupied households by race in Baltimore Highlands
House owners and renters - White residents 1,100 77.3% Owner occupied323 22.7% Renter occupiedHouse owners and renters - Black or African American residents 175 20.4% Owner occupied685 79.6% Renter occupiedHouse owners and renters - Asian residents 74 74.8% Owner occupied25 25.2% Renter occupiedHouse owners and renters - Other race residents 383 61.2% Owner occupied243 38.8% Renter occupiedHouse owners and renters - Two or more races residents 133 86.2% Owner occupied21 13.8% Renter occupiedHouse owners and renters - White alone residents 1,091 77.0% Owner occupied326 23.0% Renter occupiedHouse owners and renters - Hispanic or Latino residents 94 29.1% Owner occupied229 70.9% Renter occupied
Language usage in Baltimore Highlands
English speakers - Total 79.3% of residents of Baltimore Highlands speak English at home.
10.1% of residents speak Spanish at home 306 40.2% Speak English very well455 59.8% Speak English less than very well10.8% of residents speak other language at home 315 38.6% Speak English very well502 61.4% Speak English less than very well
All residents speak only English at home
English speakers - Native, born elsewhere 26.5% of residents of Baltimore Highlands speak English at home.
18.4% of residents speak Spanish at home 18 100.0% Speak English very well28.6% of residents speak other language at home 28 100.0% Speak English less than very well
English speakers - Foreign-born 25.7% of residents of Baltimore Highlands speak English at home.
31.9% of residents speak Spanish at home 133 26.9% Speak English very well362 73.1% Speak English less than very well44.8% of residents speak other language at home 264 37.9% Speak English very well432 62.1% Speak English less than very well
White (Caucasian) - Speak another language Native:
0.6% (21)Foreign-born:
97.4% (39)
Black or African American - Speak only English Native:
90.6% (1,194)Foreign-born:
47.6% (296)
Black or African American - Speak another language Native:
7.8% (103)Foreign-born:
52.9% (328)
Asian - Speak only English Native:
100.0% (4)Foreign-born:
22.2% (79)
Other race - Speak another language Native:
42.2% (347)Foreign-born:
100.0% (652)
Two or more races - Speak only English Native:
95.1% (347)Foreign-born:
81.6% (55)
Two or more races - Speak another language Native:
6.3% (23)Foreign-born:
35.9% (24)
White alone - Speak another language Native:
0.5% (18)Foreign-born:
100.0% (11)
Hispanic or Latino - Speak only English Native:
24.0% (103)Foreign-born:
6.4% (34)
Hispanic or Latino - Speak another language Native:
66.7% (286)Foreign-born:
93.6% (502)
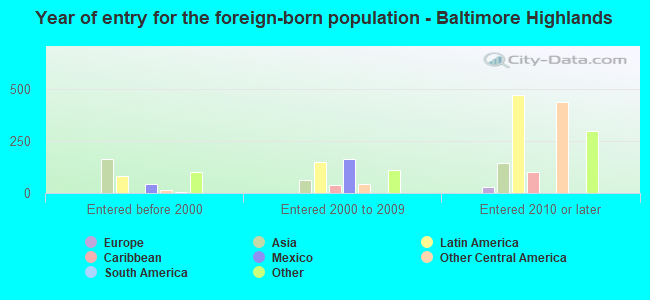
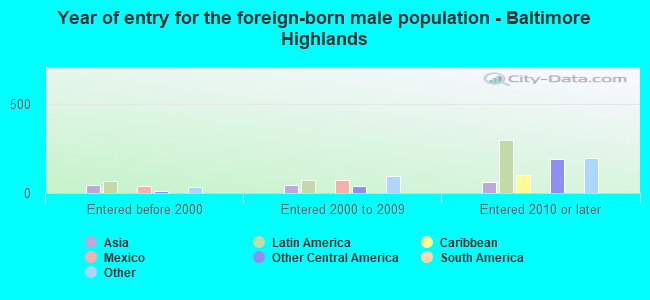
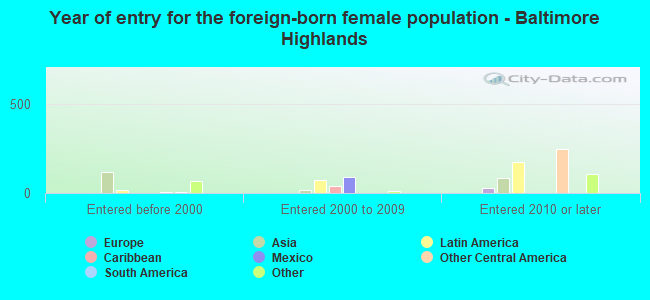
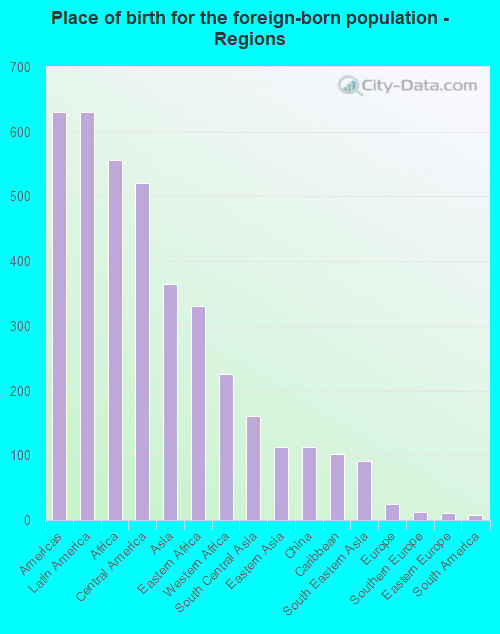
Foreign-born residents in Baltimore Highlands
Marital status for residents in Baltimore Highlands Marital status - White (Caucasian) population 15 years and over
Males 40.0% Never married45.6% Now married0.6% Separated5.0% Widowed8.8% DivorcedFemales 35.3% Never married43.2% Now married1.3% Separated10.0% Widowed10.3% DivorcedWomen who gave birth in the past 12 months Now married:
69.0% (27)Unmarried:
31.0% (12)
Women who did not give birth in the past 12 months Now married:
28.9% (265)Unmarried:
71.1% (654)
Marital status - Black or African American population 15 years and over
Males 52.4% Never married25.7% Now married0.0% Separated0.0% Widowed21.9% DivorcedFemales 44.6% Never married26.4% Now married5.4% Separated7.4% Widowed16.1% DivorcedWomen who gave birth in the past 12 months Now married:
100.0% (30)Unmarried:
0.0% (0)
Women who did not give birth in the past 12 months Now married:
40.5% (203)Unmarried:
59.5% (299)
Marital status - Asian population 15 years and over
Males 24.8% Never married75.2% Now married0.0% Separated0.0% Widowed0.0% DivorcedFemales 0.0% Never married63.6% Now married0.0% Separated36.4% Widowed0.0% DivorcedWomen who did not give birth in the past 12 months Now married:
100.0% (68)Unmarried:
0.0% (0)
Marital status - Other race population 15 years and over
Males 3.2% Never married76.7% Now married0.0% Separated0.0% Widowed20.0% DivorcedFemales 0.3% Never married99.7% Now married0.0% Separated0.0% Widowed0.0% DivorcedWomen who gave birth in the past 12 months Now married:
100.0% (86)Unmarried:
0.0% (0)
Women who did not give birth in the past 12 months Now married:
98.1% (76)Unmarried:
1.9% (1)
Marital status - Two or more races population 15 years and over
Males 27.5% Never married44.4% Now married0.0% Separated8.8% Widowed19.3% DivorcedFemales 50.6% Never married30.4% Now married2.5% Separated0.0% Widowed16.5% DivorcedWomen who did not give birth in the past 12 months Now married:
32.1% (32)Unmarried:
67.9% (67)
Marital status - White alone, not Hispanic / Latino population 15 years and over
Males 40.0% Never married45.4% Now married0.6% Separated5.1% Widowed8.9% DivorcedFemales 35.2% Never married43.1% Now married1.3% Separated10.0% Widowed10.4% DivorcedWomen who gave birth in the past 12 months Now married:
69.0% (27)Unmarried:
31.0% (12)
Women who did not give birth in the past 12 months Now married:
29.1% (267)Unmarried:
70.9% (652)
Marital status - Hispanic or Latino population 15 years and over
Males 14.9% Never married59.9% Now married0.0% Separated0.0% Widowed25.2% DivorcedFemales 21.5% Never married70.7% Now married1.0% Separated0.0% Widowed6.8% DivorcedWomen who gave birth in the past 12 months Now married:
100.0% (63)Unmarried:
0.0% (0)
Women who did not give birth in the past 12 months Now married:
50.0% (58)Unmarried:
50.0% (58)
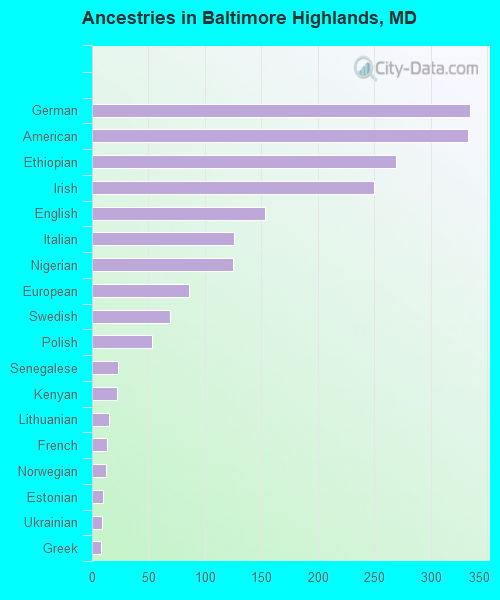
Ancestries in Baltimore Highlands
335 8.3% German333 8.2% American269 6.6% Ethiopian250 6.2% Irish153 3.8% English126 3.1% Italian125 3.1% Nigerian86 2.1% European69 1.7% Swedish53 1.3% Polish23 0.6% Senegalese22 0.5% Kenyan15 0.4% Lithuanian13 0.3% French12 0.3% Norwegian10 0.2% Estonian9 0.2% Ukrainian8 0.2% Greek
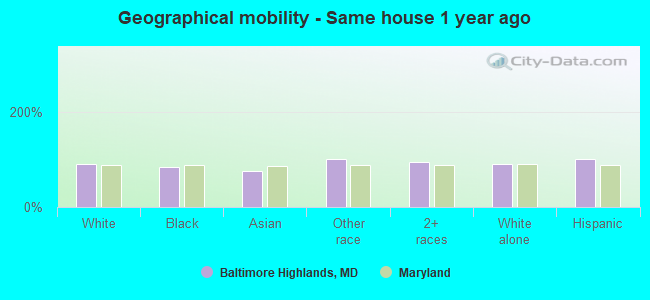
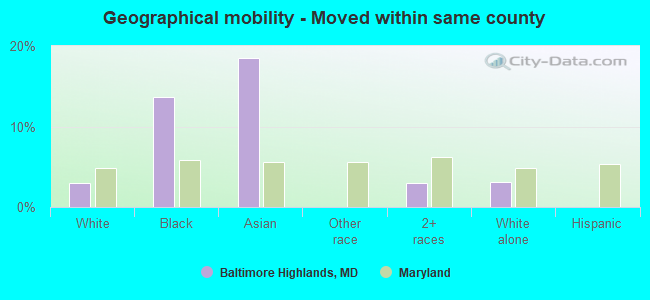
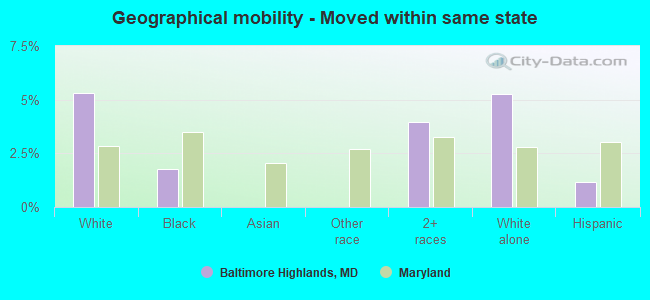
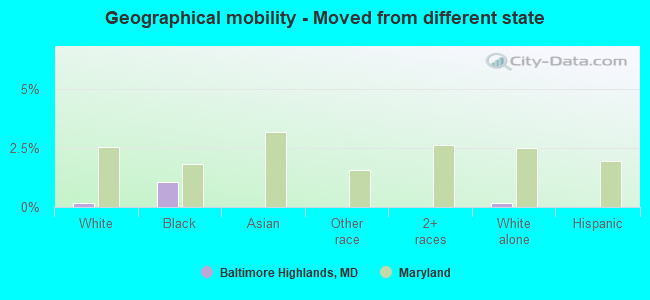
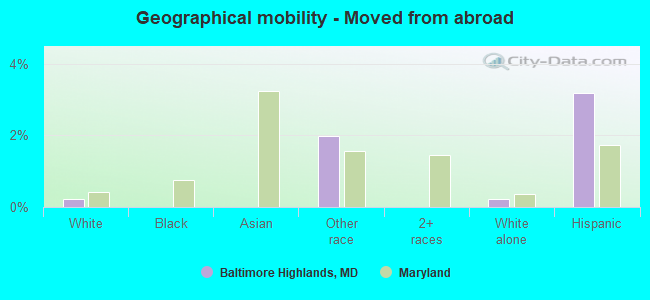
Geographical mobility in Baltimore Highlands Same house 1 year ago 3,437 91.3% White (Caucasian)1,765 83.6% Black or African American279 75.0% Asian1,378 100.0% Other race418 95.0% Two or more races3,435 91.1% White alone, not Hispanic / Latino1,064 100.0% Hispanic or LatinoMoved within same county 110 2.9% White / Caucasian289 13.7% Black or African American69 18.5% Asian13 2.9% Two or more races116 3.1% White alone, not Hispanic / LatinoMoved within same state 199 5.3% White / Caucasian37 1.8% Black or African American17 4.0% Two or more races199 5.3% White alone, not Hispanic / Latino12 1.1% Hispanic or LatinoMoved from different state 6 0.2% White / Caucasian23 1.1% Black or African American6 0.2% White alone, not Hispanic / LatinoMoved from abroad 8 0.2% White27 2.0% Other race8 0.2% White alone, not Hispanic / Latino33 3.2% Hispanic or Latino
Children Nativity (place of birth) in Baltimore Highlands
Children under 6 years - Living with two parents Both parents native 87 95.5% Native4 4.5% Foreign-bornBoth parents foreign-born 353 94.9% Native19 5.1% Foreign-bornChildren under 6 years - Living with one parent Native parent 202 100.0% NativeForeign-born parent 16 100.0% NativeChildren 6 to 17 years - Living with two parents Both parents native 192 100.0% NativeBoth parents foreign-born 260 80.2% Native64 19.8% Foreign-bornOne native, one foreign-born parent 58 100.0% NativeChildren 6 to 17 years - Living with one parent Native parent 350 93.7% Native23 6.3% Foreign-bornForeign-born parent 39 82.4% Native8 17.6% Foreign-born
Grandparents responsible for own grandchildren in Baltimore Highlands
Grandparents (30 to 59 years) White / Caucasian 12 11.8% Responsible for grandchildren86 88.2% Not responsible for grandchildrenBlack or African American 18 100.0% Responsible for grandchildrenOther race 1 85.0% Not responsible for grandchildrenTwo or more races 4 100.0% Not responsible for grandchildrenWhite alone, not Hispanic / Latino 12 13.6% Responsible for grandchildren73 86.4% Not responsible for grandchildrenHispanic or Latino 19 100.0% Not responsible for grandchildrenGrandparents (60 years and over) White / Caucasian 7 17.2% Responsible for grandchildren33 82.8% Not responsible for grandchildrenBlack or African American 6 28.2% Responsible for grandchildren15 71.8% Not responsible for grandchildrenOther race 36 100.0% Not responsible for grandchildrenTwo or more races 2 100.0% Not responsible for grandchildrenWhite alone, not Hispanic / Latino 7 16.7% Responsible for grandchildren35 83.3% Not responsible for grandchildrenHispanic or Latino 33 100.0% Not responsible for grandchildren