Races in Barberton, Ohio (OH) Detailed Stats
Data:
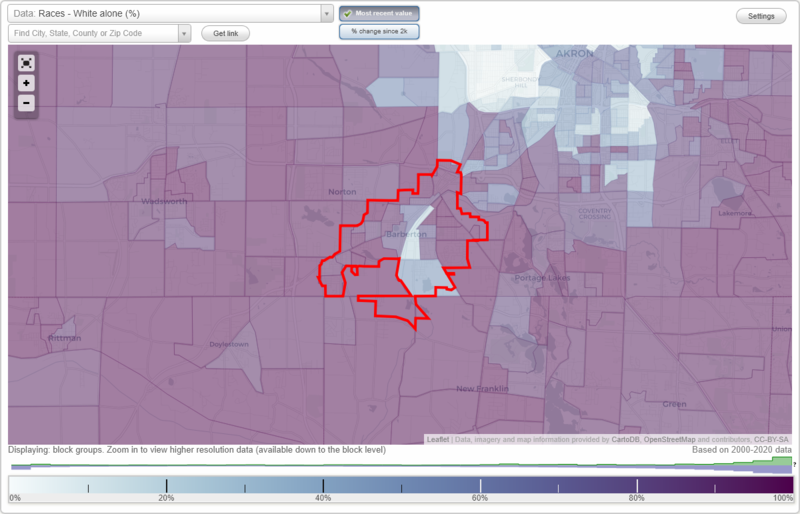
Races - White alone (%)
Races - White alone (% change since 2000)
Races - Black alone (%)
Races - Black alone (% change since 2000)
Races - American Indian alone (%)
Races - American Indian alone (% change since 2000)
Races - Asian alone (%)
Races - Asian alone (% change since 2000)
Races - Hispanic (%)
Races - Hispanic (% change since 2000)
Races - Native Hawaiian and Other Pacific Islander alone (%)
Races - Native Hawaiian and Other Pacific Islander alone (% change since 2000)
Races - Two or more races(%)
Races - Two or more races(% change since 2000)
Races - Other race alone (%)
Races - Other race alone (% change since 2000)
Racial diversity
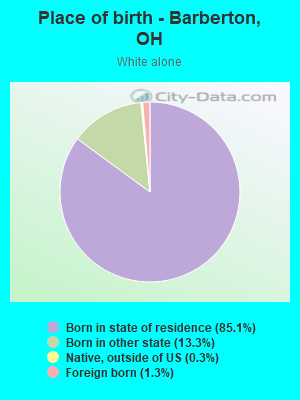
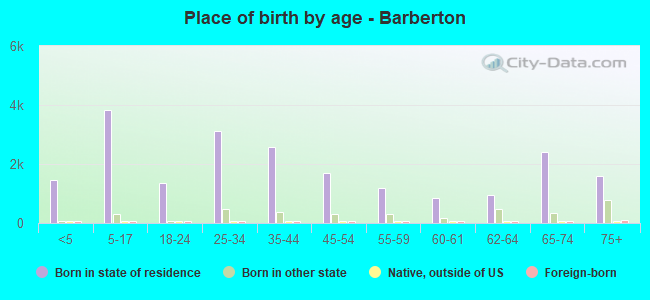
Place of birth - Born in state of residence (%)
Place of birth - Born in state of residence (%) - White
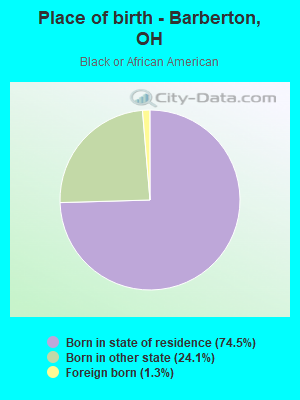
Place of birth - Born in state of residence (%) - Black or African American
Place of birth - Born in state of residence (%) - Asian
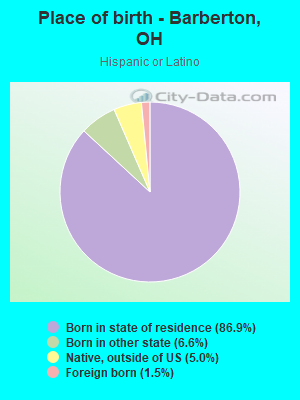
Place of birth - Born in state of residence (%) - Hispanic or Latino
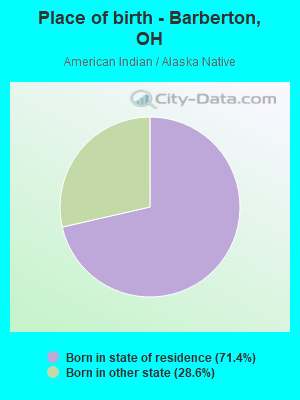
Place of birth - Born in state of residence (%) - American Indian and Alaska Native
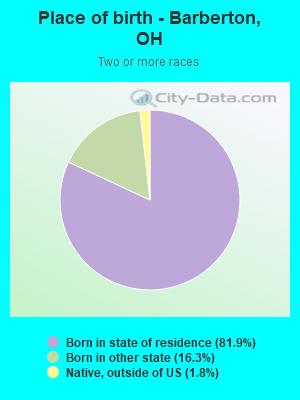
Place of birth - Born in state of residence (%) - Multirace
Place of birth - Born in state of residence (%) - Other Race
Place of birth - Born in other state (%)
Place of birth - Born in other state (%) - White
Place of birth - Born in other state (%) - Black or African American
Place of birth - Born in other state (%) - Asian
Place of birth - Born in other state (%) - Hispanic or Latino
Place of birth - Born in other state (%) - American Indian and Alaska Native
Place of birth - Born in other state (%) - Multirace
Place of birth - Born in other state (%) - Other Race
Place of birth - Native, outside of US (%)
Place of birth - Native, outside of US (%) - White
Place of birth - Native, outside of US (%) - Black or African American
Place of birth - Native, outside of US (%) - Asian
Place of birth - Native, outside of US (%) - Hispanic or Latino
Place of birth - Native, outside of US (%) - American Indian and Alaska Native
Place of birth - Native, outside of US (%) - Multirace
Place of birth - Native, outside of US (%) - Other Race
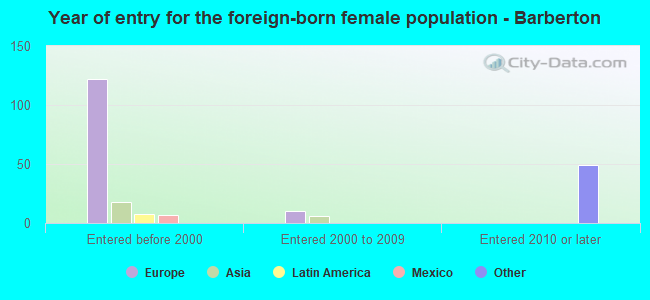
Place of birth - Foreign born (%)
Place of birth - Foreign born (%) - White
Place of birth - Foreign born (%) - Black or African American
Place of birth - Foreign born (%) - Asian
Place of birth - Foreign born (%) - Hispanic or Latino
Place of birth - Foreign born (%) - American Indian and Alaska Native
Place of birth - Foreign born (%) - Multirace
Place of birth - Foreign born (%) - Other Race
Residents speaking English at home (%)
Residents speaking English at home - Born in the United States (%)
Residents speaking English at home - Native, born elsewhere (%)
Residents speaking English at home - Foreign born (%)
Residents speaking Spanish at home (%)
Residents speaking Spanish at home - Born in the United States (%)
Residents speaking Spanish at home - Native, born elsewhere (%)
Residents speaking Spanish at home - Foreign born (%)
Residents speaking other language at home (%)
Residents speaking other language at home - Born in the United States (%)
Residents speaking other language at home - Native, born elsewhere (%)
Residents speaking other language at home - Foreign born (%)
Marital status - Never married (%)
Marital status - Now married (%)
Marital status - Separated (%)
Marital status - Widowed (%)
Marital status - Divorced (%)
Ancestries Reported - Arab (%)
Ancestries Reported - Czech (%)
Ancestries Reported - Danish (%)
Ancestries Reported - Dutch (%)
Ancestries Reported - English (%)
Ancestries Reported - French (%)
Ancestries Reported - French Canadian (%)
Ancestries Reported - German (%)
Ancestries Reported - Greek (%)
Ancestries Reported - Hungarian (%)
Ancestries Reported - Irish (%)
Ancestries Reported - Italian (%)
Ancestries Reported - Lithuanian (%)
Ancestries Reported - Norwegian (%)
Ancestries Reported - Polish (%)
Ancestries Reported - Portuguese (%)
Ancestries Reported - Russian (%)
Ancestries Reported - Scotch-Irish (%)
Ancestries Reported - Scottish (%)
Ancestries Reported - Slovak (%)
Ancestries Reported - Subsaharan African (%)
Ancestries Reported - Swedish (%)
Ancestries Reported - Swiss (%)
Ancestries Reported - Ukrainian (%)
Ancestries Reported - United States (%)
Ancestries Reported - Welsh (%)
Ancestries Reported - West Indian (%)
Ancestries Reported - Other (%)
Geographical mobility - Same house 1 year ago (%)
Geographical mobility - Same house 1 year ago (%) - White
Geographical mobility - Same house 1 year ago (%) - Black or African American
Geographical mobility - Same house 1 year ago (%) - Asian
Geographical mobility - Same house 1 year ago (%) - Hispanic or Latino
Geographical mobility - Same house 1 year ago (%) - American Indian and Alaska Native
Geographical mobility - Same house 1 year ago (%) - Multirace
Geographical mobility - Same house 1 year ago (%) - Other Race
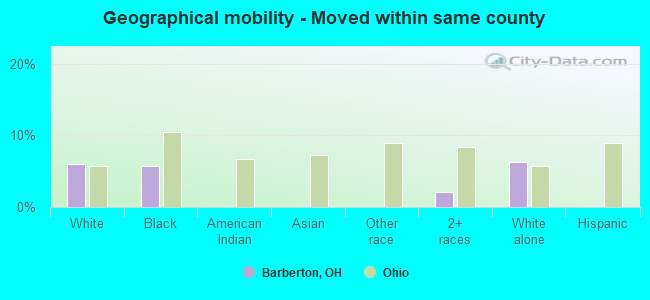
Geographical mobility - Moved within same county (%)
Geographical mobility - Moved within same county (%) - White
Geographical mobility - Moved within same county (%) - Black or African American
Geographical mobility - Moved within same county (%) - Asian
Geographical mobility - Moved within same county (%) - Hispanic or Latino
Geographical mobility - Moved within same county (%) - American Indian and Alaska Native
Geographical mobility - Moved within same county (%) - Multirace
Geographical mobility - Moved within same county (%) - Other Race
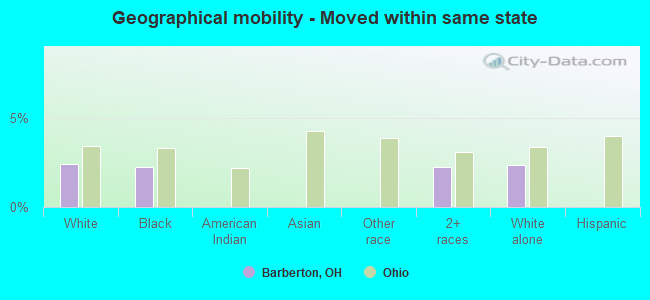
Geographical mobility - Moved from different county within same state (%)
Geographical mobility - Moved from different county within same state (%) - White
Geographical mobility - Moved from different county within same state (%) - Black or African American
Geographical mobility - Moved from different county within same state (%) - Asian
Geographical mobility - Moved from different county within same state (%) - Hispanic or Latino
Geographical mobility - Moved from different county within same state (%) - American Indian and Alaska Native
Geographical mobility - Moved from different county within same state (%) - Multirace
Geographical mobility - Moved from different county within same state (%) - Other Race
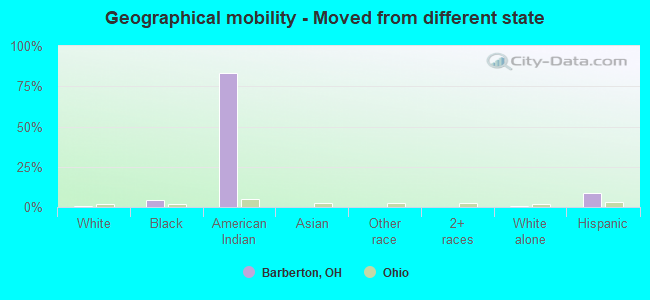
Geographical mobility - Moved from different state (%)
Geographical mobility - Moved from different state (%) - White
Geographical mobility - Moved from different state (%) - Black or African American
Geographical mobility - Moved from different state (%) - Asian
Geographical mobility - Moved from different state (%) - Hispanic or Latino
Geographical mobility - Moved from different state (%) - American Indian and Alaska Native
Geographical mobility - Moved from different state (%) - Multirace
Geographical mobility - Moved from different state (%) - Other Race
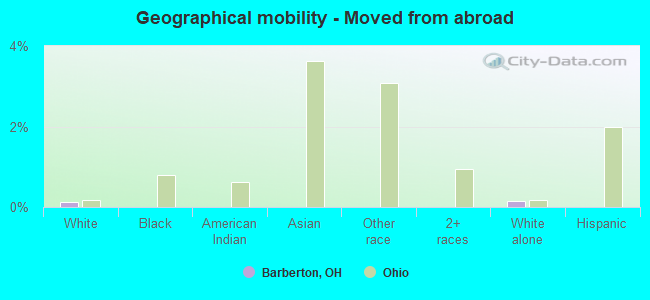
Geographical mobility - Moved from abroad (%)
Geographical mobility - Moved from abroad (%) - White
Geographical mobility - Moved from abroad (%) - Black or African American
Geographical mobility - Moved from abroad (%) - Asian
Geographical mobility - Moved from abroad (%) - Hispanic or Latino
Geographical mobility - Moved from abroad (%) - American Indian and Alaska Native
Geographical mobility - Moved from abroad (%) - Multirace
Geographical mobility - Moved from abroad (%) - Other Race
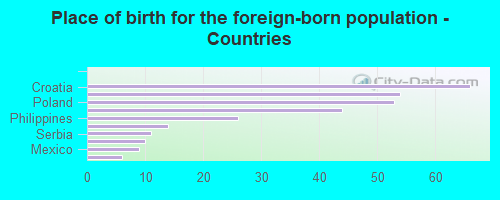
Place of birth for the foreign-born population - Ireland (%)
Place of birth for the foreign-born population - Denmark (%)
Place of birth for the foreign-born population - Norway (%)
Place of birth for the foreign-born population - Sweden (%)
Place of birth for the foreign-born population - United Kingdom (%)
Place of birth for the foreign-born population - England (%)
Place of birth for the foreign-born population - Scotland (%)
Place of birth for the foreign-born population - Other Northern Europe (%)
Place of birth for the foreign-born population - Austria (%)
Place of birth for the foreign-born population - Belgium (%)
Place of birth for the foreign-born population - France (%)
Place of birth for the foreign-born population - Germany (%)
Place of birth for the foreign-born population - Netherlands (%)
Place of birth for the foreign-born population - Switzerland (%)
Place of birth for the foreign-born population - Other Western Europe (%)
Place of birth for the foreign-born population - Greece (%)
Place of birth for the foreign-born population - Italy (%)
Place of birth for the foreign-born population - Portugal (%)
Place of birth for the foreign-born population - Spain (%)
Place of birth for the foreign-born population - Other Southern Europe (%)
Place of birth for the foreign-born population - Albania (%)
Place of birth for the foreign-born population - Belarus (%)
Place of birth for the foreign-born population - Bosnia and Herzegovina (%)
Place of birth for the foreign-born population - Bulgaria (%)
Place of birth for the foreign-born population - Croatia (%)
Place of birth for the foreign-born population - Czechoslovakia (%)
Place of birth for the foreign-born population - Hungary (%)
Place of birth for the foreign-born population - Latvia (%)
Place of birth for the foreign-born population - Lithuania (%)
Place of birth for the foreign-born population - North Macedonia (Macedonia) (%)
Place of birth for the foreign-born population - Moldova (%)
Place of birth for the foreign-born population - Poland (%)
Place of birth for the foreign-born population - Romania (%)
Place of birth for the foreign-born population - Russia (%)
Place of birth for the foreign-born population - Serbia (%)
Place of birth for the foreign-born population - Ukraine (%)
Place of birth for the foreign-born population - Other Eastern Europe (%)
Place of birth for the foreign-born population - China (%)
Place of birth for the foreign-born population - Hong Kong (%)
Place of birth for the foreign-born population - Taiwan (%)
Place of birth for the foreign-born population - Japan (%)
Place of birth for the foreign-born population - Korea (%)
Place of birth for the foreign-born population - Other Eastern Asia (%)
Place of birth for the foreign-born population - Afghanistan (%)
Place of birth for the foreign-born population - Bangladesh (%)
Place of birth for the foreign-born population - India (%)
Place of birth for the foreign-born population - Iran (%)
Place of birth for the foreign-born population - Kazakhstan (%)
Place of birth for the foreign-born population - Nepal (%)
Place of birth for the foreign-born population - Pakistan (%)
Place of birth for the foreign-born population - Sri Lanka (%)
Place of birth for the foreign-born population - Uzbekistan (%)
Place of birth for the foreign-born population - Other South Central Asia (%)
Place of birth for the foreign-born population - Burma (%)
Place of birth for the foreign-born population - Cambodia (%)
Place of birth for the foreign-born population - Indonesia (%)
Place of birth for the foreign-born population - Laos (%)
Place of birth for the foreign-born population - Malaysia (%)
Place of birth for the foreign-born population - Philippines (%)
Place of birth for the foreign-born population - Singapore (%)
Place of birth for the foreign-born population - Thailand (%)
Place of birth for the foreign-born population - Vietnam (%)
Place of birth for the foreign-born population - Other South Eastern Asia (%)
Place of birth for the foreign-born population - Armenia (%)
Place of birth for the foreign-born population - Iraq (%)
Place of birth for the foreign-born population - Israel (%)
Place of birth for the foreign-born population - Jordan (%)
Place of birth for the foreign-born population - Kuwait (%)
Place of birth for the foreign-born population - Lebanon (%)
Place of birth for the foreign-born population - Saudi Arabia (%)
Place of birth for the foreign-born population - Syria (%)
Place of birth for the foreign-born population - Turkey (%)
Place of birth for the foreign-born population - Yemen (%)
Place of birth for the foreign-born population - Other Western Asia (%)
Place of birth for the foreign-born population - Eritrea (%)
Place of birth for the foreign-born population - Ethiopia (%)
Place of birth for the foreign-born population - Kenya (%)
Place of birth for the foreign-born population - Somalia (%)
Place of birth for the foreign-born population - Uganda (%)
Place of birth for the foreign-born population - Zimbabwe (%)
Place of birth for the foreign-born population - Other Eastern Africa (%)
Place of birth for the foreign-born population - Cameroon (%)
Place of birth for the foreign-born population - Congo (%)
Place of birth for the foreign-born population - Democratic Republic of Congo (Zaire) (%)
Place of birth for the foreign-born population - Other Middle Africa (%)
Place of birth for the foreign-born population - Egypt (%)
Place of birth for the foreign-born population - Morocco (%)
Place of birth for the foreign-born population - Sudan (%)
Place of birth for the foreign-born population - Other Northern Africa (%)
Place of birth for the foreign-born population - South Africa (%)
Place of birth for the foreign-born population - Other Southern Africa (%)
Place of birth for the foreign-born population - Cabo Verde (%)
Place of birth for the foreign-born population - Ghana (%)
Place of birth for the foreign-born population - Liberia (%)
Place of birth for the foreign-born population - Nigeria (%)
Place of birth for the foreign-born population - Senegal (%)
Place of birth for the foreign-born population - Sierra Leone (%)
Place of birth for the foreign-born population - Other Western Africa (%)
Place of birth for the foreign-born population - Australia (%)
Place of birth for the foreign-born population - New Zealand (%)
Place of birth for the foreign-born population - Fiji (%)
Place of birth for the foreign-born population - Micronesia (%)
Place of birth for the foreign-born population - Bahamas (%)
Place of birth for the foreign-born population - Barbados (%)
Place of birth for the foreign-born population - Cuba (%)
Place of birth for the foreign-born population - Dominica (%)
Place of birth for the foreign-born population - Dominican Republic (%)
Place of birth for the foreign-born population - Grenada (%)
Place of birth for the foreign-born population - Haiti (%)
Place of birth for the foreign-born population - Jamaica (%)
Place of birth for the foreign-born population - St. Vincent and the Grenadines (%)
Place of birth for the foreign-born population - Trinidad and Tobago (%)
Place of birth for the foreign-born population - West Indies (%)
Place of birth for the foreign-born population - Other Caribbean (%)
Place of birth for the foreign-born population - Belize (%)
Place of birth for the foreign-born population - Costa Rica (%)
Place of birth for the foreign-born population - El Salvador (%)
Place of birth for the foreign-born population - Guatemala (%)
Place of birth for the foreign-born population - Honduras (%)
Place of birth for the foreign-born population - Mexico (%)
Place of birth for the foreign-born population - Nicaragua (%)
Place of birth for the foreign-born population - Panama (%)
Place of birth for the foreign-born population - Other Central America (%)
Place of birth for the foreign-born population - Argentina (%)
Place of birth for the foreign-born population - Bolivia (%)
Place of birth for the foreign-born population - Brazil (%)
Place of birth for the foreign-born population - Chile (%)
Place of birth for the foreign-born population - Colombia (%)
Place of birth for the foreign-born population - Ecuador (%)
Place of birth for the foreign-born population - Guyana (%)
Place of birth for the foreign-born population - Peru (%)
Place of birth for the foreign-born population - Uruguay (%)
Place of birth for the foreign-born population - Venezuela (%)
Place of birth for the foreign-born population - Other South America (%)
Place of birth for the foreign-born population - Canada (%)
Place of birth for the foreign-born population - Other Northern America (%)
Place of birth for the foreign-born population - Other (%)
Latest news about races in Barberton, OH collected exclusively by city-data.com from local newspapers, TV, and radio stations
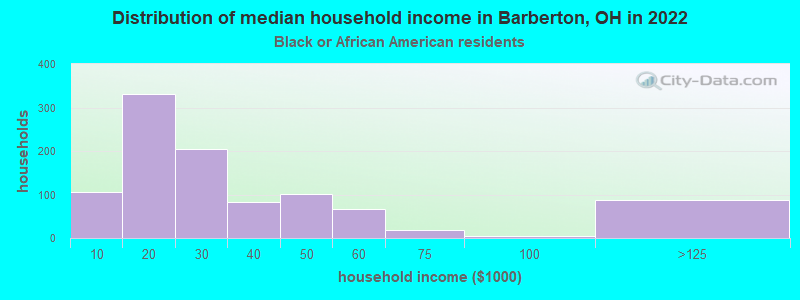
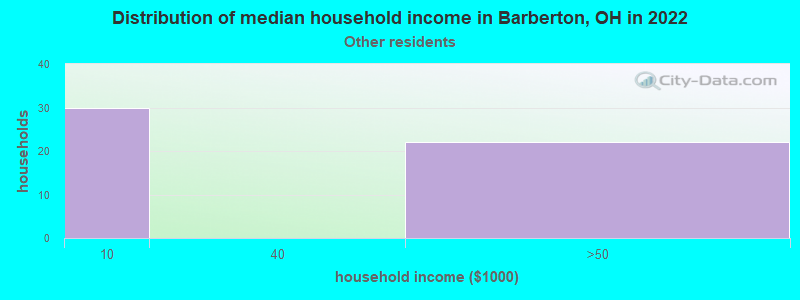
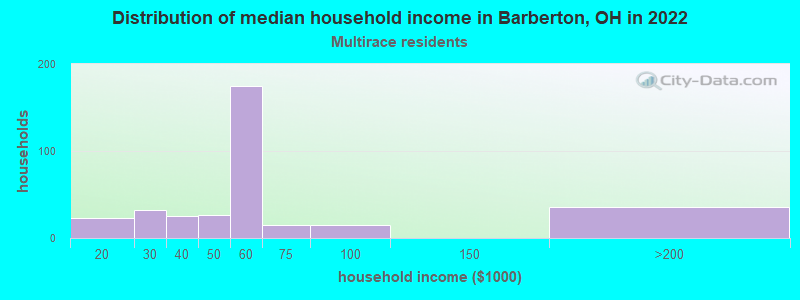
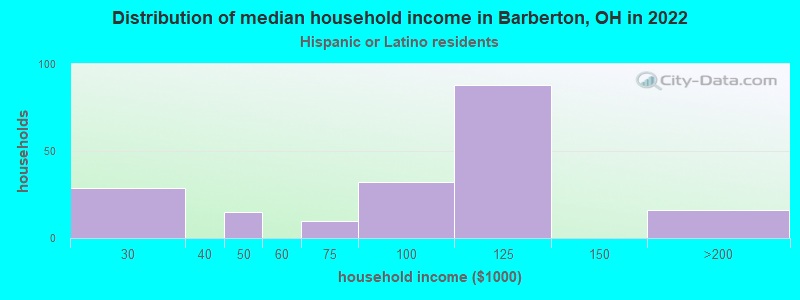
According to 2022 data, the most numerous races in Barberton, OH are White alone (20,673 residents), Black alone (2,269 residents), and Two or more races (1,365 residents). 96.0% of Barberton residents speak English at home. 1.4% of Barberton, OH residents are foreign-born , which is 183.3% less than the foreign-born rate of 4.0% across the entire state of Ohio.
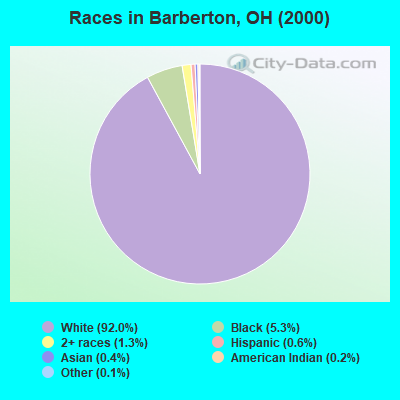
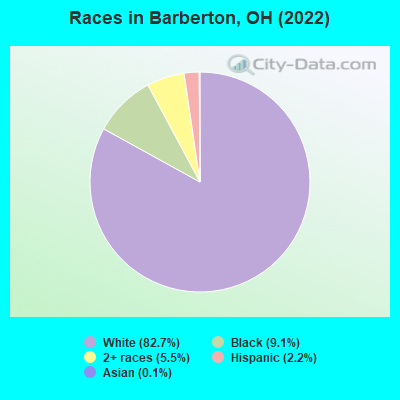
Race distribution in Barberton
2000 2022
9,538,111 84.0% White alone 1,290,662 11.4% Black alone 217,123 1.9% Hispanic 137,770 1.2% Two or more races 131,670 1.2% Asian alone 21,985 0.2% American Indian alone 13,483 0.1% Other race alone 2,336 0.02% Native Hawaiian and Other
8,948,793 76.1% White alone 1,401,403 11.9% Black alone 529,291 4.5% Two or more races 517,232 4.4% Hispanic 293,387 2.5% Asian alone 52,805 0.4% Other race alone 9,785 0.08% American Indian alone 3,362 0.03% Native Hawaiian and Other
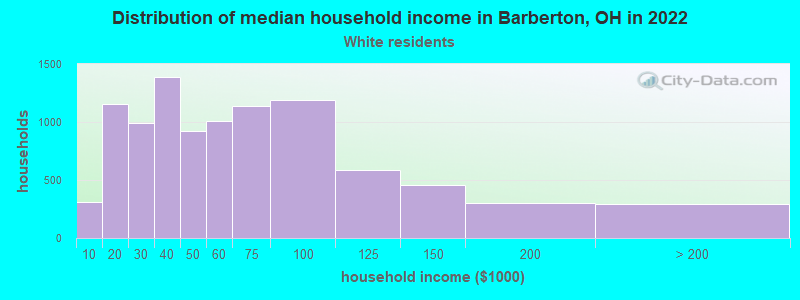
Income and house value in Barberton Median household income in 2022 $50,050 White non-Hispanic householders$22,554 Black householders$55,564 Two or more races householders$124,887 Hispanic or Latino race householdersMedian 2022 house value $119,097 White Non-Hispanic householders$94,617 Black or African American householders $107,683 Asian householders$168,959 Some other race householders$69,836 Two or more races householders$220,623 Hispanic or Latino householders
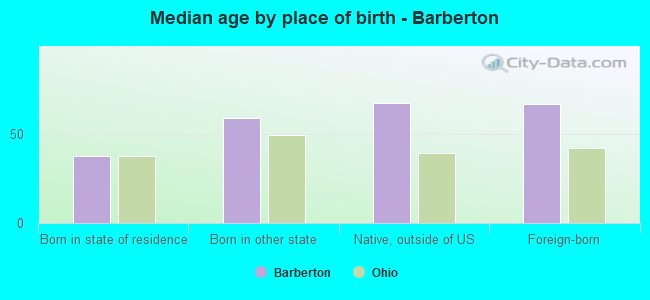
Median age by race in Barberton
44.2 Median age for White residents41.6 46.4 30.4 Median age for Black or African American residents35.2 27.4 -502,953,586.0 Median age for American Indian / Alaska Native residents-668,371,695.8 -390,759,075.5 66.4 Median age for Asian residents-749,226,005.4 63.9 -800,387,596.1 Median age for Native Hawaiian / Pacific Islander residents-666,666,666.0 -805,394,989.6 6.8 Median age for Other race residents-627,906,976.1 -668,582,374.8 19.2 Median age for Two or more races residents27.5 17.6 45.1 Median age for White alone residents41.9 47.6 20.3 Median age for Hispanic or Latino residents23.1 17.8
Owner/renter occupied households by race in Barberton
House owners and renters - White residents 6,449 67.6% Owner occupied3,086 32.4% Renter occupiedHouse owners and renters - Black or African American residents 209 21.5% Owner occupied762 78.5% Renter occupiedHouse owners and renters - American Indian / Alaska Native residents 42 100.0% Renter occupiedHouse owners and renters - Other race residents 33 100.0% Renter occupiedHouse owners and renters - Two or more races residents 145 38.3% Owner occupied234 61.7% Renter occupiedHouse owners and renters - White alone residents 6,370 67.4% Owner occupied3,084 32.6% Renter occupiedHouse owners and renters - Hispanic or Latino residents 124 59.1% Owner occupied86 40.9% Renter occupied
Language usage in Barberton
English speakers - Total 96.0% of residents of Barberton speak English at home.
1.4% of residents speak Spanish at home 321 100.0% Speak English very well2.5% of residents speak other language at home 350 59.3% Speak English very well240 40.7% Speak English less than very well
English speakers - Born in the United States 97.5% of residents of Barberton speak English at home.
2.5% of residents speak other language at home 58 66.7% Speak English very well29 33.3% Speak English less than very well
All residents speak only English at home
English speakers - Foreign-born 9.3% of residents of Barberton speak English at home.
2.8% of residents speak Spanish at home 10 100.0% Speak English very well90.4% of residents speak other language at home 146 45.5% Speak English very well175 54.5% Speak English less than very well
White (Caucasian) - Speak only English Native:
97.4% (19,027)Foreign-born:
12.2% (34)
White (Caucasian) - Speak another language Native:
2.6% (517)Foreign-born:
91.4% (257)
Black or African American - Speak another language Native:
4.0% (80)Foreign-born:
94.9% (30)
White alone - Speak only English Native:
98.4% (18,994)Foreign-born:
12.8% (34)
White alone - Speak another language Native:
1.6% (311)Foreign-born:
90.8% (243)
Hispanic or Latino - Speak another language Native:
35.6% (192)Foreign-born:
100.0% (9)
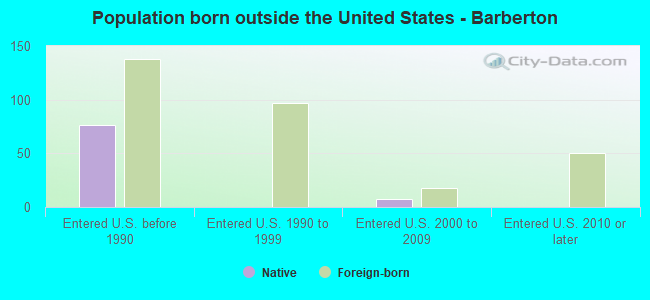
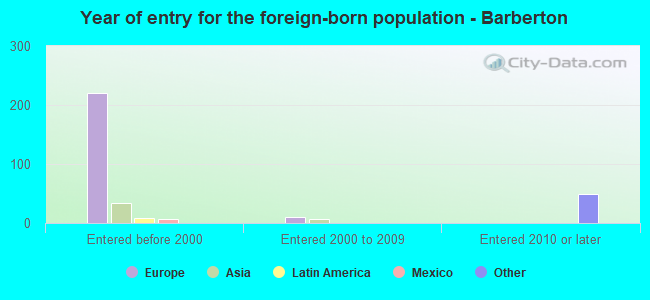
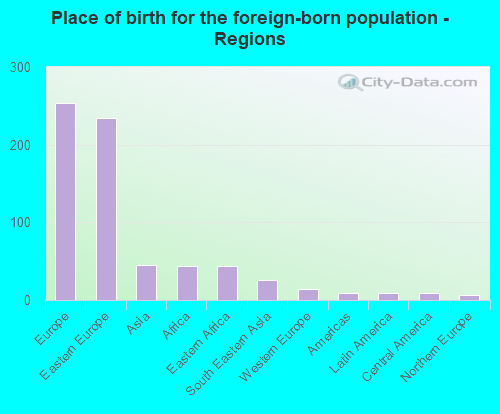
Foreign-born residents in Barberton 353 residents are foreign born
Marital status for residents in Barberton Marital status - White (Caucasian) population 15 years and over
Males 34.7% Never married45.9% Now married1.7% Separated4.7% Widowed13.1% DivorcedFemales 26.0% Never married42.0% Now married3.3% Separated14.3% Widowed14.3% DivorcedWomen who gave birth in the past 12 months Now married:
46.9% (131)Unmarried:
53.1% (148)
Women who did not give birth in the past 12 months Now married:
43.6% (1,794)Unmarried:
56.4% (2,320)
Marital status - Black or African American population 15 years and over
Males 52.7% Never married15.4% Now married6.9% Separated5.9% Widowed19.0% DivorcedFemales 47.4% Never married11.5% Now married10.5% Separated14.0% Widowed16.6% DivorcedWomen who gave birth in the past 12 months Now married:
100.0% (78)Unmarried:
0.0% (0)
Women who did not give birth in the past 12 months Now married:
14.1% (56)Unmarried:
85.9% (339)
Marital status - American Indian / Alaska Native population 15 years and over
Males 100.0% Never married0.0% Now married0.0% Separated0.0% Widowed0.0% DivorcedFemales 0.0% Never married0.0% Now married0.0% Separated0.0% Widowed100.0% DivorcedMarital status - Other race population 15 years and over
Males 0.0% Never married0.0% Now married100.0% Separated0.0% Widowed0.0% DivorcedFemales 0.0% Never married33.3% Now married0.0% Separated0.0% Widowed66.7% DivorcedWomen who did not give birth in the past 12 months Now married:
100.0% (13)Unmarried:
0.0% (0)
Marital status - Two or more races population 15 years and over
Males 71.1% Never married20.0% Now married0.0% Separated4.0% Widowed4.9% DivorcedFemales 57.0% Never married4.8% Now married28.0% Separated0.0% Widowed10.2% DivorcedWomen who did not give birth in the past 12 months Now married:
35.6% (126)Unmarried:
64.4% (228)
Marital status - White alone, not Hispanic / Latino population 15 years and over
Males 34.2% Never married46.1% Now married1.7% Separated4.8% Widowed13.2% DivorcedFemales 25.6% Never married42.6% Now married3.4% Separated14.6% Widowed13.9% DivorcedWomen who gave birth in the past 12 months Now married:
46.9% (132)Unmarried:
53.1% (149)
Women who did not give birth in the past 12 months Now married:
45.0% (1,801)Unmarried:
55.0% (2,206)
Marital status - Hispanic or Latino population 15 years and over
Males 68.0% Never married23.8% Now married8.1% Separated0.0% Widowed0.0% DivorcedFemales 52.0% Never married6.1% Now married0.0% Separated0.0% Widowed41.9% DivorcedWomen who did not give birth in the past 12 months Now married:
6.1% (9)Unmarried:
93.9% (137)
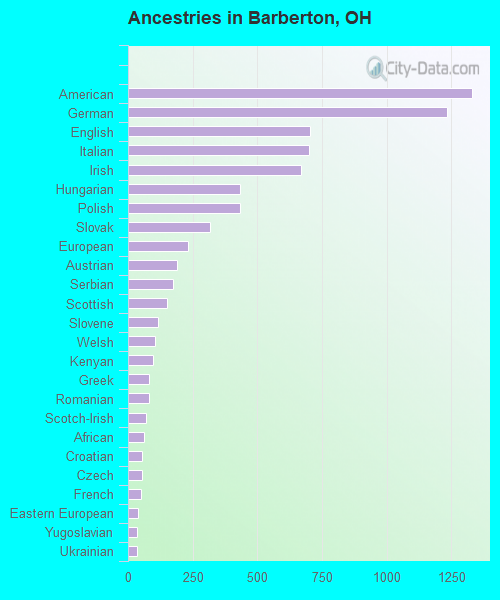
Ancestries in Barberton
1,329 12.1% American1,234 11.3% German705 6.4% English698 6.4% Italian669 6.1% Irish434 4.0% Hungarian433 4.0% Polish317 2.9% Slovak232 2.1% European188 1.7% Austrian173 1.6% Serbian150 1.4% Scottish115 1.1% Slovene104 1.0% Welsh95 0.9% Kenyan82 0.7% Greek81 0.7% Romanian71 0.6% Scotch-Irish63 0.6% African56 0.5% Croatian53 0.5% Czech49 0.4% French37 0.3% Eastern European35 0.3% Yugoslavian33 0.3% Ukrainian21 0.2% Czechoslovakian18 0.2% Dutch16 0.1% Swedish12 0.1% British11 0.1% Palestinian11 0.1% Norwegian11 0.1% Pennsylvania German10 0.09% Lebanese7 0.06% Russian6 0.05% Swiss5 0.05% Danish
Geographical mobility in Barberton Same house 1 year ago 18,701 90.5% White (Caucasian)1,947 88.9% Black or African American17 32.2% American Indian / Alaska Native28 95.8% Asian143 98.6% Other race1,352 90.0% Two or more races18,422 90.3% White alone, not Hispanic / Latino489 91.6% Hispanic or LatinoMoved within same county 1,237 6.0% White / Caucasian126 5.7% Black or African American31 2.1% Two or more races1,269 6.2% White alone, not Hispanic / LatinoMoved within same state 491 2.4% White / Caucasian49 2.2% Black or African American34 2.2% Two or more races484 2.4% White alone, not Hispanic / LatinoMoved from different state 162 0.8% White / Caucasian89 4.0% Black or African American44 83.2% American Indian / Alaska Native162 0.8% White alone, not Hispanic / Latino47 8.8% Hispanic or LatinoMoved from abroad 27 0.1% White29 0.1% White alone, not Hispanic / Latino
Children Nativity (place of birth) in Barberton
Children under 6 years - Living with two parents Both parents native 858 100.0% NativeChildren under 6 years - Living with one parent Native parent 944 100.0% Native
Children 6 to 17 years - Living with two parents Both parents native 1,736 100.0% NativeOne native, one foreign-born parent 35 100.0% NativeChildren 6 to 17 years - Living with one parent Native parent 1,760 100.0% Native
Grandparents responsible for own grandchildren in Barberton
Grandparents (30 to 59 years) White / Caucasian 28 22.8% Responsible for grandchildren94 77.2% Not responsible for grandchildrenWhite alone, not Hispanic / Latino 28 23.0% Responsible for grandchildren94 77.0% Not responsible for grandchildrenGrandparents (60 years and over) White / Caucasian 65 30.5% Responsible for grandchildren149 69.5% Not responsible for grandchildrenWhite alone, not Hispanic / Latino 65 30.4% Responsible for grandchildren149 69.6% Not responsible for grandchildren