Races in Bayonne, New Jersey (NJ) Detailed Stats
Data:
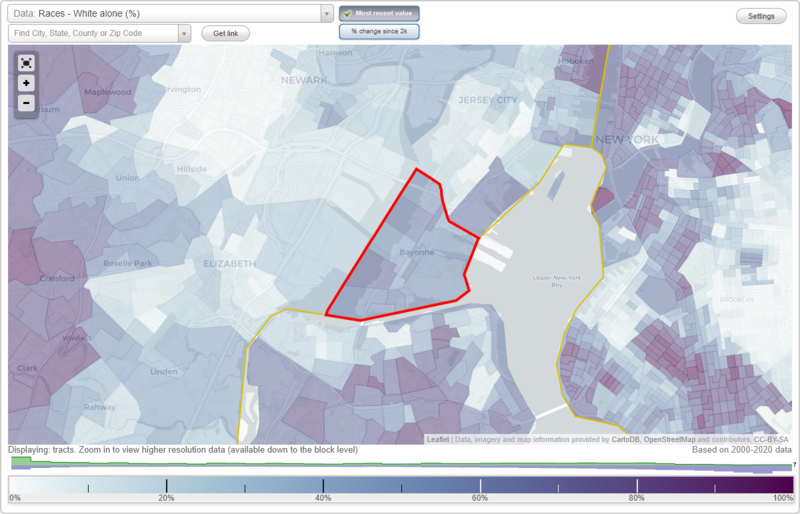
Races - White alone (%)
Races - White alone (% change since 2000)
Races - Black alone (%)
Races - Black alone (% change since 2000)
Races - American Indian alone (%)
Races - American Indian alone (% change since 2000)
Races - Asian alone (%)
Races - Asian alone (% change since 2000)
Races - Hispanic (%)
Races - Hispanic (% change since 2000)
Races - Native Hawaiian and Other Pacific Islander alone (%)
Races - Native Hawaiian and Other Pacific Islander alone (% change since 2000)
Races - Two or more races(%)
Races - Two or more races(% change since 2000)
Races - Other race alone (%)
Races - Other race alone (% change since 2000)
Racial diversity
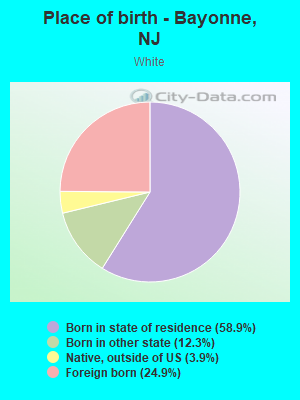
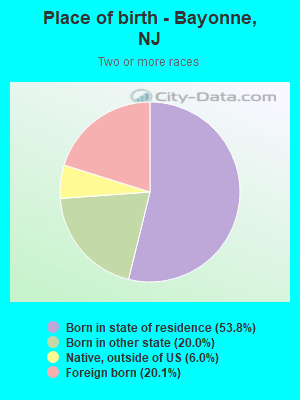
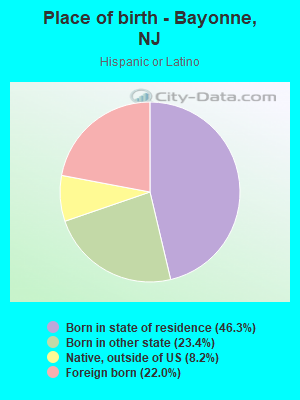
Place of birth - Born in state of residence (%)
Place of birth - Born in state of residence (%) - White
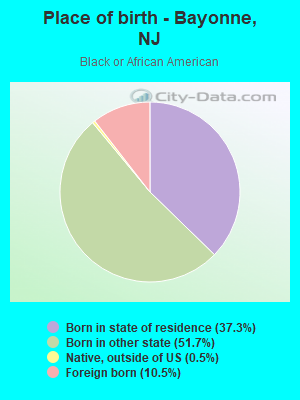
Place of birth - Born in state of residence (%) - Black or African American
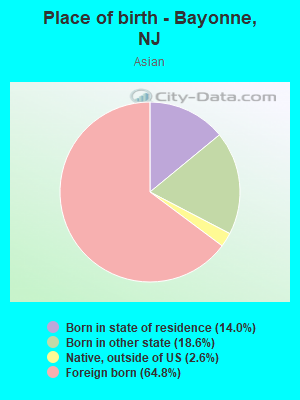
Place of birth - Born in state of residence (%) - Asian
Place of birth - Born in state of residence (%) - Hispanic or Latino
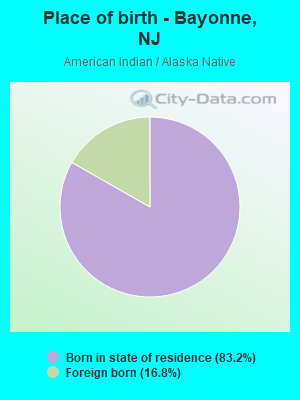
Place of birth - Born in state of residence (%) - American Indian and Alaska Native
Place of birth - Born in state of residence (%) - Multirace
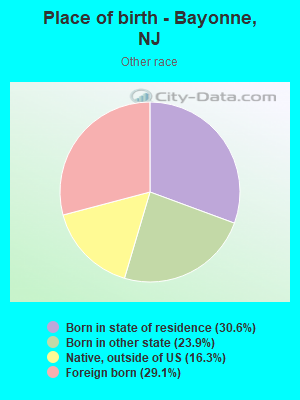
Place of birth - Born in state of residence (%) - Other Race
Place of birth - Born in other state (%)
Place of birth - Born in other state (%) - White
Place of birth - Born in other state (%) - Black or African American
Place of birth - Born in other state (%) - Asian
Place of birth - Born in other state (%) - Hispanic or Latino
Place of birth - Born in other state (%) - American Indian and Alaska Native
Place of birth - Born in other state (%) - Multirace
Place of birth - Born in other state (%) - Other Race
Place of birth - Native, outside of US (%)
Place of birth - Native, outside of US (%) - White
Place of birth - Native, outside of US (%) - Black or African American
Place of birth - Native, outside of US (%) - Asian
Place of birth - Native, outside of US (%) - Hispanic or Latino
Place of birth - Native, outside of US (%) - American Indian and Alaska Native
Place of birth - Native, outside of US (%) - Multirace
Place of birth - Native, outside of US (%) - Other Race
Place of birth - Foreign born (%)
Place of birth - Foreign born (%) - White
Place of birth - Foreign born (%) - Black or African American
Place of birth - Foreign born (%) - Asian
Place of birth - Foreign born (%) - Hispanic or Latino
Place of birth - Foreign born (%) - American Indian and Alaska Native
Place of birth - Foreign born (%) - Multirace
Place of birth - Foreign born (%) - Other Race
Residents speaking English at home (%)
Residents speaking English at home - Born in the United States (%)
Residents speaking English at home - Native, born elsewhere (%)
Residents speaking English at home - Foreign born (%)
Residents speaking Spanish at home (%)
Residents speaking Spanish at home - Born in the United States (%)
Residents speaking Spanish at home - Native, born elsewhere (%)
Residents speaking Spanish at home - Foreign born (%)
Residents speaking other language at home (%)
Residents speaking other language at home - Born in the United States (%)
Residents speaking other language at home - Native, born elsewhere (%)
Residents speaking other language at home - Foreign born (%)
Marital status - Never married (%)
Marital status - Now married (%)
Marital status - Separated (%)
Marital status - Widowed (%)
Marital status - Divorced (%)
Ancestries Reported - Arab (%)
Ancestries Reported - Czech (%)
Ancestries Reported - Danish (%)
Ancestries Reported - Dutch (%)
Ancestries Reported - English (%)
Ancestries Reported - French (%)
Ancestries Reported - French Canadian (%)
Ancestries Reported - German (%)
Ancestries Reported - Greek (%)
Ancestries Reported - Hungarian (%)
Ancestries Reported - Irish (%)
Ancestries Reported - Italian (%)
Ancestries Reported - Lithuanian (%)
Ancestries Reported - Norwegian (%)
Ancestries Reported - Polish (%)
Ancestries Reported - Portuguese (%)
Ancestries Reported - Russian (%)
Ancestries Reported - Scotch-Irish (%)
Ancestries Reported - Scottish (%)
Ancestries Reported - Slovak (%)
Ancestries Reported - Subsaharan African (%)
Ancestries Reported - Swedish (%)
Ancestries Reported - Swiss (%)
Ancestries Reported - Ukrainian (%)
Ancestries Reported - United States (%)
Ancestries Reported - Welsh (%)
Ancestries Reported - West Indian (%)
Ancestries Reported - Other (%)
Geographical mobility - Same house 1 year ago (%)
Geographical mobility - Same house 1 year ago (%) - White
Geographical mobility - Same house 1 year ago (%) - Black or African American
Geographical mobility - Same house 1 year ago (%) - Asian
Geographical mobility - Same house 1 year ago (%) - Hispanic or Latino
Geographical mobility - Same house 1 year ago (%) - American Indian and Alaska Native
Geographical mobility - Same house 1 year ago (%) - Multirace
Geographical mobility - Same house 1 year ago (%) - Other Race
Geographical mobility - Moved within same county (%)
Geographical mobility - Moved within same county (%) - White
Geographical mobility - Moved within same county (%) - Black or African American
Geographical mobility - Moved within same county (%) - Asian
Geographical mobility - Moved within same county (%) - Hispanic or Latino
Geographical mobility - Moved within same county (%) - American Indian and Alaska Native
Geographical mobility - Moved within same county (%) - Multirace
Geographical mobility - Moved within same county (%) - Other Race
Geographical mobility - Moved from different county within same state (%)
Geographical mobility - Moved from different county within same state (%) - White
Geographical mobility - Moved from different county within same state (%) - Black or African American
Geographical mobility - Moved from different county within same state (%) - Asian
Geographical mobility - Moved from different county within same state (%) - Hispanic or Latino
Geographical mobility - Moved from different county within same state (%) - American Indian and Alaska Native
Geographical mobility - Moved from different county within same state (%) - Multirace
Geographical mobility - Moved from different county within same state (%) - Other Race
Geographical mobility - Moved from different state (%)
Geographical mobility - Moved from different state (%) - White
Geographical mobility - Moved from different state (%) - Black or African American
Geographical mobility - Moved from different state (%) - Asian
Geographical mobility - Moved from different state (%) - Hispanic or Latino
Geographical mobility - Moved from different state (%) - American Indian and Alaska Native
Geographical mobility - Moved from different state (%) - Multirace
Geographical mobility - Moved from different state (%) - Other Race
Geographical mobility - Moved from abroad (%)
Geographical mobility - Moved from abroad (%) - White
Geographical mobility - Moved from abroad (%) - Black or African American
Geographical mobility - Moved from abroad (%) - Asian
Geographical mobility - Moved from abroad (%) - Hispanic or Latino
Geographical mobility - Moved from abroad (%) - American Indian and Alaska Native
Geographical mobility - Moved from abroad (%) - Multirace
Geographical mobility - Moved from abroad (%) - Other Race
Place of birth for the foreign-born population - Ireland (%)
Place of birth for the foreign-born population - Denmark (%)
Place of birth for the foreign-born population - Norway (%)
Place of birth for the foreign-born population - Sweden (%)
Place of birth for the foreign-born population - United Kingdom (%)
Place of birth for the foreign-born population - England (%)
Place of birth for the foreign-born population - Scotland (%)
Place of birth for the foreign-born population - Other Northern Europe (%)
Place of birth for the foreign-born population - Austria (%)
Place of birth for the foreign-born population - Belgium (%)
Place of birth for the foreign-born population - France (%)
Place of birth for the foreign-born population - Germany (%)
Place of birth for the foreign-born population - Netherlands (%)
Place of birth for the foreign-born population - Switzerland (%)
Place of birth for the foreign-born population - Other Western Europe (%)
Place of birth for the foreign-born population - Greece (%)
Place of birth for the foreign-born population - Italy (%)
Place of birth for the foreign-born population - Portugal (%)
Place of birth for the foreign-born population - Spain (%)
Place of birth for the foreign-born population - Other Southern Europe (%)
Place of birth for the foreign-born population - Albania (%)
Place of birth for the foreign-born population - Belarus (%)
Place of birth for the foreign-born population - Bosnia and Herzegovina (%)
Place of birth for the foreign-born population - Bulgaria (%)
Place of birth for the foreign-born population - Croatia (%)
Place of birth for the foreign-born population - Czechoslovakia (%)
Place of birth for the foreign-born population - Hungary (%)
Place of birth for the foreign-born population - Latvia (%)
Place of birth for the foreign-born population - Lithuania (%)
Place of birth for the foreign-born population - North Macedonia (Macedonia) (%)
Place of birth for the foreign-born population - Moldova (%)
Place of birth for the foreign-born population - Poland (%)
Place of birth for the foreign-born population - Romania (%)
Place of birth for the foreign-born population - Russia (%)
Place of birth for the foreign-born population - Serbia (%)
Place of birth for the foreign-born population - Ukraine (%)
Place of birth for the foreign-born population - Other Eastern Europe (%)
Place of birth for the foreign-born population - China (%)
Place of birth for the foreign-born population - Hong Kong (%)
Place of birth for the foreign-born population - Taiwan (%)
Place of birth for the foreign-born population - Japan (%)
Place of birth for the foreign-born population - Korea (%)
Place of birth for the foreign-born population - Other Eastern Asia (%)
Place of birth for the foreign-born population - Afghanistan (%)
Place of birth for the foreign-born population - Bangladesh (%)
Place of birth for the foreign-born population - India (%)
Place of birth for the foreign-born population - Iran (%)
Place of birth for the foreign-born population - Kazakhstan (%)
Place of birth for the foreign-born population - Nepal (%)
Place of birth for the foreign-born population - Pakistan (%)
Place of birth for the foreign-born population - Sri Lanka (%)
Place of birth for the foreign-born population - Uzbekistan (%)
Place of birth for the foreign-born population - Other South Central Asia (%)
Place of birth for the foreign-born population - Burma (%)
Place of birth for the foreign-born population - Cambodia (%)
Place of birth for the foreign-born population - Indonesia (%)
Place of birth for the foreign-born population - Laos (%)
Place of birth for the foreign-born population - Malaysia (%)
Place of birth for the foreign-born population - Philippines (%)
Place of birth for the foreign-born population - Singapore (%)
Place of birth for the foreign-born population - Thailand (%)
Place of birth for the foreign-born population - Vietnam (%)
Place of birth for the foreign-born population - Other South Eastern Asia (%)
Place of birth for the foreign-born population - Armenia (%)
Place of birth for the foreign-born population - Iraq (%)
Place of birth for the foreign-born population - Israel (%)
Place of birth for the foreign-born population - Jordan (%)
Place of birth for the foreign-born population - Kuwait (%)
Place of birth for the foreign-born population - Lebanon (%)
Place of birth for the foreign-born population - Saudi Arabia (%)
Place of birth for the foreign-born population - Syria (%)
Place of birth for the foreign-born population - Turkey (%)
Place of birth for the foreign-born population - Yemen (%)
Place of birth for the foreign-born population - Other Western Asia (%)
Place of birth for the foreign-born population - Eritrea (%)
Place of birth for the foreign-born population - Ethiopia (%)
Place of birth for the foreign-born population - Kenya (%)
Place of birth for the foreign-born population - Somalia (%)
Place of birth for the foreign-born population - Uganda (%)
Place of birth for the foreign-born population - Zimbabwe (%)
Place of birth for the foreign-born population - Other Eastern Africa (%)
Place of birth for the foreign-born population - Cameroon (%)
Place of birth for the foreign-born population - Congo (%)
Place of birth for the foreign-born population - Democratic Republic of Congo (Zaire) (%)
Place of birth for the foreign-born population - Other Middle Africa (%)
Place of birth for the foreign-born population - Egypt (%)
Place of birth for the foreign-born population - Morocco (%)
Place of birth for the foreign-born population - Sudan (%)
Place of birth for the foreign-born population - Other Northern Africa (%)
Place of birth for the foreign-born population - South Africa (%)
Place of birth for the foreign-born population - Other Southern Africa (%)
Place of birth for the foreign-born population - Cabo Verde (%)
Place of birth for the foreign-born population - Ghana (%)
Place of birth for the foreign-born population - Liberia (%)
Place of birth for the foreign-born population - Nigeria (%)
Place of birth for the foreign-born population - Senegal (%)
Place of birth for the foreign-born population - Sierra Leone (%)
Place of birth for the foreign-born population - Other Western Africa (%)
Place of birth for the foreign-born population - Australia (%)
Place of birth for the foreign-born population - New Zealand (%)
Place of birth for the foreign-born population - Fiji (%)
Place of birth for the foreign-born population - Micronesia (%)
Place of birth for the foreign-born population - Bahamas (%)
Place of birth for the foreign-born population - Barbados (%)
Place of birth for the foreign-born population - Cuba (%)
Place of birth for the foreign-born population - Dominica (%)
Place of birth for the foreign-born population - Dominican Republic (%)
Place of birth for the foreign-born population - Grenada (%)
Place of birth for the foreign-born population - Haiti (%)
Place of birth for the foreign-born population - Jamaica (%)
Place of birth for the foreign-born population - St. Vincent and the Grenadines (%)
Place of birth for the foreign-born population - Trinidad and Tobago (%)
Place of birth for the foreign-born population - West Indies (%)
Place of birth for the foreign-born population - Other Caribbean (%)
Place of birth for the foreign-born population - Belize (%)
Place of birth for the foreign-born population - Costa Rica (%)
Place of birth for the foreign-born population - El Salvador (%)
Place of birth for the foreign-born population - Guatemala (%)
Place of birth for the foreign-born population - Honduras (%)
Place of birth for the foreign-born population - Mexico (%)
Place of birth for the foreign-born population - Nicaragua (%)
Place of birth for the foreign-born population - Panama (%)
Place of birth for the foreign-born population - Other Central America (%)
Place of birth for the foreign-born population - Argentina (%)
Place of birth for the foreign-born population - Bolivia (%)
Place of birth for the foreign-born population - Brazil (%)
Place of birth for the foreign-born population - Chile (%)
Place of birth for the foreign-born population - Colombia (%)
Place of birth for the foreign-born population - Ecuador (%)
Place of birth for the foreign-born population - Guyana (%)
Place of birth for the foreign-born population - Peru (%)
Place of birth for the foreign-born population - Uruguay (%)
Place of birth for the foreign-born population - Venezuela (%)
Place of birth for the foreign-born population - Other South America (%)
Place of birth for the foreign-born population - Canada (%)
Place of birth for the foreign-born population - Other Northern America (%)
Place of birth for the foreign-born population - Other (%)
Latest news about races in Bayonne, NJ collected exclusively by city-data.com from local newspapers, TV, and radio stations
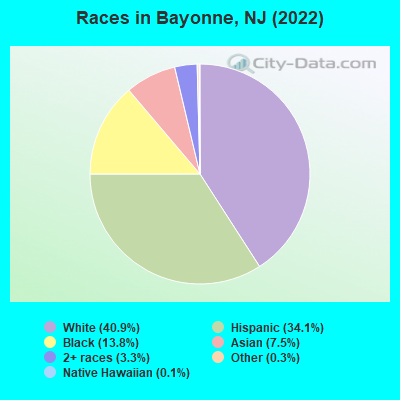
According to 2022 data, the most numerous races in Bayonne, NJ are White alone (28,461 residents), Hispanic (23,676 residents), and Black alone (9,561 residents). 63.3% of Bayonne residents speak English at home. 30.9% of Bayonne, NJ residents are foreign-born (12.5% born in Latin America, 7.3% born in Asia, 6.9% born in Africa, 3.2% born in Europe), which is 25.7% greater than the foreign-born rate of 23.0% across the entire state of New Jersey.
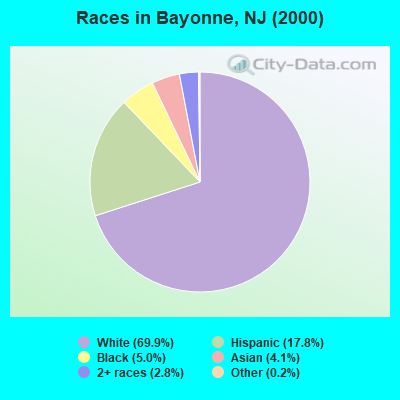
Race distribution in Bayonne
2000 2022
43,217 69.9% White alone 11,015 17.8% Hispanic 3,098 5.0% Black alone 2,529 4.1% Asian alone 1,760 2.8% Two or more races 152 0.2% Other race alone 48 0.08% American Indian alone 23 0.04% Native Hawaiian and Other
28,461 40.9% White alone 23,676 34.1% Hispanic 9,561 13.8% Black alone 5,203 7.5% Asian alone 2,329 3.3% Two or more races 217 0.3% Other race alone 80 0.1% Native Hawaiian and Other
2000 2022
5,557,209 66.0% White alone 1,117,191 13.3% Hispanic 1,096,171 13.0% Black alone 477,012 5.7% Asian alone 133,689 1.6% Two or more races 19,565 0.2% Other race alone 11,338 0.1% American Indian alone 2,175 0.03% Native Hawaiian and Other
4,766,476 51.5% White alone 2,028,470 21.9% Hispanic 1,111,632 12.0% Black alone 923,546 10.0% Asian alone 332,237 3.6% Two or more races 89,847 1.0% Other race alone 8,557 0.09% American Indian alone 934 0.01% Native Hawaiian and Other
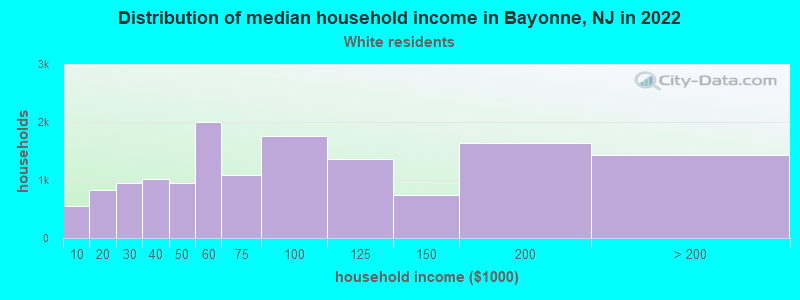
Income and house value in Bayonne Median household income in 2022 $72,764 White non-Hispanic householders$74,665 Black householders$141,250 Asian householders$86,206 Some other race householders$88,158 Two or more races householders$82,923 Hispanic or Latino race householdersMedian 2022 house value $431,612 White Non-Hispanic householders$441,340 Black or African American householders$408,267 American Indian or Alaska Native householders $441,618 Asian householders$431,612 Some other race householders$465,519 Two or more races householders$431,612 Hispanic or Latino householders
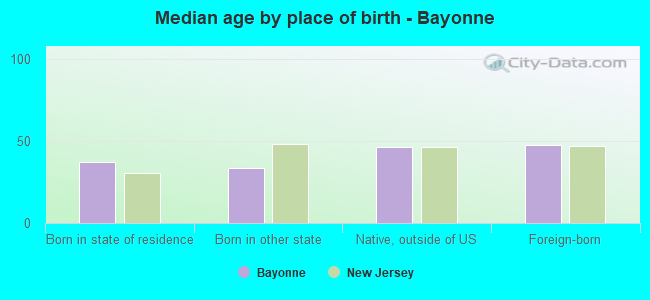
Median age by race in Bayonne
46.0 Median age for White residents44.4 47.8 34.7 Median age for Black or African American residents34.3 35.6 -666,666,666.0 Median age for American Indian / Alaska Native residents-666,666,666.0 -666,666,666.0 36.1 Median age for Asian residents33.8 37.1 -666,666,666.0 Median age for Native Hawaiian / Pacific Islander residents-666,666,666.0 -666,666,666.0 40.3 Median age for Other race residents31.3 40.8 35.7 Median age for Two or more races residents39.0 33.0 47.2 Median age for White alone residents44.7 49.1 35.1 Median age for Hispanic or Latino residents31.8 37.2
Owner/renter occupied households by race in Bayonne
House owners and renters - White residents 6,814 47.6% Owner occupied7,496 52.4% Renter occupiedHouse owners and renters - Black or African American residents 1,127 26.8% Owner occupied3,071 73.2% Renter occupiedHouse owners and renters - American Indian / Alaska Native residents 102 100.0% Renter occupiedHouse owners and renters - Asian residents 970 56.5% Owner occupied748 43.5% Renter occupiedHouse owners and renters - Other race residents 423 15.9% Owner occupied2,236 84.1% Renter occupiedHouse owners and renters - Two or more races residents 1,329 24.1% Owner occupied4,179 75.9% Renter occupiedHouse owners and renters - White alone residents 6,814 50.1% Owner occupied6,782 49.9% Renter occupiedHouse owners and renters - Hispanic or Latino residents 1,602 18.0% Owner occupied7,288 82.0% Renter occupied
Language usage in Bayonne
English speakers - Total 63.3% of residents of Bayonne speak English at home.
16.5% of residents speak Spanish at home 6,685 63.2% Speak English very well3,887 36.8% Speak English less than very well20.2% of residents speak other language at home 9,880 76.5% Speak English very well3,038 23.5% Speak English less than very well
English speakers - Born in the United States 81.1% of residents of Bayonne speak English at home.
10.8% of residents speak Spanish at home 1,214 85.5% Speak English very well206 14.5% Speak English less than very well8.0% of residents speak other language at home 821 78.0% Speak English very well231 22.0% Speak English less than very well
English speakers - Native, born elsewhere 20.8% of residents of Bayonne speak English at home.
54.0% of residents speak Spanish at home 823 45.9% Speak English very well971 54.1% Speak English less than very well25.2% of residents speak other language at home 839 100.0% Speak English very well
English speakers - Foreign-born 16.6% of residents of Bayonne speak English at home.
32.4% of residents speak Spanish at home 2,976 53.7% Speak English very well2,569 46.3% Speak English less than very well51.1% of residents speak other language at home 6,155 70.4% Speak English very well2,591 29.6% Speak English less than very well
White (Caucasian) - Speak only English Native:
84.4% (17,896)Foreign-born:
13.3% (1,003)
White (Caucasian) - Speak another language Native:
15.6% (3,308)Foreign-born:
86.7% (6,527)
Black or African American - Speak only English Native:
97.0% (6,623)Foreign-born:
73.3% (670)
Black or African American - Speak another language Native:
4.4% (303)Foreign-born:
32.8% (300)
American Indian / Alaska Native - Speak only English Native:
23.4% (56)Foreign-born:
40.1% (28)
American Indian / Alaska Native - Speak another language Native:
35.7% (85)Foreign-born:
48.0% (34)
Asian - Speak only English Native:
47.6% (662)Foreign-born:
23.7% (813)
Asian - Speak another language Native:
52.4% (729)Foreign-born:
76.3% (2,619)
Other race - Speak another language Native:
68.4% (2,530)Foreign-born:
100.0% (1,558)
Two or more races - Speak only English Native:
83.6% (9,635)Foreign-born:
2.0% (68)
Two or more races - Speak another language Native:
16.4% (1,891)Foreign-born:
98.0% (3,297)
White alone - Speak only English Native:
84.5% (16,957)Foreign-born:
13.9% (1,003)
White alone - Speak another language Native:
15.5% (3,104)Foreign-born:
86.1% (6,209)
Hispanic or Latino - Speak only English Native:
70.3% (11,355)Foreign-born:
1.3% (68)
Hispanic or Latino - Speak another language Native:
29.7% (4,797)Foreign-born:
98.7% (5,147)
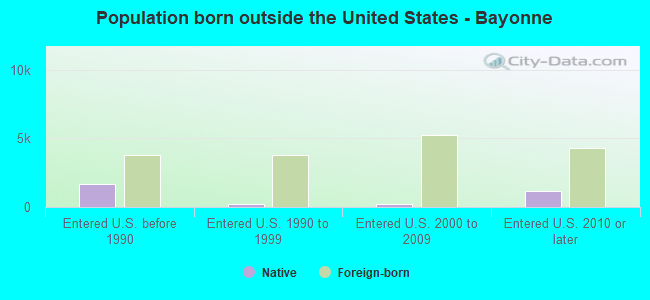
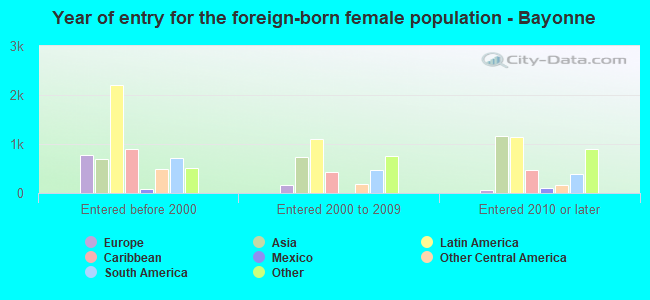
Foreign-born residents in Bayonne 21,546 residents are foreign born (12.5% Latin America , 7.3% Asia , 6.9% Africa , 3.2% Europe ).
This city:
30.9%New Jersey:
23.2%
Marital status for residents in Bayonne Marital status - White (Caucasian) population 15 years and over
Males 39.2% Never married51.8% Now married1.6% Separated1.6% Widowed5.8% DivorcedFemales 28.9% Never married41.0% Now married1.0% Separated14.0% Widowed15.1% DivorcedWomen who gave birth in the past 12 months Now married:
100.0% (96)Unmarried:
0.0% (0)
Women who did not give birth in the past 12 months Now married:
44.0% (2,709)Unmarried:
56.0% (3,451)
Marital status - Black or African American population 15 years and over
Males 55.0% Never married33.7% Now married4.5% Separated0.9% Widowed6.0% DivorcedFemales 55.8% Never married28.9% Now married2.1% Separated5.5% Widowed7.8% DivorcedWomen who gave birth in the past 12 months Now married:
54.8% (33)Unmarried:
45.2% (27)
Women who did not give birth in the past 12 months Now married:
31.6% (700)Unmarried:
68.4% (1,514)
Marital status - American Indian / Alaska Native population 15 years and over
Males 60.0% Never married0.0% Now married40.0% Separated0.0% Widowed0.0% DivorcedFemales 14.8% Never married23.5% Now married0.0% Separated0.0% Widowed61.7% DivorcedWomen who did not give birth in the past 12 months Now married:
29.2% (29)Unmarried:
70.8% (71)
Marital status - Asian population 15 years and over
Males 24.6% Never married71.7% Now married1.5% Separated0.4% Widowed1.7% DivorcedFemales 21.9% Never married62.8% Now married0.9% Separated5.3% Widowed9.0% DivorcedWomen who gave birth in the past 12 months Now married:
82.3% (202)Unmarried:
17.7% (43)
Women who did not give birth in the past 12 months Now married:
65.0% (1,120)Unmarried:
35.0% (603)
Marital status - Other race population 15 years and over
Males 36.1% Never married53.5% Now married1.4% Separated1.0% Widowed8.0% DivorcedFemales 55.0% Never married31.1% Now married1.8% Separated4.3% Widowed7.9% DivorcedWomen who gave birth in the past 12 months Now married:
55.6% (138)Unmarried:
44.4% (110)
Women who did not give birth in the past 12 months Now married:
27.7% (689)Unmarried:
72.3% (1,802)
Marital status - Two or more races population 15 years and over
Males 43.0% Never married30.9% Now married0.8% Separated5.3% Widowed20.1% DivorcedFemales 47.8% Never married21.5% Now married3.0% Separated14.2% Widowed13.4% DivorcedWomen who gave birth in the past 12 months Now married:
78.8% (268)Unmarried:
21.2% (72)
Women who did not give birth in the past 12 months Now married:
23.2% (782)Unmarried:
76.8% (2,587)
Marital status - White alone, not Hispanic / Latino population 15 years and over
Males 39.8% Never married51.3% Now married1.7% Separated1.7% Widowed5.6% DivorcedFemales 27.6% Never married41.3% Now married1.0% Separated14.7% Widowed15.4% DivorcedWomen who gave birth in the past 12 months Now married:
100.0% (96)Unmarried:
0.0% (0)
Women who did not give birth in the past 12 months Now married:
46.6% (2,665)Unmarried:
53.4% (3,052)
Marital status - Hispanic or Latino population 15 years and over
Males 43.1% Never married34.2% Now married0.6% Separated4.7% Widowed17.3% DivorcedFemales 53.1% Never married26.2% Now married1.8% Separated7.9% Widowed10.9% DivorcedWomen who gave birth in the past 12 months Now married:
100.0% (324)Unmarried:
0.0% (0)
Women who did not give birth in the past 12 months Now married:
24.8% (1,489)Unmarried:
75.2% (4,521)
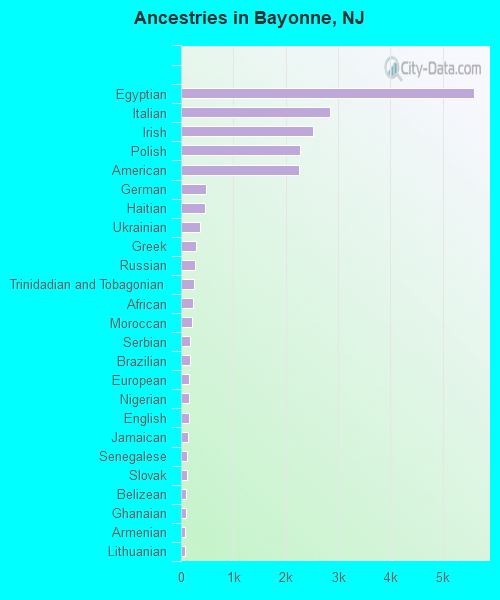
Ancestries in Bayonne
5,603 12.4% Egyptian2,848 6.3% Italian2,530 5.6% Irish2,264 5.0% Polish2,256 5.0% American476 1.1% German457 1.0% Haitian370 0.8% Ukrainian287 0.6% Greek267 0.6% Russian241 0.5% Trinidadian and Tobagonian228 0.5% African210 0.5% Moroccan176 0.4% Serbian170 0.4% Brazilian150 0.3% European148 0.3% Nigerian148 0.3% English130 0.3% Jamaican113 0.3% Senegalese112 0.2% Slovak104 0.2% Belizean86 0.2% Ghanaian80 0.2% Armenian75 0.2% Lithuanian66 0.1% Barbadian59 0.1% French59 0.1% Czech57 0.1% Guyanese53 0.1% Romanian46 0.1% Portuguese42 0.09% Eastern European39 0.09% Palestinian37 0.08% Liberian35 0.08% Belgian34 0.08% Israeli33 0.07% Czechoslovakian31 0.07% Turkish30 0.07% Scottish30 0.07% Croatian28 0.06% Maltese26 0.06% British West Indian25 0.06% Afghan25 0.06% Iranian22 0.05% Scotch-Irish22 0.05% Bermudan21 0.05% British18 0.04% Canadian15 0.03% Arab13 0.03% Hungarian10 0.02% Swedish7 0.02% French Canadian6 0.01% Carpatho Rusyn6 0.01% West Indian3 0.01% Northern European3 0.01% Norwegian
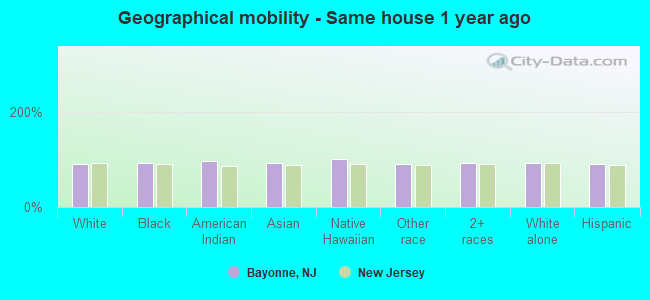
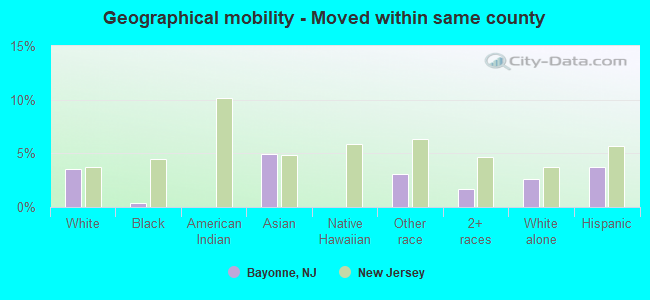
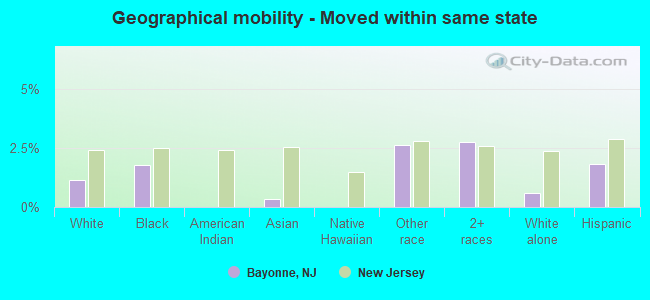
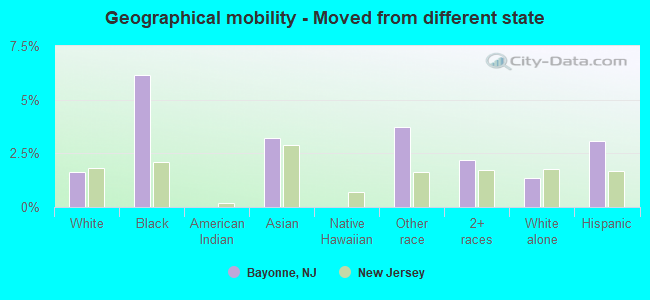
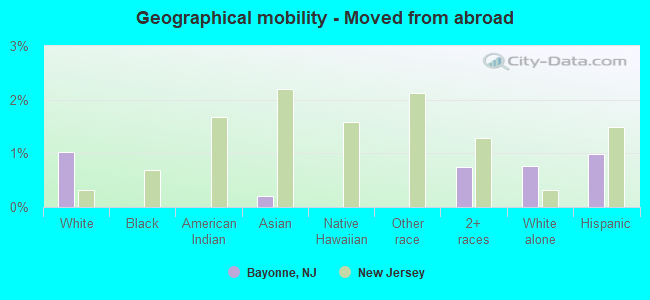
Geographical mobility in Bayonne Same house 1 year ago 25,407 90.4% White (Caucasian)10,859 91.7% Black or African American306 96.6% American Indian / Alaska Native6,599 91.7% Asian17 100.0% Native Hawaiian / Pacific Islander7,228 89.7% Other race11,891 92.7% Two or more races25,728 93.2% White alone, not Hispanic / Latino21,456 90.4% Hispanic or LatinoMoved within same county 987 3.5% White / Caucasian43 0.4% Black or African American356 5.0% Asian244 3.0% Other race220 1.7% Two or more races711 2.6% White alone, not Hispanic / Latino876 3.7% Hispanic or LatinoMoved within same state 319 1.1% White / Caucasian210 1.8% Black or African American25 0.3% Asian212 2.6% Other race354 2.8% Two or more races168 0.6% White alone, not Hispanic / Latino429 1.8% Hispanic or LatinoMoved from different state 464 1.7% White / Caucasian729 6.2% Black or African American230 3.2% Asian300 3.7% Other race282 2.2% Two or more races368 1.3% White alone, not Hispanic / Latino730 3.1% Hispanic or LatinoMoved from abroad 286 1.0% White15 0.2% Asian96 0.7% Two or more races209 0.8% White alone, not Hispanic / Latino235 1.0% Hispanic or Latino
Children Nativity (place of birth) in Bayonne
Children under 6 years - Living with two parents Both parents native 1,755 100.0% NativeBoth parents foreign-born 737 100.0% NativeOne native, one foreign-born parent 490 100.0% NativeChildren under 6 years - Living with one parent Native parent 3,001 100.0% NativeForeign-born parent 494 91.7% Native45 8.3% Foreign-bornChildren 6 to 17 years - Living with two parents Both parents native 2,678 100.0% NativeBoth parents foreign-born 1,814 78.2% Native505 21.8% Foreign-bornOne native, one foreign-born parent 432 100.0% NativeChildren 6 to 17 years - Living with one parent Native parent 2,559 100.0% NativeForeign-born parent 1,087 50.8% Native1,053 49.2% Foreign-born
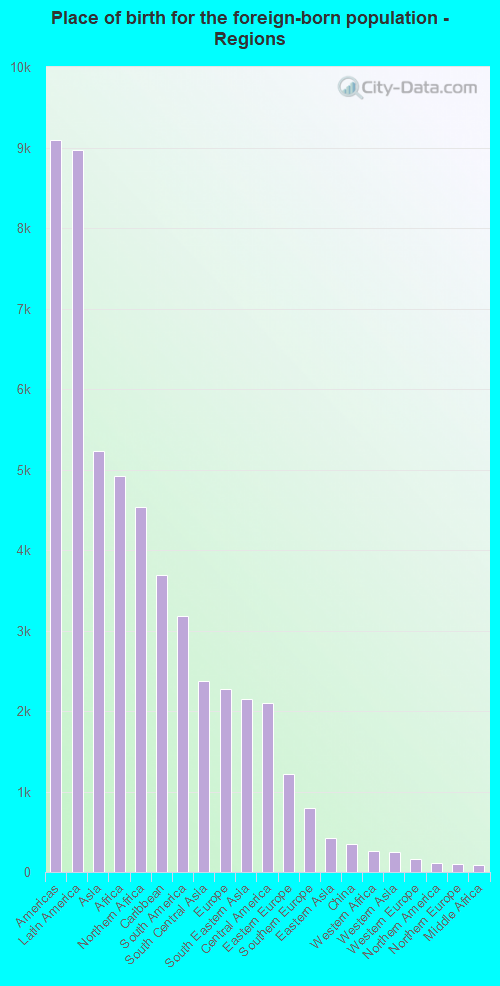
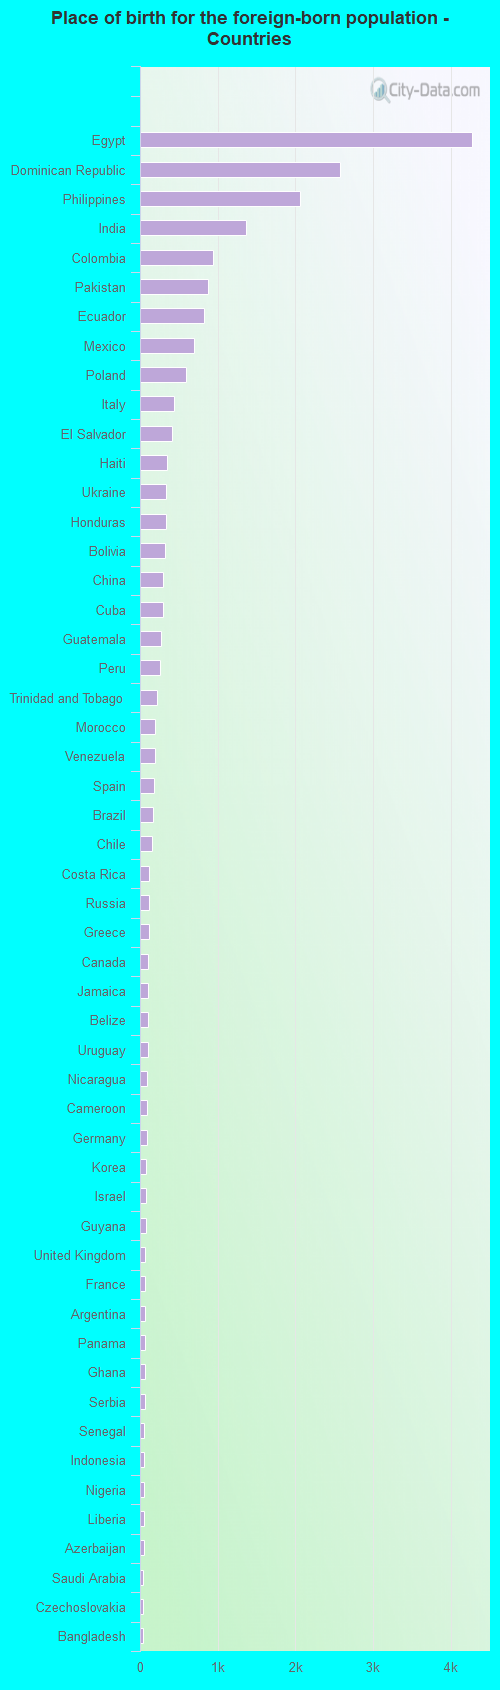
Place of birth for residents in Bayonne 9,087 Americas8,969 Latin America5,224 Asia4,918 Africa4,528 Northern Africa3,688 Caribbean3,178 South America2,378 South Central Asia2,274 Europe2,151 South Eastern Asia2,102 Central America1,221 Eastern Europe796 Southern Europe422 Eastern Asia342 China260 Western Africa245 Western Asia162 Western Europe117 Northern America94 Northern Europe90 Middle Africa41 Oceania26 Eastern Africa13 Southern Africa4,280 Egypt2,571 Dominican Republic2,060 Philippines1,368 India939 Colombia880 Pakistan829 Ecuador696 Mexico588 Poland433 Italy417 El Salvador345 Haiti340 Ukraine329 Honduras319 Bolivia291 China290 Cuba275 Guatemala253 Peru218 Trinidad and Tobago199 Morocco190 Venezuela181 Spain162 Brazil158 Chile120 Costa Rica117 Russia116 Greece107 Canada104 Jamaica101 Belize99 Uruguay94 Nicaragua90 Cameroon85 Germany80 Korea75 Israel74 Guyana68 United Kingdom67 France66 Argentina66 Panama63 Ghana59 Serbia56 Senegal53 Indonesia53 Nigeria52 Liberia51 Azerbaijan44 Saudi Arabia43 Czechoslovakia40 Bangladesh37 Uzbekistan34 Barbados31 Croatia27 Algeria26 Hong Kong26 Afghanistan25 Romania24 Taiwan24 Zimbabwe21 United Arab Emirates21 Sudan19 Kuwait16 Ireland16 Portugal15 Malaysia15 St. Lucia14 Vietnam13 Sri Lanka13 Belarus13 South Africa11 Iran10 Belgium10 England9 Cabo Verde9 Iraq7 Thailand4 Sierra Leone2 Ethiopia
Grandparents responsible for own grandchildren in Bayonne
Grandparents (30 to 59 years) White / Caucasian 135 100.0% Not responsible for grandchildrenBlack or African American 84 68.9% Responsible for grandchildren38 31.1% Not responsible for grandchildrenAsian 10 28.0% Responsible for grandchildren26 72.0% Not responsible for grandchildrenOther race 25 17.4% Responsible for grandchildren117 82.6% Not responsible for grandchildrenTwo or more races 73 24.2% Responsible for grandchildren228 75.8% Not responsible for grandchildrenWhite alone, not Hispanic / Latino 126 100.0% Not responsible for grandchildrenHispanic or Latino 68 18.7% Responsible for grandchildren295 81.3% Not responsible for grandchildrenGrandparents (60 years and over) White / Caucasian 125 29.1% Responsible for grandchildren305 70.9% Not responsible for grandchildrenBlack or African American 18 20.1% Responsible for grandchildren71 79.9% Not responsible for grandchildrenAsian 13 6.4% Responsible for grandchildren188 93.6% Not responsible for grandchildrenOther race 10 4.1% Responsible for grandchildren231 95.9% Not responsible for grandchildrenTwo or more races 235 100.0% Not responsible for grandchildrenWhite alone, not Hispanic / Latino 128 31.4% Responsible for grandchildren279 68.6% Not responsible for grandchildrenHispanic or Latino 17 4.1% Responsible for grandchildren389 95.9% Not responsible for grandchildren