Races in Beals, Maine (ME) Detailed Stats
Ancestries, Foreign-born residents, place of birth

Recent posts about races in Beals, Maine on our local forum with over 2,400,000 registered users:
 | Vacation in Milbridge area (17 replies) |
| puzzled with attitude towards Maine (175 replies) |
| I just don't get it! (131 replies) |
| Jonesport...in 3 words or less (35 replies) |
| Please, need info and pics of Jonesport Maine, show off your town! (13 replies) |
0.3% of Beals, ME residents are foreign-born , which is 827.0% less than the foreign-born rate of 3.0% across the entire state of Maine.
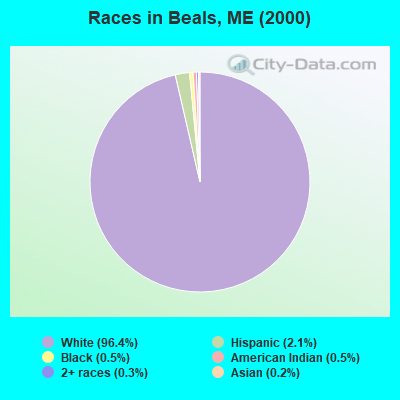
Race distribution in Beals

- 59696.4%White alone
- 132.1%Hispanic
- 30.5%Black alone
- 30.5%American Indian alone
- 20.3%Two or more races
- 10.2%Asian alone
2000
2022
-
- 1,230,29796.5%White alone
- 11,7310.9%Two or more races
- 9,3600.7%Hispanic
- 9,0140.7%Asian alone
- 6,4400.5%Black alone
- 6,9110.5%American Indian alone
- 8360.07%Other race alone
- 3340.03%Native Hawaiian and Other
Pacific Islander alone

-
- 1,249,23390.2%White alone
- 58,3574.2%Two or more races
- 28,7172.1%Hispanic
- 21,5831.6%Black alone
- 16,1511.2%Asian alone
- 5,8730.4%Other race alone
- 5,2050.4%American Indian alone
- 2210.02%Native Hawaiian and Other
Pacific Islander alone

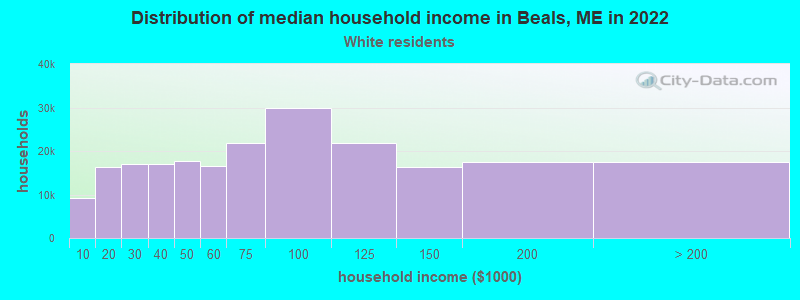
Income and house value in Beals
- Median household income in 2022
- $55,251White non-Hispanic householders
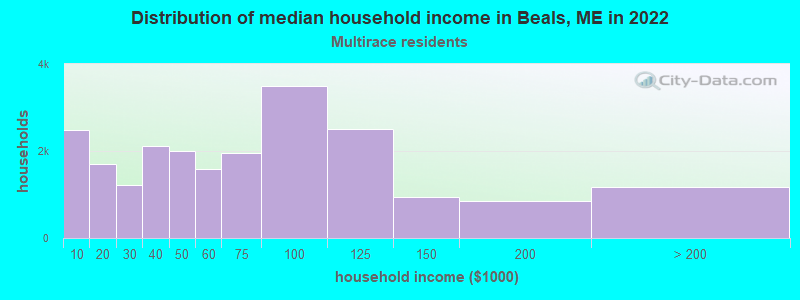
- $97,678Two or more races householders
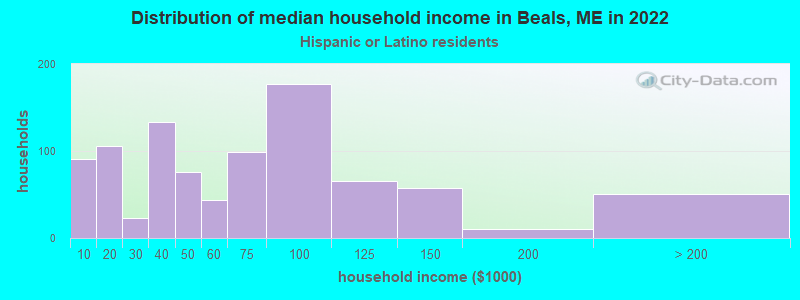
- $4,342Hispanic or Latino race householders
- Median 2022 house value
- $202,979White Non-Hispanic householders
Household income for White non-Hispanic householders
Household income for Two or more races householders
Household income for Hispanic or Latino race householders
Foreign-born residents in Beals
2 residents are foreign born
| This city: | 0.3% |
| Maine: | 2.9% |
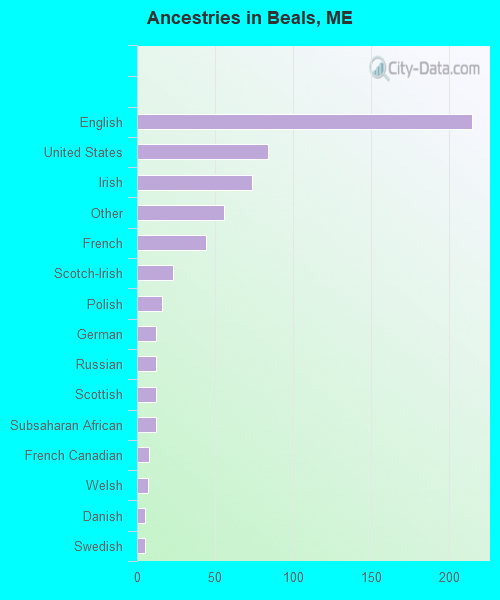
Ancestries in Beals

- 21536.8%English
- 8414.4%United States
- 7412.6%Irish
- 569.6%Other
- 447.5%French
- 233.9%Scotch-Irish
- 162.7%Polish
- 122.1%German
- 122.1%Russian
- 122.1%Scottish
- 122.1%Subsaharan African
- 81.4%French Canadian
- 71.2%Welsh
- 50.9%Danish
- 50.9%Swedish
Zip codes: 04611.