Races in Belfast, New York (NY) Detailed Stats
Ancestries, Foreign-born residents, place of birth
Data:
Latest news about races in Belfast, NY collected exclusively by city-data.com from local newspapers, TV, and radio stations
1.8% of Belfast, NY residents are foreign-born , which is 1116.4% less than the foreign-born rate of 22.0% across the entire state of New York.
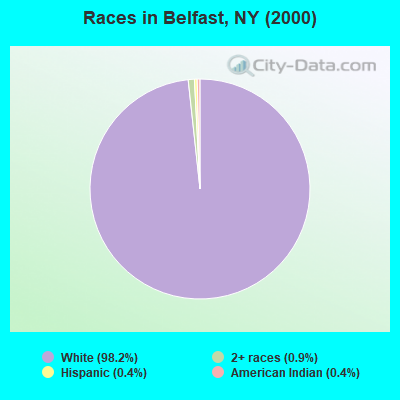
Race distribution in Belfast

- 1,68398.2%White alone
- 160.9%Two or more races
- 70.4%Hispanic
- 60.4%American Indian alone
- 10.06%Black alone
- 10.06%Asian alone
2000
2022
-
- 11,760,98162.0%White alone
- 2,867,58315.1%Hispanic
- 2,812,62314.8%Black alone
- 1,035,9265.5%Asian alone
- 366,1161.9%Two or more races
- 75,4990.4%Other race alone
- 52,4990.3%American Indian alone
- 5,2300.03%Native Hawaiian and Other
Pacific Islander alone
-
- 10,408,93352.9%White alone
- 3,867,29919.7%Hispanic
- 2,633,84013.4%Black alone
- 1,776,2869.0%Asian alone
- 732,6703.7%Two or more races
- 216,1101.1%Other race alone
- 35,0820.2%American Indian alone
- 6,9310.04%Native Hawaiian and Other
Pacific Islander alone
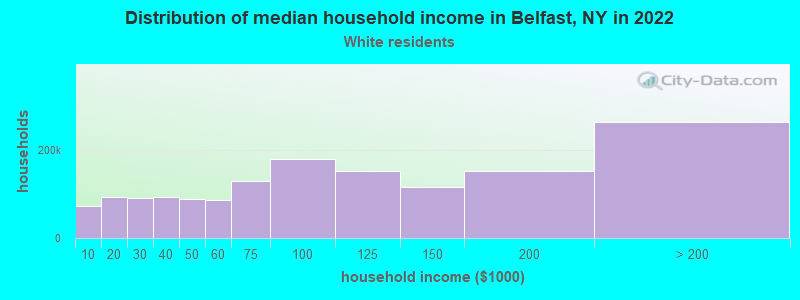
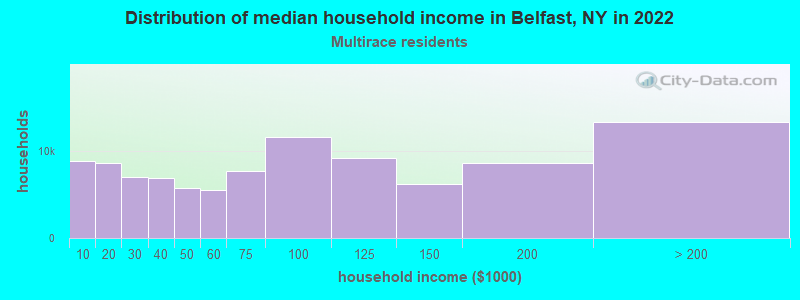
Income and house value in Belfast
- Median household income in 2022
- $55,875White non-Hispanic householders
- $20,870Two or more races householders
- Median 2022 house value
- $88,443White Non-Hispanic householders
- $85,223Two or more races householders
Foreign-born residents in Belfast
31 residents are foreign born
| This city: | 1.8% |
| New York: | 20.4% |
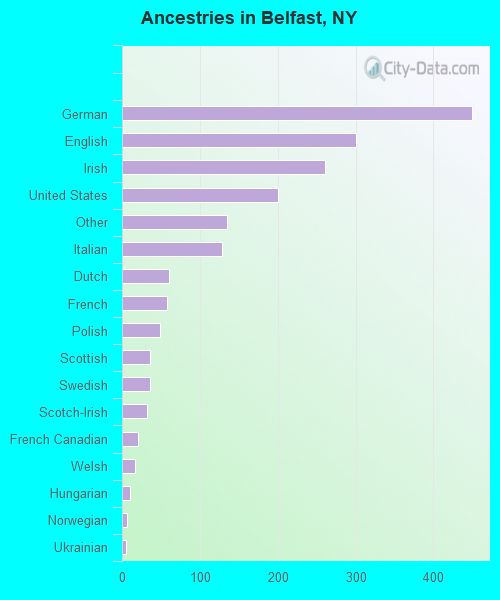
Ancestries in Belfast

- 44924.7%German
- 30116.6%English
- 26114.4%Irish
- 20111.1%United States
- 1357.4%Other
- 1287.1%Italian
- 613.4%Dutch
- 583.2%French
- 492.7%Polish
- 362.0%Scottish
- 362.0%Swedish
- 321.8%Scotch-Irish
- 211.2%French Canadian
- 170.9%Welsh
- 100.6%Hungarian
- 70.4%Norwegian
- 50.3%Ukrainian
- 30.2%Arab
- 20.1%Czech
- 20.1%Slovak
- 10.06%Greek