Races in Bellevue, Nebraska (NE) Detailed Stats
Data:
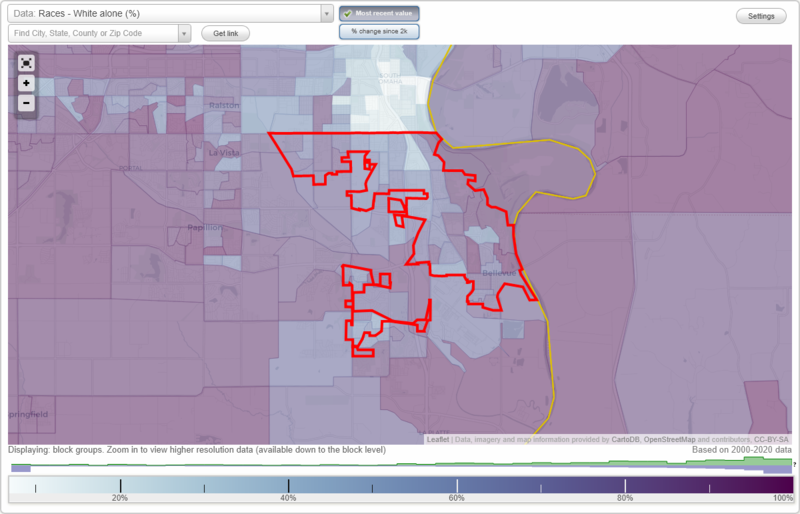
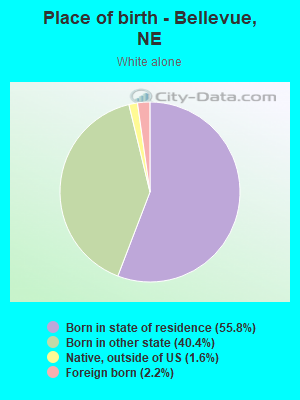
Races - White alone (%)
Races - White alone (% change since 2000)
Races - Black alone (%)
Races - Black alone (% change since 2000)
Races - American Indian alone (%)
Races - American Indian alone (% change since 2000)
Races - Asian alone (%)
Races - Asian alone (% change since 2000)
Races - Hispanic (%)
Races - Hispanic (% change since 2000)
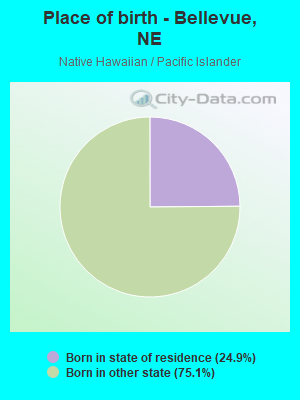
Races - Native Hawaiian and Other Pacific Islander alone (%)
Races - Native Hawaiian and Other Pacific Islander alone (% change since 2000)
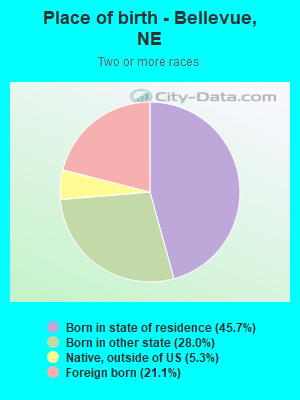
Races - Two or more races(%)
Races - Two or more races(% change since 2000)
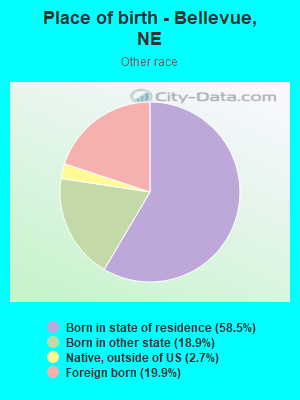
Races - Other race alone (%)
Races - Other race alone (% change since 2000)
Racial diversity
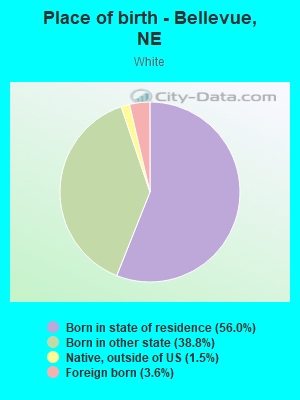
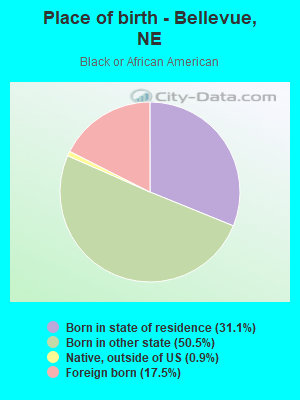
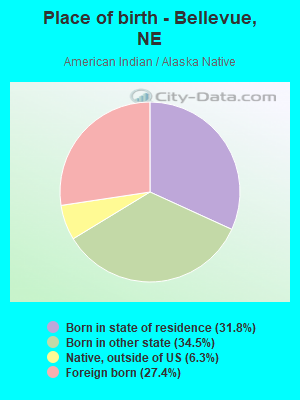
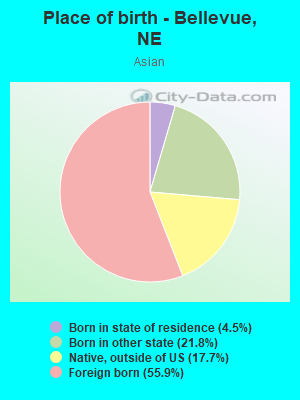
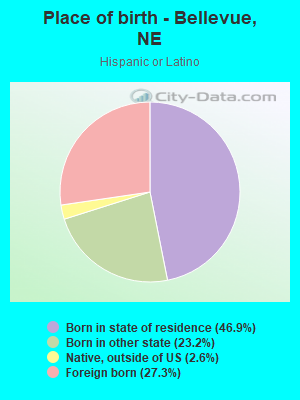
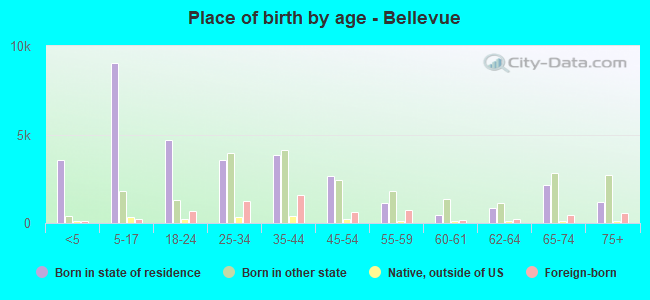
Place of birth - Born in state of residence (%)
Place of birth - Born in state of residence (%) - White
Place of birth - Born in state of residence (%) - Black or African American
Place of birth - Born in state of residence (%) - Asian
Place of birth - Born in state of residence (%) - Hispanic or Latino
Place of birth - Born in state of residence (%) - American Indian and Alaska Native
Place of birth - Born in state of residence (%) - Multirace
Place of birth - Born in state of residence (%) - Other Race
Place of birth - Born in other state (%)
Place of birth - Born in other state (%) - White
Place of birth - Born in other state (%) - Black or African American
Place of birth - Born in other state (%) - Asian
Place of birth - Born in other state (%) - Hispanic or Latino
Place of birth - Born in other state (%) - American Indian and Alaska Native
Place of birth - Born in other state (%) - Multirace
Place of birth - Born in other state (%) - Other Race
Place of birth - Native, outside of US (%)
Place of birth - Native, outside of US (%) - White
Place of birth - Native, outside of US (%) - Black or African American
Place of birth - Native, outside of US (%) - Asian
Place of birth - Native, outside of US (%) - Hispanic or Latino
Place of birth - Native, outside of US (%) - American Indian and Alaska Native
Place of birth - Native, outside of US (%) - Multirace
Place of birth - Native, outside of US (%) - Other Race
Place of birth - Foreign born (%)
Place of birth - Foreign born (%) - White
Place of birth - Foreign born (%) - Black or African American
Place of birth - Foreign born (%) - Asian
Place of birth - Foreign born (%) - Hispanic or Latino
Place of birth - Foreign born (%) - American Indian and Alaska Native
Place of birth - Foreign born (%) - Multirace
Place of birth - Foreign born (%) - Other Race
Residents speaking English at home (%)
Residents speaking English at home - Born in the United States (%)
Residents speaking English at home - Native, born elsewhere (%)
Residents speaking English at home - Foreign born (%)
Residents speaking Spanish at home (%)
Residents speaking Spanish at home - Born in the United States (%)
Residents speaking Spanish at home - Native, born elsewhere (%)
Residents speaking Spanish at home - Foreign born (%)
Residents speaking other language at home (%)
Residents speaking other language at home - Born in the United States (%)
Residents speaking other language at home - Native, born elsewhere (%)
Residents speaking other language at home - Foreign born (%)
Marital status - Never married (%)
Marital status - Now married (%)
Marital status - Separated (%)
Marital status - Widowed (%)
Marital status - Divorced (%)
Ancestries Reported - Arab (%)
Ancestries Reported - Czech (%)
Ancestries Reported - Danish (%)
Ancestries Reported - Dutch (%)
Ancestries Reported - English (%)
Ancestries Reported - French (%)
Ancestries Reported - French Canadian (%)
Ancestries Reported - German (%)
Ancestries Reported - Greek (%)
Ancestries Reported - Hungarian (%)
Ancestries Reported - Irish (%)
Ancestries Reported - Italian (%)
Ancestries Reported - Lithuanian (%)
Ancestries Reported - Norwegian (%)
Ancestries Reported - Polish (%)
Ancestries Reported - Portuguese (%)
Ancestries Reported - Russian (%)
Ancestries Reported - Scotch-Irish (%)
Ancestries Reported - Scottish (%)
Ancestries Reported - Slovak (%)
Ancestries Reported - Subsaharan African (%)
Ancestries Reported - Swedish (%)
Ancestries Reported - Swiss (%)
Ancestries Reported - Ukrainian (%)
Ancestries Reported - United States (%)
Ancestries Reported - Welsh (%)
Ancestries Reported - West Indian (%)
Ancestries Reported - Other (%)
Geographical mobility - Same house 1 year ago (%)
Geographical mobility - Same house 1 year ago (%) - White
Geographical mobility - Same house 1 year ago (%) - Black or African American
Geographical mobility - Same house 1 year ago (%) - Asian
Geographical mobility - Same house 1 year ago (%) - Hispanic or Latino
Geographical mobility - Same house 1 year ago (%) - American Indian and Alaska Native
Geographical mobility - Same house 1 year ago (%) - Multirace
Geographical mobility - Same house 1 year ago (%) - Other Race
Geographical mobility - Moved within same county (%)
Geographical mobility - Moved within same county (%) - White
Geographical mobility - Moved within same county (%) - Black or African American
Geographical mobility - Moved within same county (%) - Asian
Geographical mobility - Moved within same county (%) - Hispanic or Latino
Geographical mobility - Moved within same county (%) - American Indian and Alaska Native
Geographical mobility - Moved within same county (%) - Multirace
Geographical mobility - Moved within same county (%) - Other Race
Geographical mobility - Moved from different county within same state (%)
Geographical mobility - Moved from different county within same state (%) - White
Geographical mobility - Moved from different county within same state (%) - Black or African American
Geographical mobility - Moved from different county within same state (%) - Asian
Geographical mobility - Moved from different county within same state (%) - Hispanic or Latino
Geographical mobility - Moved from different county within same state (%) - American Indian and Alaska Native
Geographical mobility - Moved from different county within same state (%) - Multirace
Geographical mobility - Moved from different county within same state (%) - Other Race
Geographical mobility - Moved from different state (%)
Geographical mobility - Moved from different state (%) - White
Geographical mobility - Moved from different state (%) - Black or African American
Geographical mobility - Moved from different state (%) - Asian
Geographical mobility - Moved from different state (%) - Hispanic or Latino
Geographical mobility - Moved from different state (%) - American Indian and Alaska Native
Geographical mobility - Moved from different state (%) - Multirace
Geographical mobility - Moved from different state (%) - Other Race
Geographical mobility - Moved from abroad (%)
Geographical mobility - Moved from abroad (%) - White
Geographical mobility - Moved from abroad (%) - Black or African American
Geographical mobility - Moved from abroad (%) - Asian
Geographical mobility - Moved from abroad (%) - Hispanic or Latino
Geographical mobility - Moved from abroad (%) - American Indian and Alaska Native
Geographical mobility - Moved from abroad (%) - Multirace
Geographical mobility - Moved from abroad (%) - Other Race
Place of birth for the foreign-born population - Ireland (%)
Place of birth for the foreign-born population - Denmark (%)
Place of birth for the foreign-born population - Norway (%)
Place of birth for the foreign-born population - Sweden (%)
Place of birth for the foreign-born population - United Kingdom (%)
Place of birth for the foreign-born population - England (%)
Place of birth for the foreign-born population - Scotland (%)
Place of birth for the foreign-born population - Other Northern Europe (%)
Place of birth for the foreign-born population - Austria (%)
Place of birth for the foreign-born population - Belgium (%)
Place of birth for the foreign-born population - France (%)
Place of birth for the foreign-born population - Germany (%)
Place of birth for the foreign-born population - Netherlands (%)
Place of birth for the foreign-born population - Switzerland (%)
Place of birth for the foreign-born population - Other Western Europe (%)
Place of birth for the foreign-born population - Greece (%)
Place of birth for the foreign-born population - Italy (%)
Place of birth for the foreign-born population - Portugal (%)
Place of birth for the foreign-born population - Spain (%)
Place of birth for the foreign-born population - Other Southern Europe (%)
Place of birth for the foreign-born population - Albania (%)
Place of birth for the foreign-born population - Belarus (%)
Place of birth for the foreign-born population - Bosnia and Herzegovina (%)
Place of birth for the foreign-born population - Bulgaria (%)
Place of birth for the foreign-born population - Croatia (%)
Place of birth for the foreign-born population - Czechoslovakia (%)
Place of birth for the foreign-born population - Hungary (%)
Place of birth for the foreign-born population - Latvia (%)
Place of birth for the foreign-born population - Lithuania (%)
Place of birth for the foreign-born population - North Macedonia (Macedonia) (%)
Place of birth for the foreign-born population - Moldova (%)
Place of birth for the foreign-born population - Poland (%)
Place of birth for the foreign-born population - Romania (%)
Place of birth for the foreign-born population - Russia (%)
Place of birth for the foreign-born population - Serbia (%)
Place of birth for the foreign-born population - Ukraine (%)
Place of birth for the foreign-born population - Other Eastern Europe (%)
Place of birth for the foreign-born population - China (%)
Place of birth for the foreign-born population - Hong Kong (%)
Place of birth for the foreign-born population - Taiwan (%)
Place of birth for the foreign-born population - Japan (%)
Place of birth for the foreign-born population - Korea (%)
Place of birth for the foreign-born population - Other Eastern Asia (%)
Place of birth for the foreign-born population - Afghanistan (%)
Place of birth for the foreign-born population - Bangladesh (%)
Place of birth for the foreign-born population - India (%)
Place of birth for the foreign-born population - Iran (%)
Place of birth for the foreign-born population - Kazakhstan (%)
Place of birth for the foreign-born population - Nepal (%)
Place of birth for the foreign-born population - Pakistan (%)
Place of birth for the foreign-born population - Sri Lanka (%)
Place of birth for the foreign-born population - Uzbekistan (%)
Place of birth for the foreign-born population - Other South Central Asia (%)
Place of birth for the foreign-born population - Burma (%)
Place of birth for the foreign-born population - Cambodia (%)
Place of birth for the foreign-born population - Indonesia (%)
Place of birth for the foreign-born population - Laos (%)
Place of birth for the foreign-born population - Malaysia (%)
Place of birth for the foreign-born population - Philippines (%)
Place of birth for the foreign-born population - Singapore (%)
Place of birth for the foreign-born population - Thailand (%)
Place of birth for the foreign-born population - Vietnam (%)
Place of birth for the foreign-born population - Other South Eastern Asia (%)
Place of birth for the foreign-born population - Armenia (%)
Place of birth for the foreign-born population - Iraq (%)
Place of birth for the foreign-born population - Israel (%)
Place of birth for the foreign-born population - Jordan (%)
Place of birth for the foreign-born population - Kuwait (%)
Place of birth for the foreign-born population - Lebanon (%)
Place of birth for the foreign-born population - Saudi Arabia (%)
Place of birth for the foreign-born population - Syria (%)
Place of birth for the foreign-born population - Turkey (%)
Place of birth for the foreign-born population - Yemen (%)
Place of birth for the foreign-born population - Other Western Asia (%)
Place of birth for the foreign-born population - Eritrea (%)
Place of birth for the foreign-born population - Ethiopia (%)
Place of birth for the foreign-born population - Kenya (%)
Place of birth for the foreign-born population - Somalia (%)
Place of birth for the foreign-born population - Uganda (%)
Place of birth for the foreign-born population - Zimbabwe (%)
Place of birth for the foreign-born population - Other Eastern Africa (%)
Place of birth for the foreign-born population - Cameroon (%)
Place of birth for the foreign-born population - Congo (%)
Place of birth for the foreign-born population - Democratic Republic of Congo (Zaire) (%)
Place of birth for the foreign-born population - Other Middle Africa (%)
Place of birth for the foreign-born population - Egypt (%)
Place of birth for the foreign-born population - Morocco (%)
Place of birth for the foreign-born population - Sudan (%)
Place of birth for the foreign-born population - Other Northern Africa (%)
Place of birth for the foreign-born population - South Africa (%)
Place of birth for the foreign-born population - Other Southern Africa (%)
Place of birth for the foreign-born population - Cabo Verde (%)
Place of birth for the foreign-born population - Ghana (%)
Place of birth for the foreign-born population - Liberia (%)
Place of birth for the foreign-born population - Nigeria (%)
Place of birth for the foreign-born population - Senegal (%)
Place of birth for the foreign-born population - Sierra Leone (%)
Place of birth for the foreign-born population - Other Western Africa (%)
Place of birth for the foreign-born population - Australia (%)
Place of birth for the foreign-born population - New Zealand (%)
Place of birth for the foreign-born population - Fiji (%)
Place of birth for the foreign-born population - Micronesia (%)
Place of birth for the foreign-born population - Bahamas (%)
Place of birth for the foreign-born population - Barbados (%)
Place of birth for the foreign-born population - Cuba (%)
Place of birth for the foreign-born population - Dominica (%)
Place of birth for the foreign-born population - Dominican Republic (%)
Place of birth for the foreign-born population - Grenada (%)
Place of birth for the foreign-born population - Haiti (%)
Place of birth for the foreign-born population - Jamaica (%)
Place of birth for the foreign-born population - St. Vincent and the Grenadines (%)
Place of birth for the foreign-born population - Trinidad and Tobago (%)
Place of birth for the foreign-born population - West Indies (%)
Place of birth for the foreign-born population - Other Caribbean (%)
Place of birth for the foreign-born population - Belize (%)
Place of birth for the foreign-born population - Costa Rica (%)
Place of birth for the foreign-born population - El Salvador (%)
Place of birth for the foreign-born population - Guatemala (%)
Place of birth for the foreign-born population - Honduras (%)
Place of birth for the foreign-born population - Mexico (%)
Place of birth for the foreign-born population - Nicaragua (%)
Place of birth for the foreign-born population - Panama (%)
Place of birth for the foreign-born population - Other Central America (%)
Place of birth for the foreign-born population - Argentina (%)
Place of birth for the foreign-born population - Bolivia (%)
Place of birth for the foreign-born population - Brazil (%)
Place of birth for the foreign-born population - Chile (%)
Place of birth for the foreign-born population - Colombia (%)
Place of birth for the foreign-born population - Ecuador (%)
Place of birth for the foreign-born population - Guyana (%)
Place of birth for the foreign-born population - Peru (%)
Place of birth for the foreign-born population - Uruguay (%)
Place of birth for the foreign-born population - Venezuela (%)
Place of birth for the foreign-born population - Other South America (%)
Place of birth for the foreign-born population - Canada (%)
Place of birth for the foreign-born population - Other Northern America (%)
Place of birth for the foreign-born population - Other (%)
Latest news about races in Bellevue, NE collected exclusively by city-data.com from local newspapers, TV, and radio stations
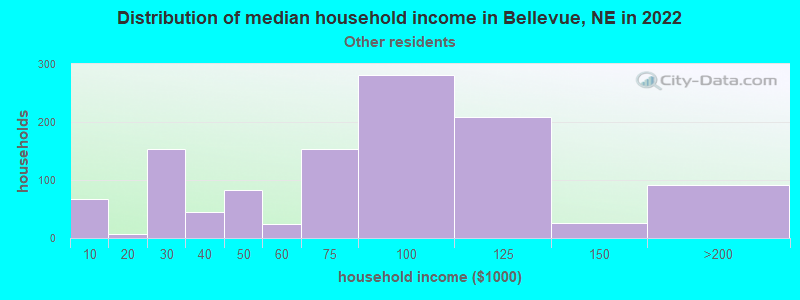
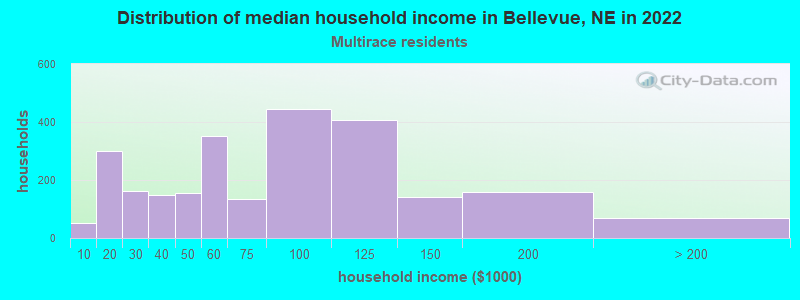
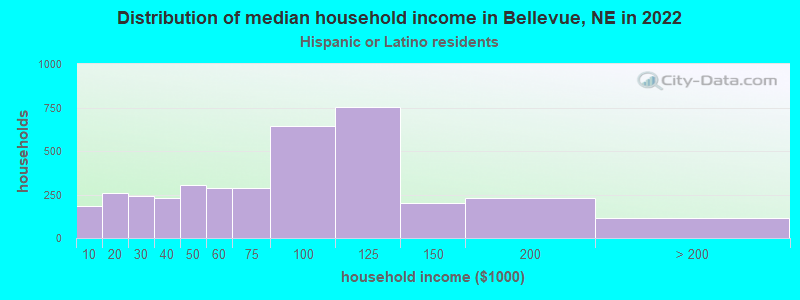
According to 2022 data, the most numerous races in Bellevue, NE are White alone (42,914 residents), Hispanic (12,521 residents), and Black alone (3,640 residents). 86.2% of Bellevue residents speak English at home. 8.9% of Bellevue, NE residents are foreign-born (4.4% born in Latin America, 2.4% born in Asia, 1.1% born in Africa), which is 21.3% greater than the foreign-born rate of 7.0% across the entire state of Nebraska.
Race distribution in Bellevue
2000 2022
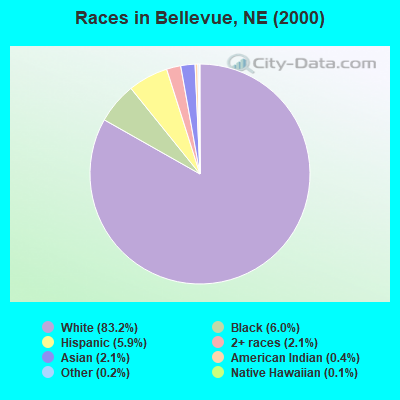
1,494,494 87.3% White alone 94,425 5.5% Hispanic 67,537 3.9% Black alone 21,677 1.3% Asian alone 17,696 1.0% Two or more races 13,460 0.8% American Indian alone 1,327 0.08% Other race alone 647 0.04% Native Hawaiian and Other
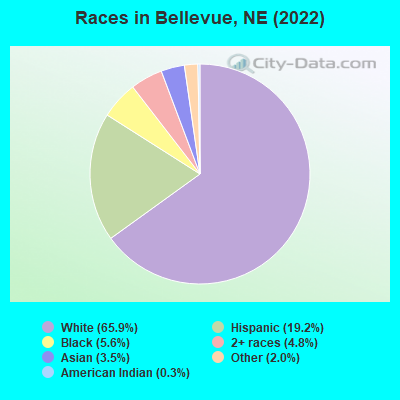
1,492,005 75.8% White alone 241,898 12.3% Hispanic 89,520 4.5% Black alone 76,499 3.9% Two or more races 49,261 2.5% Asian alone 10,249 0.5% American Indian alone 7,425 0.4% Other race alone 1,066 0.05% Native Hawaiian and Other
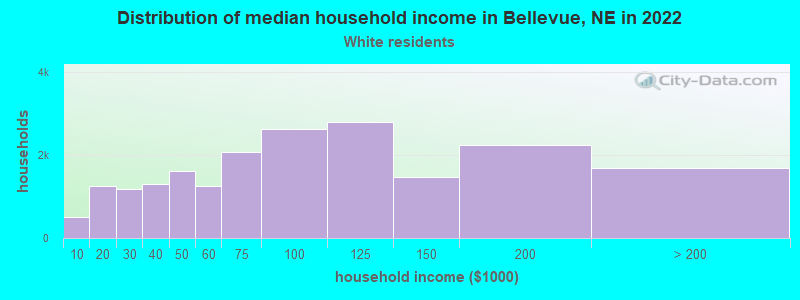
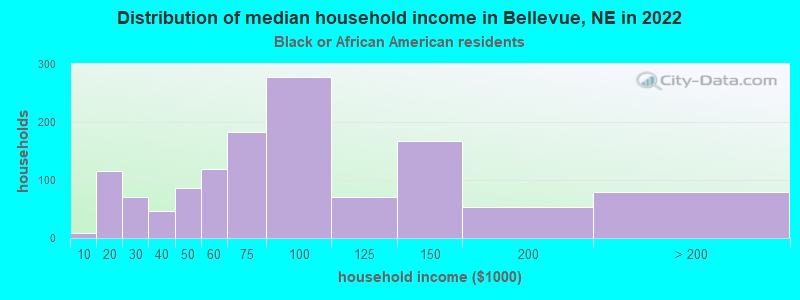
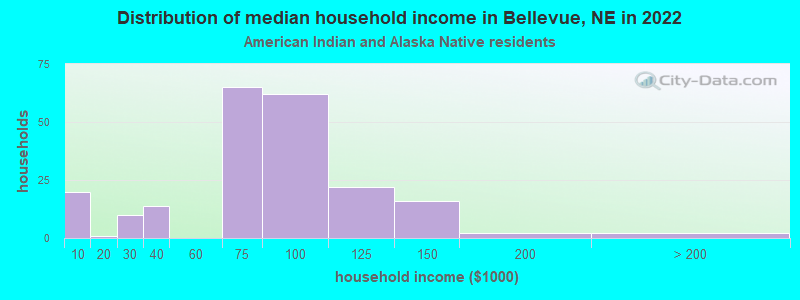
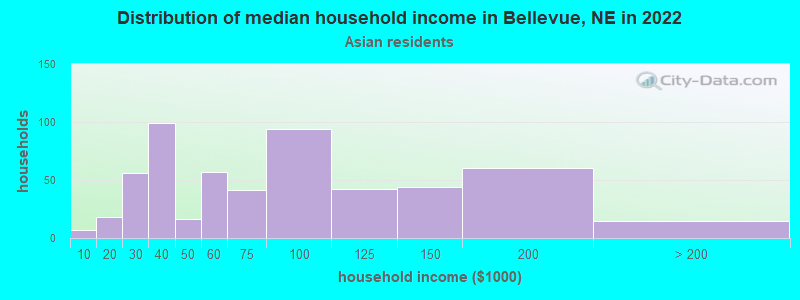
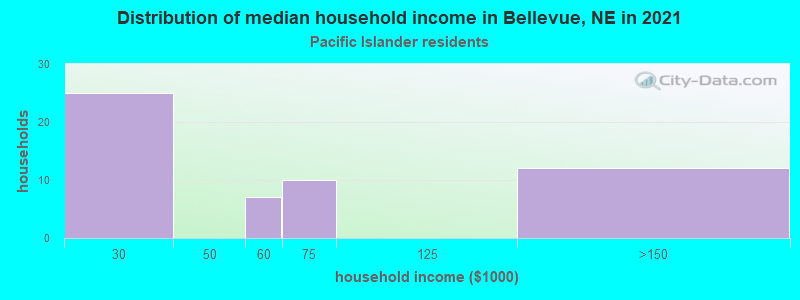
Income and house value in Bellevue Median household income in 2022 $84,521 White non-Hispanic householders$64,209 Black householders$86,837 American Indian and Alaska Native householders$59,656 Asian householders$78,239 Some other race householders$79,560 Two or more races householders$86,427 Hispanic or Latino race householdersMedian 2022 house value $239,678 White Non-Hispanic householders$253,907 Black or African American householders$24,529 American Indian or Alaska Native householders $237,716 Asian householders$337,316 Native Hawaiian and other Pacific Islander householders$234,036 Some other race householders$201,408 Two or more races householders$233,791 Hispanic or Latino householders
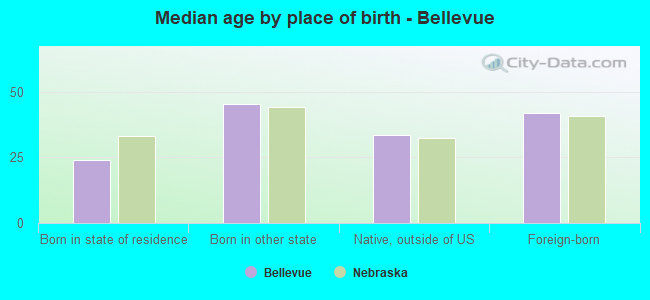
Median age by race in Bellevue
40.0 Median age for White residents38.4 41.8 30.5 Median age for Black or African American residents29.2 36.2 34.5 Median age for American Indian / Alaska Native residents36.1 42.1 35.9 Median age for Asian residents32.9 43.8 64.5 Median age for Native Hawaiian / Pacific Islander residents-672,108,842.9 63.4 28.2 Median age for Other race residents26.0 28.3 24.2 Median age for Two or more races residents23.5 26.0 42.0 Median age for White alone residents40.9 42.6 25.3 Median age for Hispanic or Latino residents24.4 26.7
Owner/renter occupied households by race in Bellevue
House owners and renters - White residents 13,544 66.8% Owner occupied6,723 33.2% Renter occupiedHouse owners and renters - Black or African American residents 644 53.1% Owner occupied568 46.9% Renter occupiedHouse owners and renters - American Indian / Alaska Native residents 287 71.6% Owner occupied114 28.4% Renter occupiedHouse owners and renters - Asian residents 638 74.6% Owner occupied217 25.4% Renter occupiedHouse owners and renters - Native Hawaiian / Pacific Islander residents 10 11.4% Owner occupied80 88.6% Renter occupiedHouse owners and renters - Other race residents 245 21.2% Owner occupied907 78.8% Renter occupiedHouse owners and renters - Two or more races residents 1,406 59.5% Owner occupied958 40.5% Renter occupiedHouse owners and renters - White alone residents 12,777 66.9% Owner occupied6,321 33.1% Renter occupiedHouse owners and renters - Hispanic or Latino residents 2,173 61.0% Owner occupied1,391 39.0% Renter occupied
Language usage in Bellevue
English speakers - Total 86.2% of residents of Bellevue speak English at home.
9.6% of residents speak Spanish at home 3,918 66.7% Speak English very well1,956 33.3% Speak English less than very well4.2% of residents speak other language at home 1,649 65.0% Speak English very well886 35.0% Speak English less than very well
English speakers - Born in the United States 94.8% of residents of Bellevue speak English at home.
3.5% of residents speak Spanish at home 686 86.0% Speak English very well112 14.0% Speak English less than very well2.1% of residents speak other language at home 429 89.9% Speak English very well48 10.1% Speak English less than very well
English speakers - Native, born elsewhere 78.8% of residents of Bellevue speak English at home.
13.1% of residents speak Spanish at home 182 81.2% Speak English very well42 18.8% Speak English less than very well4.8% of residents speak other language at home 60 73.2% Speak English very well22 26.8% Speak English less than very well
English speakers - Foreign-born 18.5% of residents of Bellevue speak English at home.
52.9% of residents speak Spanish at home 1,808 53.3% Speak English very well1,581 46.7% Speak English less than very well29.2% of residents speak other language at home 1,098 58.7% Speak English very well773 41.3% Speak English less than very well
White (Caucasian) - Speak only English Native:
97.5% (42,035)Foreign-born:
39.5% (674)
White (Caucasian) - Speak another language Native:
2.1% (885)Foreign-born:
58.8% (1,003)
Black or African American - Speak only English Native:
90.8% (2,711)Foreign-born:
31.1% (206)
Black or African American - Speak another language Native:
9.9% (296)Foreign-born:
71.9% (477)
American Indian / Alaska Native - Speak another language Native:
7.3% (29)Foreign-born:
100.0% (145)
Asian - Speak only English Native:
82.5% (670)Foreign-born:
12.0% (162)
Asian - Speak another language Native:
20.1% (164)Foreign-born:
92.2% (1,244)
Other race - Speak only English Native:
64.3% (1,985)Foreign-born:
1.7% (15)
Other race - Speak another language Native:
31.9% (984)Foreign-born:
100.0% (871)
Two or more races - Speak only English Native:
81.5% (4,175)Foreign-born:
3.7% (59)
Two or more races - Speak another language Native:
18.9% (970)Foreign-born:
96.7% (1,554)
White alone - Speak only English Native:
98.8% (39,499)Foreign-born:
66.7% (629)
White alone - Speak another language Native:
1.1% (454)Foreign-born:
33.2% (313)
Hispanic or Latino - Speak only English Native:
69.9% (5,426)Foreign-born:
0.8% (29)
Hispanic or Latino - Speak another language Native:
28.4% (2,204)Foreign-born:
99.7% (3,417)
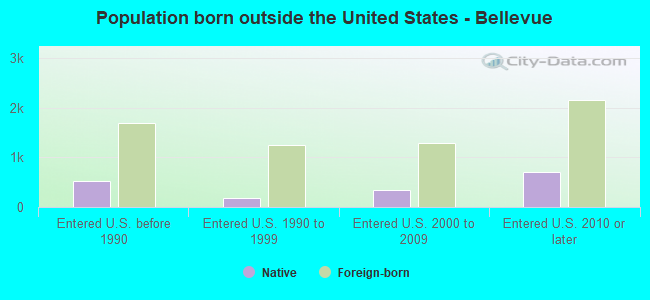
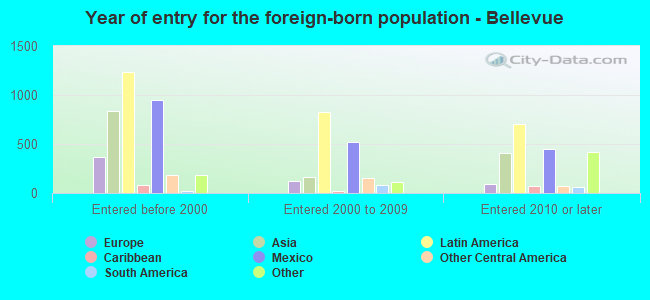
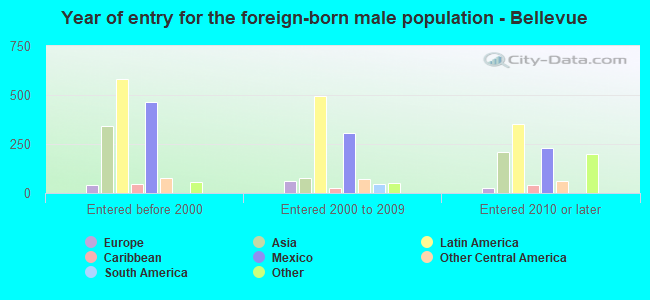
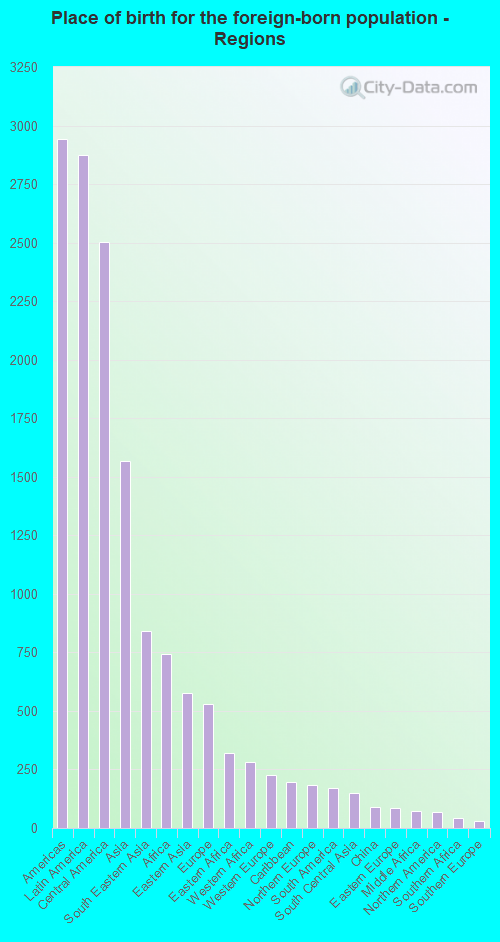
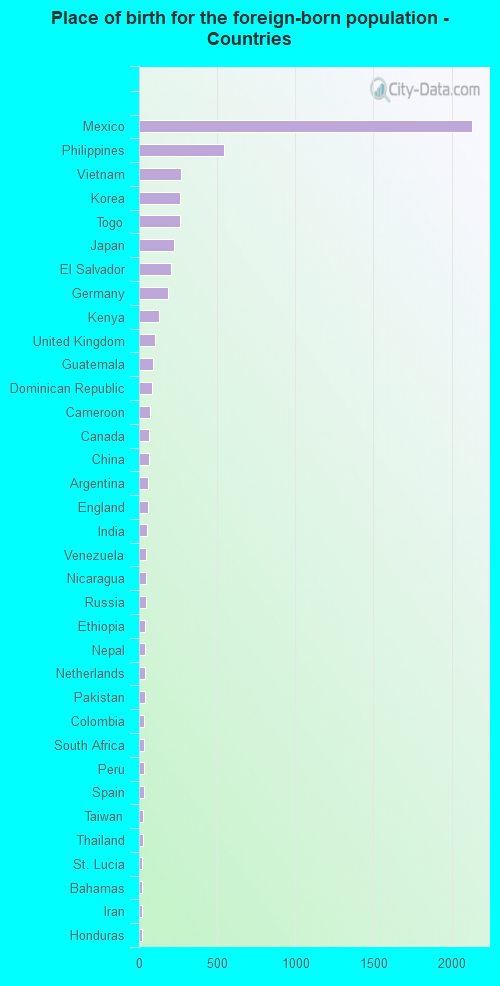
Foreign-born residents in Bellevue 5,786 residents are foreign born (4.4% Latin America , 2.4% Asia , 1.1% Africa ).
This city:
8.9%Nebraska:
7.5%
Marital status for residents in Bellevue Marital status - White (Caucasian) population 15 years and over
Males 32.9% Never married52.2% Now married1.0% Separated1.6% Widowed12.3% DivorcedFemales 24.8% Never married51.3% Now married1.4% Separated7.1% Widowed15.3% DivorcedWomen who gave birth in the past 12 months Now married:
73.0% (439)Unmarried:
27.0% (162)
Women who did not give birth in the past 12 months Now married:
45.5% (4,336)Unmarried:
54.5% (5,192)
Marital status - Black or African American population 15 years and over
Males 40.6% Never married52.2% Now married0.0% Separated0.6% Widowed6.6% DivorcedFemales 30.4% Never married45.3% Now married1.4% Separated7.1% Widowed15.8% DivorcedWomen who gave birth in the past 12 months Now married:
100.0% (52)Unmarried:
0.0% (0)
Women who did not give birth in the past 12 months Now married:
35.7% (240)Unmarried:
64.3% (433)
Marital status - American Indian / Alaska Native population 15 years and over
Males 62.1% Never married13.1% Now married4.6% Separated0.0% Widowed20.3% DivorcedFemales 40.4% Never married22.8% Now married0.0% Separated7.4% Widowed29.4% DivorcedWomen who gave birth in the past 12 months Now married:
0.0% (0)Unmarried:
100.0% (9)
Women who did not give birth in the past 12 months Now married:
24.0% (27)Unmarried:
76.0% (85)
Marital status - Asian population 15 years and over
Males 58.2% Never married39.8% Now married0.0% Separated0.0% Widowed2.0% DivorcedFemales 6.1% Never married71.0% Now married5.1% Separated5.1% Widowed12.8% DivorcedWomen who gave birth in the past 12 months Now married:
100.0% (37)Unmarried:
0.0% (0)
Women who did not give birth in the past 12 months Now married:
71.2% (358)Unmarried:
28.8% (145)
Marital status - Native Hawaiian / Pacific Islander population 15 years and over
Males 0.0% Never married0.0% Now married0.0% Separated0.0% Widowed100.0% DivorcedFemales 29.7% Never married0.0% Now married0.0% Separated0.0% Widowed70.3% DivorcedWomen who did not give birth in the past 12 months Now married:
0.0% (0)Unmarried:
100.0% (20)
Marital status - Other race population 15 years and over
Males 39.4% Never married39.5% Now married12.0% Separated0.0% Widowed9.1% DivorcedFemales 25.5% Never married57.0% Now married3.0% Separated3.0% Widowed11.5% DivorcedWomen who gave birth in the past 12 months Now married:
100.0% (27)Unmarried:
0.0% (0)
Women who did not give birth in the past 12 months Now married:
60.6% (585)Unmarried:
39.4% (380)
Marital status - Two or more races population 15 years and over
Males 37.8% Never married45.4% Now married0.0% Separated0.0% Widowed16.8% DivorcedFemales 53.3% Never married29.4% Now married1.0% Separated1.6% Widowed14.7% DivorcedWomen who gave birth in the past 12 months Now married:
33.2% (104)Unmarried:
66.8% (210)
Women who did not give birth in the past 12 months Now married:
27.0% (569)Unmarried:
73.0% (1,536)
Marital status - White alone, not Hispanic / Latino population 15 years and over
Males 32.1% Never married52.9% Now married0.8% Separated1.7% Widowed12.4% DivorcedFemales 24.0% Never married51.7% Now married1.4% Separated7.5% Widowed15.4% DivorcedWomen who gave birth in the past 12 months Now married:
68.5% (332)Unmarried:
31.5% (153)
Women who did not give birth in the past 12 months Now married:
46.5% (4,135)Unmarried:
53.5% (4,756)
Marital status - Hispanic or Latino population 15 years and over
Males 35.5% Never married48.0% Now married2.4% Separated0.0% Widowed14.0% DivorcedFemales 38.5% Never married44.9% Now married2.0% Separated2.1% Widowed12.5% DivorcedWomen who gave birth in the past 12 months Now married:
61.4% (244)Unmarried:
38.6% (154)
Women who did not give birth in the past 12 months Now married:
39.8% (1,164)Unmarried:
60.2% (1,762)
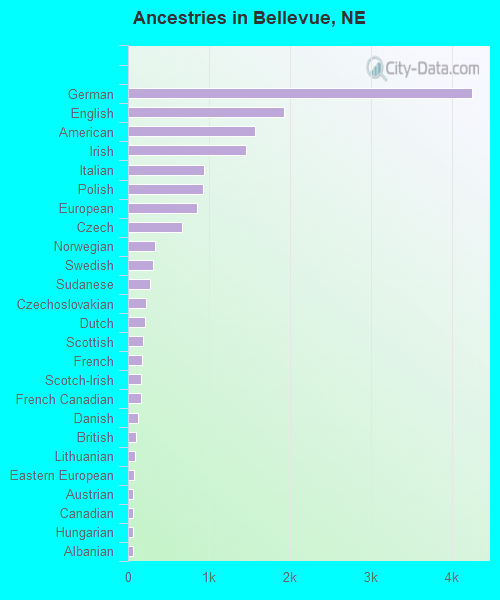
Ancestries in Bellevue
4,249 15.9% German1,927 7.2% English1,574 5.9% American1,462 5.5% Irish939 3.5% Italian928 3.5% Polish851 3.2% European667 2.5% Czech328 1.2% Norwegian306 1.1% Swedish274 1.0% Sudanese220 0.8% Czechoslovakian205 0.8% Dutch186 0.7% Scottish172 0.6% French163 0.6% Scotch-Irish156 0.6% French Canadian120 0.4% Danish99 0.4% British91 0.3% Lithuanian71 0.3% Eastern European66 0.2% Austrian60 0.2% Canadian60 0.2% Hungarian57 0.2% Albanian53 0.2% British West Indian48 0.2% Iranian48 0.2% Portuguese44 0.2% Croatian39 0.1% African38 0.1% Kenyan36 0.1% Scandinavian32 0.1% Swiss29 0.1% Welsh28 0.1% Northern European27 0.1% Belgian27 0.1% Russian25 0.09% Ghanaian23 0.09% Greek17 0.06% Slavic15 0.06% Ukrainian14 0.05% Pennsylvania German12 0.04% Finnish10 0.04% Romanian8 0.03% Slovak8 0.03% Bahamian8 0.03% West Indian7 0.03% Australian7 0.03% South African6 0.02% Celtic5 0.02% Assyrian
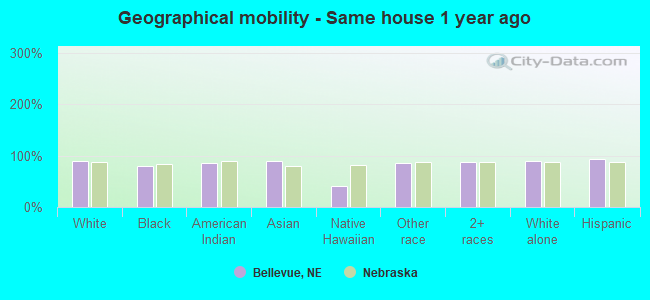
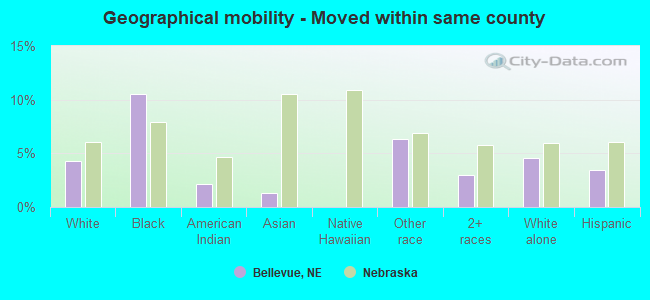
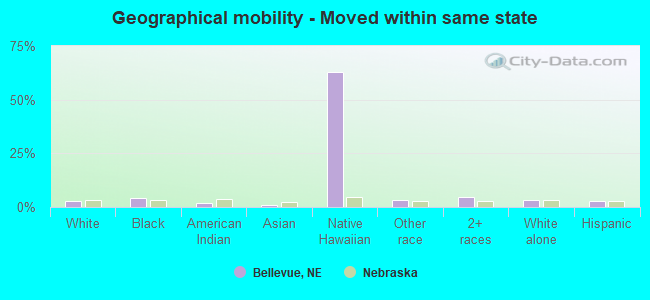
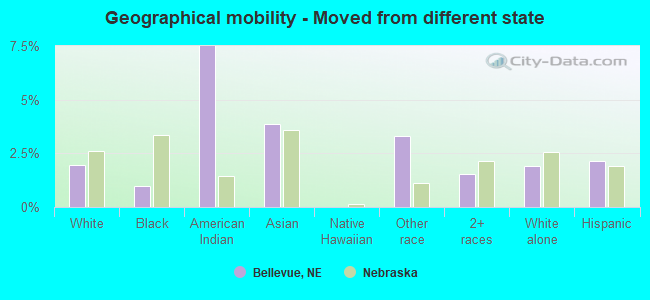
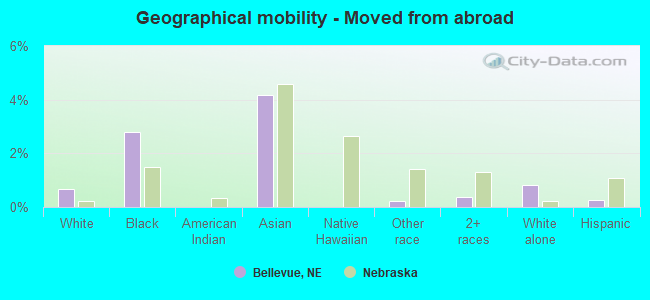
Geographical mobility in Bellevue Same house 1 year ago 42,177 89.9% White (Caucasian)3,068 80.3% Black or African American435 86.0% American Indian / Alaska Native1,825 88.8% Asian32 40.4% Native Hawaiian / Pacific Islander3,981 86.0% Other race6,364 88.4% Two or more races38,027 89.3% White alone, not Hispanic / Latino10,808 93.2% Hispanic or LatinoMoved within same county 2,017 4.3% White / Caucasian402 10.5% Black or African American11 2.1% American Indian / Alaska Native27 1.3% Asian291 6.3% Other race217 3.0% Two or more races1,935 4.5% White alone, not Hispanic / Latino403 3.5% Hispanic or LatinoMoved within same state 1,404 3.0% White / Caucasian152 4.0% Black or African American10 2.0% American Indian / Alaska Native15 0.7% Asian50 62.9% Native Hawaiian / Pacific Islander159 3.4% Other race320 4.4% Two or more races1,395 3.3% White alone, not Hispanic / Latino304 2.6% Hispanic or LatinoMoved from different state 927 2.0% White / Caucasian38 1.0% Black or African American38 7.5% American Indian / Alaska Native80 3.9% Asian154 3.3% Other race109 1.5% Two or more races808 1.9% White alone, not Hispanic / Latino247 2.1% Hispanic or LatinoMoved from abroad 312 0.7% White107 2.8% Black or African American85 4.2% Asian10 0.2% Other race27 0.4% Two or more races353 0.8% White alone, not Hispanic / Latino32 0.3% Hispanic or Latino
Children Nativity (place of birth) in Bellevue
Children under 6 years - Living with two parents Both parents native 2,711 99.3% Native20 0.7% Foreign-bornBoth parents foreign-born 574 98.5% Native9 1.5% Foreign-bornOne native, one foreign-born parent 245 100.0% NativeChildren under 6 years - Living with one parent Native parent 998 100.0% NativeForeign-born parent 143 70.8% Native59 29.2% Foreign-bornChildren 6 to 17 years - Living with two parents Both parents native 5,353 100.0% NativeBoth parents foreign-born 621 69.4% Native274 30.6% Foreign-bornOne native, one foreign-born parent 306 95.0% Native16 5.0% Foreign-bornChildren 6 to 17 years - Living with one parent Native parent 2,803 100.0% NativeForeign-born parent 819 48.9% Native855 51.1% Foreign-born
Grandparents responsible for own grandchildren in Bellevue
Grandparents (30 to 59 years) White / Caucasian 132 59.9% Responsible for grandchildren89 40.1% Not responsible for grandchildrenAmerican Indian / Alaska Native 8 100.0% Not responsible for grandchildrenAsian 8 100.0% Not responsible for grandchildrenOther race 47 100.0% Not responsible for grandchildrenTwo or more races 216 100.0% Not responsible for grandchildrenWhite alone, not Hispanic / Latino 126 70.9% Responsible for grandchildren52 29.1% Not responsible for grandchildrenHispanic or Latino 9 6.3% Responsible for grandchildren132 93.7% Not responsible for grandchildrenGrandparents (60 years and over) White / Caucasian 106 26.1% Responsible for grandchildren299 73.9% Not responsible for grandchildrenAmerican Indian / Alaska Native 7 100.0% Not responsible for grandchildrenAsian 45 100.0% Not responsible for grandchildrenOther race 14 100.0% Not responsible for grandchildrenTwo or more races 23 100.0% Not responsible for grandchildrenWhite alone, not Hispanic / Latino 106 30.6% Responsible for grandchildren241 69.4% Not responsible for grandchildrenHispanic or Latino 128 100.0% Not responsible for grandchildren