Races in Bellingham, Washington (WA) Detailed Stats
Data:
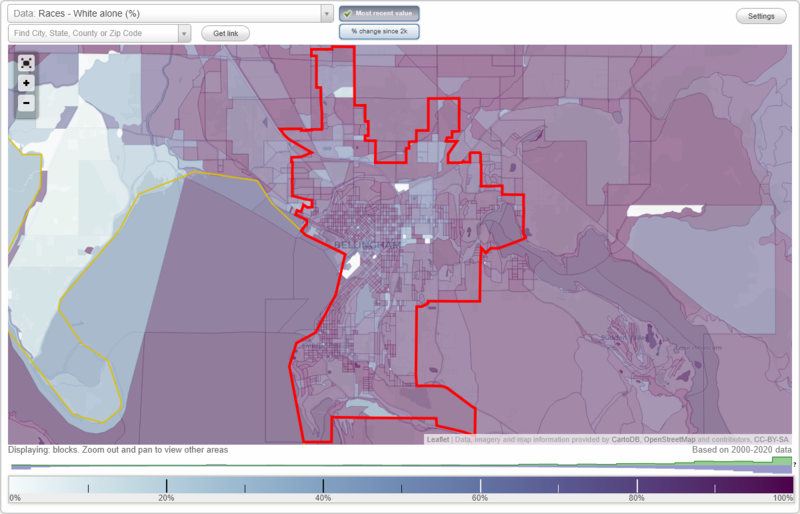
Races - White alone (%)
Races - White alone (% change since 2000)
Races - Black alone (%)
Races - Black alone (% change since 2000)
Races - American Indian alone (%)
Races - American Indian alone (% change since 2000)
Races - Asian alone (%)
Races - Asian alone (% change since 2000)
Races - Hispanic (%)
Races - Hispanic (% change since 2000)
Races - Native Hawaiian and Other Pacific Islander alone (%)
Races - Native Hawaiian and Other Pacific Islander alone (% change since 2000)
Races - Two or more races(%)
Races - Two or more races(% change since 2000)
Races - Other race alone (%)
Races - Other race alone (% change since 2000)
Racial diversity
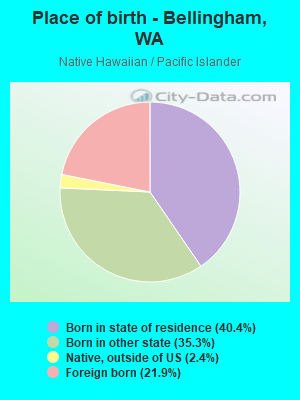
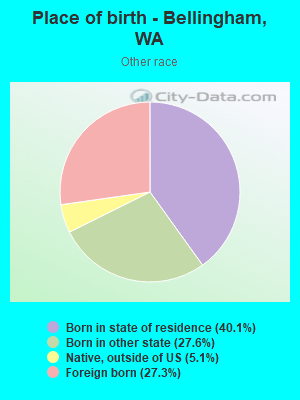
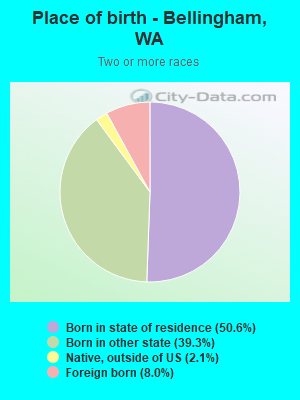
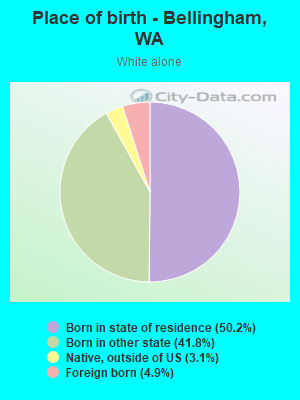
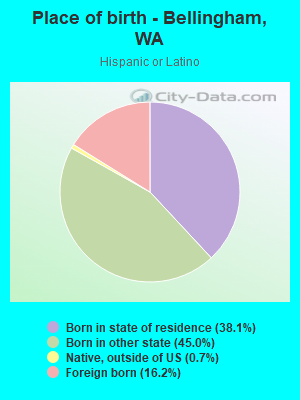
Place of birth - Born in state of residence (%)
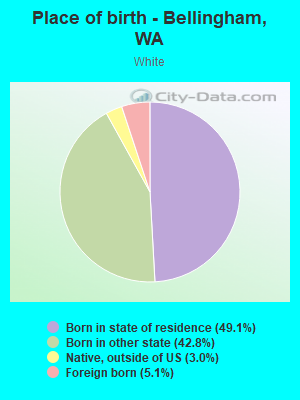
Place of birth - Born in state of residence (%) - White
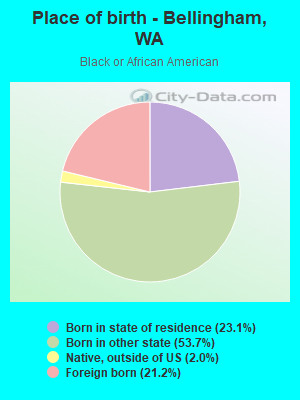
Place of birth - Born in state of residence (%) - Black or African American
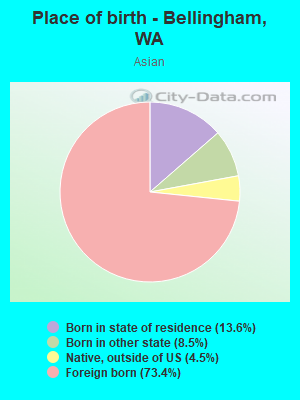
Place of birth - Born in state of residence (%) - Asian
Place of birth - Born in state of residence (%) - Hispanic or Latino
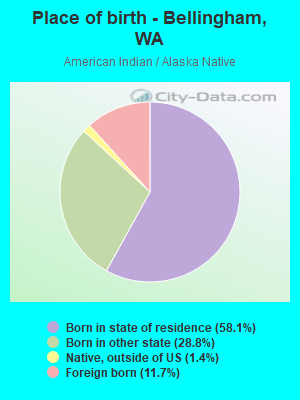
Place of birth - Born in state of residence (%) - American Indian and Alaska Native
Place of birth - Born in state of residence (%) - Multirace
Place of birth - Born in state of residence (%) - Other Race
Place of birth - Born in other state (%)
Place of birth - Born in other state (%) - White
Place of birth - Born in other state (%) - Black or African American
Place of birth - Born in other state (%) - Asian
Place of birth - Born in other state (%) - Hispanic or Latino
Place of birth - Born in other state (%) - American Indian and Alaska Native
Place of birth - Born in other state (%) - Multirace
Place of birth - Born in other state (%) - Other Race
Place of birth - Native, outside of US (%)
Place of birth - Native, outside of US (%) - White
Place of birth - Native, outside of US (%) - Black or African American
Place of birth - Native, outside of US (%) - Asian
Place of birth - Native, outside of US (%) - Hispanic or Latino
Place of birth - Native, outside of US (%) - American Indian and Alaska Native
Place of birth - Native, outside of US (%) - Multirace
Place of birth - Native, outside of US (%) - Other Race
Place of birth - Foreign born (%)
Place of birth - Foreign born (%) - White
Place of birth - Foreign born (%) - Black or African American
Place of birth - Foreign born (%) - Asian
Place of birth - Foreign born (%) - Hispanic or Latino
Place of birth - Foreign born (%) - American Indian and Alaska Native
Place of birth - Foreign born (%) - Multirace
Place of birth - Foreign born (%) - Other Race
Residents speaking English at home (%)
Residents speaking English at home - Born in the United States (%)
Residents speaking English at home - Native, born elsewhere (%)
Residents speaking English at home - Foreign born (%)
Residents speaking Spanish at home (%)
Residents speaking Spanish at home - Born in the United States (%)
Residents speaking Spanish at home - Native, born elsewhere (%)
Residents speaking Spanish at home - Foreign born (%)
Residents speaking other language at home (%)
Residents speaking other language at home - Born in the United States (%)
Residents speaking other language at home - Native, born elsewhere (%)
Residents speaking other language at home - Foreign born (%)
Marital status - Never married (%)
Marital status - Now married (%)
Marital status - Separated (%)
Marital status - Widowed (%)
Marital status - Divorced (%)
Ancestries Reported - Arab (%)
Ancestries Reported - Czech (%)
Ancestries Reported - Danish (%)
Ancestries Reported - Dutch (%)
Ancestries Reported - English (%)
Ancestries Reported - French (%)
Ancestries Reported - French Canadian (%)
Ancestries Reported - German (%)
Ancestries Reported - Greek (%)
Ancestries Reported - Hungarian (%)
Ancestries Reported - Irish (%)
Ancestries Reported - Italian (%)
Ancestries Reported - Lithuanian (%)
Ancestries Reported - Norwegian (%)
Ancestries Reported - Polish (%)
Ancestries Reported - Portuguese (%)
Ancestries Reported - Russian (%)
Ancestries Reported - Scotch-Irish (%)
Ancestries Reported - Scottish (%)
Ancestries Reported - Slovak (%)
Ancestries Reported - Subsaharan African (%)
Ancestries Reported - Swedish (%)
Ancestries Reported - Swiss (%)
Ancestries Reported - Ukrainian (%)
Ancestries Reported - United States (%)
Ancestries Reported - Welsh (%)
Ancestries Reported - West Indian (%)
Ancestries Reported - Other (%)
Geographical mobility - Same house 1 year ago (%)
Geographical mobility - Same house 1 year ago (%) - White
Geographical mobility - Same house 1 year ago (%) - Black or African American
Geographical mobility - Same house 1 year ago (%) - Asian
Geographical mobility - Same house 1 year ago (%) - Hispanic or Latino
Geographical mobility - Same house 1 year ago (%) - American Indian and Alaska Native
Geographical mobility - Same house 1 year ago (%) - Multirace
Geographical mobility - Same house 1 year ago (%) - Other Race
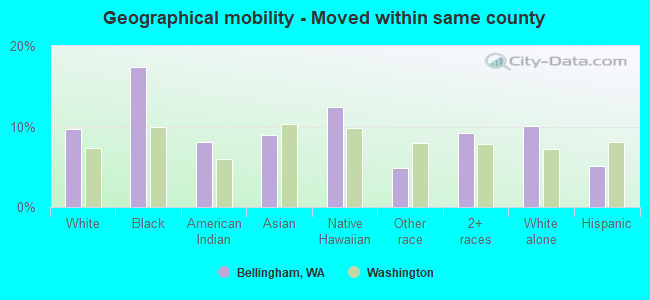
Geographical mobility - Moved within same county (%)
Geographical mobility - Moved within same county (%) - White
Geographical mobility - Moved within same county (%) - Black or African American
Geographical mobility - Moved within same county (%) - Asian
Geographical mobility - Moved within same county (%) - Hispanic or Latino
Geographical mobility - Moved within same county (%) - American Indian and Alaska Native
Geographical mobility - Moved within same county (%) - Multirace
Geographical mobility - Moved within same county (%) - Other Race
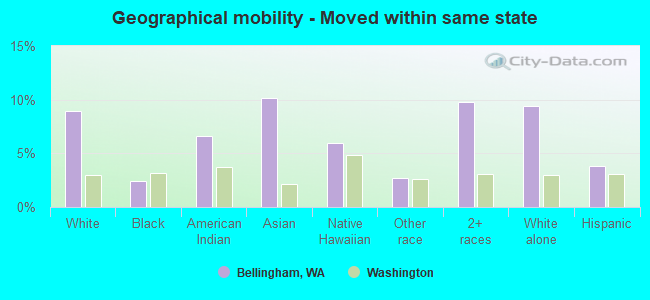
Geographical mobility - Moved from different county within same state (%)
Geographical mobility - Moved from different county within same state (%) - White
Geographical mobility - Moved from different county within same state (%) - Black or African American
Geographical mobility - Moved from different county within same state (%) - Asian
Geographical mobility - Moved from different county within same state (%) - Hispanic or Latino
Geographical mobility - Moved from different county within same state (%) - American Indian and Alaska Native
Geographical mobility - Moved from different county within same state (%) - Multirace
Geographical mobility - Moved from different county within same state (%) - Other Race
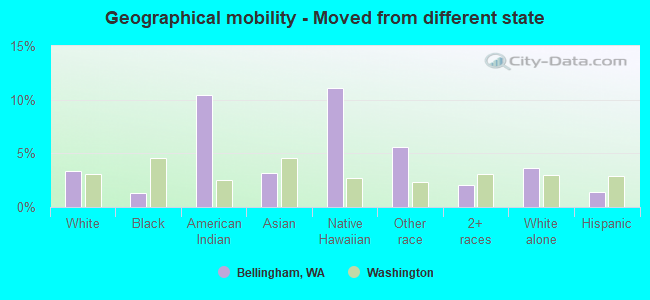
Geographical mobility - Moved from different state (%)
Geographical mobility - Moved from different state (%) - White
Geographical mobility - Moved from different state (%) - Black or African American
Geographical mobility - Moved from different state (%) - Asian
Geographical mobility - Moved from different state (%) - Hispanic or Latino
Geographical mobility - Moved from different state (%) - American Indian and Alaska Native
Geographical mobility - Moved from different state (%) - Multirace
Geographical mobility - Moved from different state (%) - Other Race
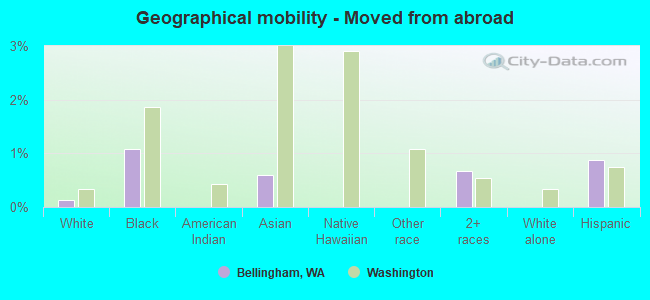
Geographical mobility - Moved from abroad (%)
Geographical mobility - Moved from abroad (%) - White
Geographical mobility - Moved from abroad (%) - Black or African American
Geographical mobility - Moved from abroad (%) - Asian
Geographical mobility - Moved from abroad (%) - Hispanic or Latino
Geographical mobility - Moved from abroad (%) - American Indian and Alaska Native
Geographical mobility - Moved from abroad (%) - Multirace
Geographical mobility - Moved from abroad (%) - Other Race
Place of birth for the foreign-born population - Ireland (%)
Place of birth for the foreign-born population - Denmark (%)
Place of birth for the foreign-born population - Norway (%)
Place of birth for the foreign-born population - Sweden (%)
Place of birth for the foreign-born population - United Kingdom (%)
Place of birth for the foreign-born population - England (%)
Place of birth for the foreign-born population - Scotland (%)
Place of birth for the foreign-born population - Other Northern Europe (%)
Place of birth for the foreign-born population - Austria (%)
Place of birth for the foreign-born population - Belgium (%)
Place of birth for the foreign-born population - France (%)
Place of birth for the foreign-born population - Germany (%)
Place of birth for the foreign-born population - Netherlands (%)
Place of birth for the foreign-born population - Switzerland (%)
Place of birth for the foreign-born population - Other Western Europe (%)
Place of birth for the foreign-born population - Greece (%)
Place of birth for the foreign-born population - Italy (%)
Place of birth for the foreign-born population - Portugal (%)
Place of birth for the foreign-born population - Spain (%)
Place of birth for the foreign-born population - Other Southern Europe (%)
Place of birth for the foreign-born population - Albania (%)
Place of birth for the foreign-born population - Belarus (%)
Place of birth for the foreign-born population - Bosnia and Herzegovina (%)
Place of birth for the foreign-born population - Bulgaria (%)
Place of birth for the foreign-born population - Croatia (%)
Place of birth for the foreign-born population - Czechoslovakia (%)
Place of birth for the foreign-born population - Hungary (%)
Place of birth for the foreign-born population - Latvia (%)
Place of birth for the foreign-born population - Lithuania (%)
Place of birth for the foreign-born population - North Macedonia (Macedonia) (%)
Place of birth for the foreign-born population - Moldova (%)
Place of birth for the foreign-born population - Poland (%)
Place of birth for the foreign-born population - Romania (%)
Place of birth for the foreign-born population - Russia (%)
Place of birth for the foreign-born population - Serbia (%)
Place of birth for the foreign-born population - Ukraine (%)
Place of birth for the foreign-born population - Other Eastern Europe (%)
Place of birth for the foreign-born population - China (%)
Place of birth for the foreign-born population - Hong Kong (%)
Place of birth for the foreign-born population - Taiwan (%)
Place of birth for the foreign-born population - Japan (%)
Place of birth for the foreign-born population - Korea (%)
Place of birth for the foreign-born population - Other Eastern Asia (%)
Place of birth for the foreign-born population - Afghanistan (%)
Place of birth for the foreign-born population - Bangladesh (%)
Place of birth for the foreign-born population - India (%)
Place of birth for the foreign-born population - Iran (%)
Place of birth for the foreign-born population - Kazakhstan (%)
Place of birth for the foreign-born population - Nepal (%)
Place of birth for the foreign-born population - Pakistan (%)
Place of birth for the foreign-born population - Sri Lanka (%)
Place of birth for the foreign-born population - Uzbekistan (%)
Place of birth for the foreign-born population - Other South Central Asia (%)
Place of birth for the foreign-born population - Burma (%)
Place of birth for the foreign-born population - Cambodia (%)
Place of birth for the foreign-born population - Indonesia (%)
Place of birth for the foreign-born population - Laos (%)
Place of birth for the foreign-born population - Malaysia (%)
Place of birth for the foreign-born population - Philippines (%)
Place of birth for the foreign-born population - Singapore (%)
Place of birth for the foreign-born population - Thailand (%)
Place of birth for the foreign-born population - Vietnam (%)
Place of birth for the foreign-born population - Other South Eastern Asia (%)
Place of birth for the foreign-born population - Armenia (%)
Place of birth for the foreign-born population - Iraq (%)
Place of birth for the foreign-born population - Israel (%)
Place of birth for the foreign-born population - Jordan (%)
Place of birth for the foreign-born population - Kuwait (%)
Place of birth for the foreign-born population - Lebanon (%)
Place of birth for the foreign-born population - Saudi Arabia (%)
Place of birth for the foreign-born population - Syria (%)
Place of birth for the foreign-born population - Turkey (%)
Place of birth for the foreign-born population - Yemen (%)
Place of birth for the foreign-born population - Other Western Asia (%)
Place of birth for the foreign-born population - Eritrea (%)
Place of birth for the foreign-born population - Ethiopia (%)
Place of birth for the foreign-born population - Kenya (%)
Place of birth for the foreign-born population - Somalia (%)
Place of birth for the foreign-born population - Uganda (%)
Place of birth for the foreign-born population - Zimbabwe (%)
Place of birth for the foreign-born population - Other Eastern Africa (%)
Place of birth for the foreign-born population - Cameroon (%)
Place of birth for the foreign-born population - Congo (%)
Place of birth for the foreign-born population - Democratic Republic of Congo (Zaire) (%)
Place of birth for the foreign-born population - Other Middle Africa (%)
Place of birth for the foreign-born population - Egypt (%)
Place of birth for the foreign-born population - Morocco (%)
Place of birth for the foreign-born population - Sudan (%)
Place of birth for the foreign-born population - Other Northern Africa (%)
Place of birth for the foreign-born population - South Africa (%)
Place of birth for the foreign-born population - Other Southern Africa (%)
Place of birth for the foreign-born population - Cabo Verde (%)
Place of birth for the foreign-born population - Ghana (%)
Place of birth for the foreign-born population - Liberia (%)
Place of birth for the foreign-born population - Nigeria (%)
Place of birth for the foreign-born population - Senegal (%)
Place of birth for the foreign-born population - Sierra Leone (%)
Place of birth for the foreign-born population - Other Western Africa (%)
Place of birth for the foreign-born population - Australia (%)
Place of birth for the foreign-born population - New Zealand (%)
Place of birth for the foreign-born population - Fiji (%)
Place of birth for the foreign-born population - Micronesia (%)
Place of birth for the foreign-born population - Bahamas (%)
Place of birth for the foreign-born population - Barbados (%)
Place of birth for the foreign-born population - Cuba (%)
Place of birth for the foreign-born population - Dominica (%)
Place of birth for the foreign-born population - Dominican Republic (%)
Place of birth for the foreign-born population - Grenada (%)
Place of birth for the foreign-born population - Haiti (%)
Place of birth for the foreign-born population - Jamaica (%)
Place of birth for the foreign-born population - St. Vincent and the Grenadines (%)
Place of birth for the foreign-born population - Trinidad and Tobago (%)
Place of birth for the foreign-born population - West Indies (%)
Place of birth for the foreign-born population - Other Caribbean (%)
Place of birth for the foreign-born population - Belize (%)
Place of birth for the foreign-born population - Costa Rica (%)
Place of birth for the foreign-born population - El Salvador (%)
Place of birth for the foreign-born population - Guatemala (%)
Place of birth for the foreign-born population - Honduras (%)
Place of birth for the foreign-born population - Mexico (%)
Place of birth for the foreign-born population - Nicaragua (%)
Place of birth for the foreign-born population - Panama (%)
Place of birth for the foreign-born population - Other Central America (%)
Place of birth for the foreign-born population - Argentina (%)
Place of birth for the foreign-born population - Bolivia (%)
Place of birth for the foreign-born population - Brazil (%)
Place of birth for the foreign-born population - Chile (%)
Place of birth for the foreign-born population - Colombia (%)
Place of birth for the foreign-born population - Ecuador (%)
Place of birth for the foreign-born population - Guyana (%)
Place of birth for the foreign-born population - Peru (%)
Place of birth for the foreign-born population - Uruguay (%)
Place of birth for the foreign-born population - Venezuela (%)
Place of birth for the foreign-born population - Other South America (%)
Place of birth for the foreign-born population - Canada (%)
Place of birth for the foreign-born population - Other Northern America (%)
Place of birth for the foreign-born population - Other (%)
Latest news about races in Bellingham, WA collected exclusively by city-data.com from local newspapers, TV, and radio stations
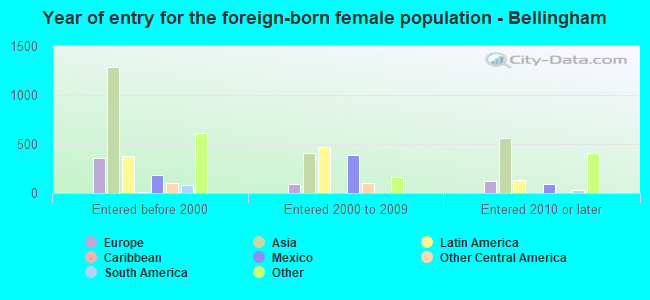
According to 2022 data, the most numerous races in Bellingham, WA are White alone (66,763 residents), Hispanic (10,983 residents), and Asian alone (6,378 residents). 86.2% of Bellingham residents speak English at home. 9.5% of Bellingham, WA residents are foreign-born (4.0% born in Asia, 2.0% born in Latin America, 1.5% born in Europe, 1.4% born in North America), which is 57.8% less than the foreign-born rate of 15.0% across the entire state of Washington.
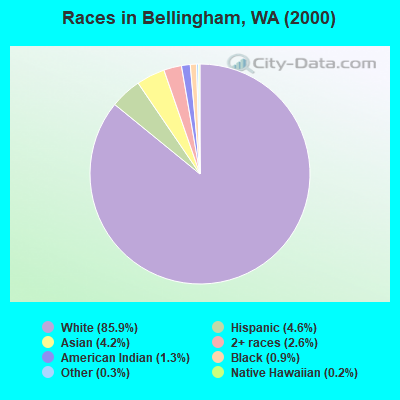
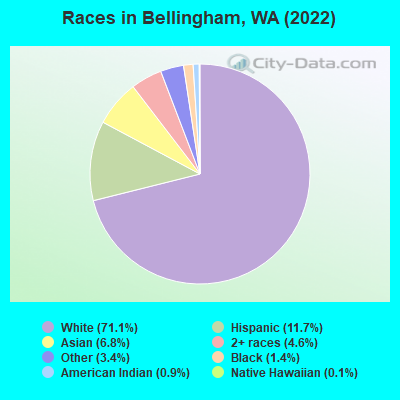
Race distribution in Bellingham
2000 2022
57,684 85.9% White alone 3,111 4.6% Hispanic 2,832 4.2% Asian alone 1,741 2.6% Two or more races 899 1.3% American Indian alone 622 0.9% Black alone 176 0.3% Other race alone 106 0.2% Native Hawaiian and Other
66,763 71.1% White alone 10,983 11.7% Hispanic 6,378 6.8% Asian alone 4,317 4.6% Two or more races 3,179 3.4% Other race alone 1,336 1.4% Black alone 821 0.9% American Indian alone 122 0.1% Native Hawaiian and Other
2000 2022
4,652,490 78.9% White alone 441,509 7.5% Hispanic 319,401 5.4% Asian alone 184,631 3.1% Black alone 175,926 3.0% Two or more races 85,396 1.4% American Indian alone 22,779 0.4% Native Hawaiian and Other 11,989 0.2% Other race alone
4,941,456 63.5% White alone 1,093,313 14.0% Hispanic 755,832 9.7% Asian alone 523,448 6.7% Two or more races 299,537 3.8% Black alone 69,024 0.9% American Indian alone 52,231 0.7% Native Hawaiian and Other 50,945 0.7% Other race alone
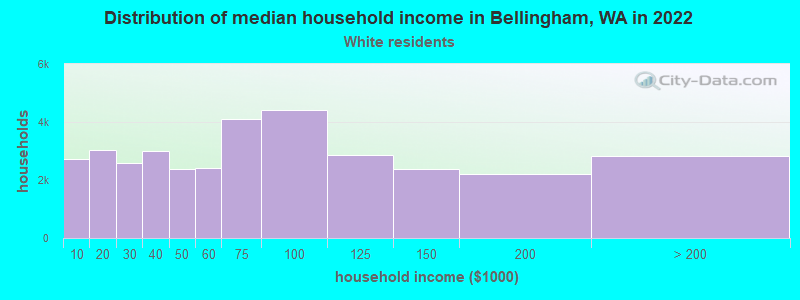
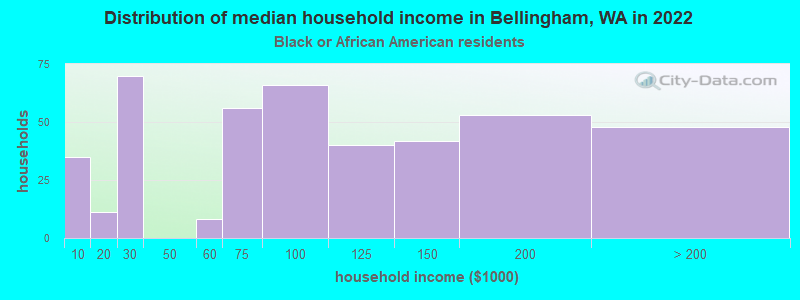
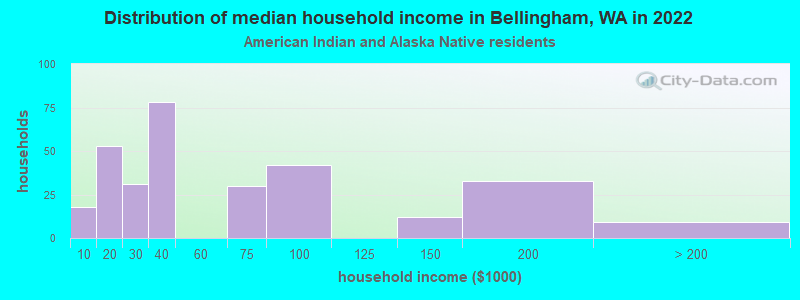
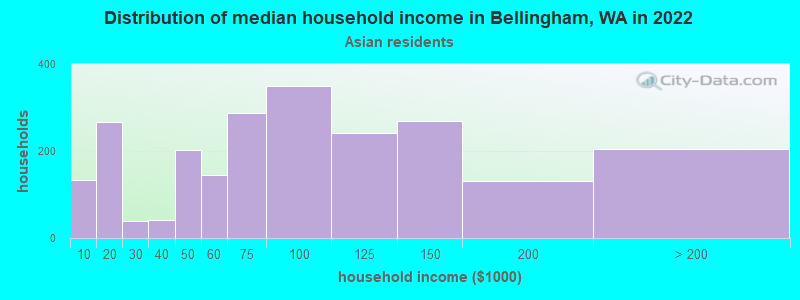
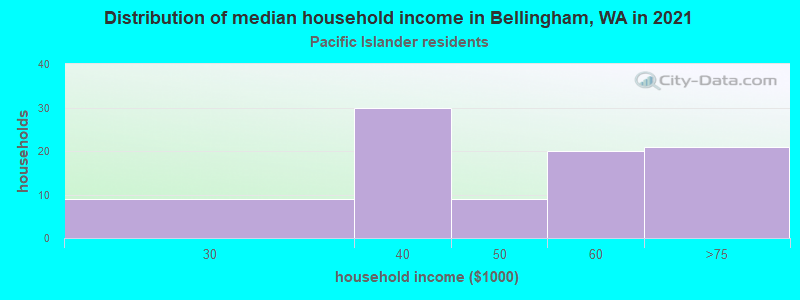
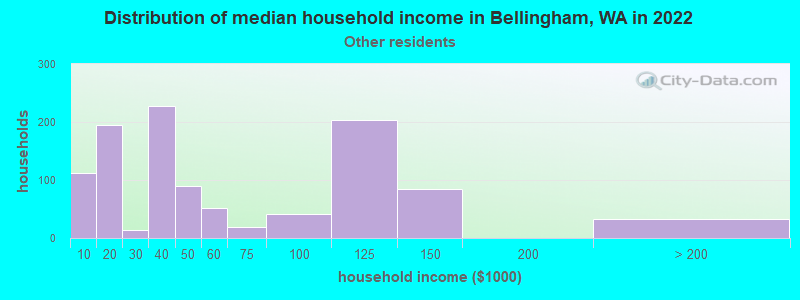
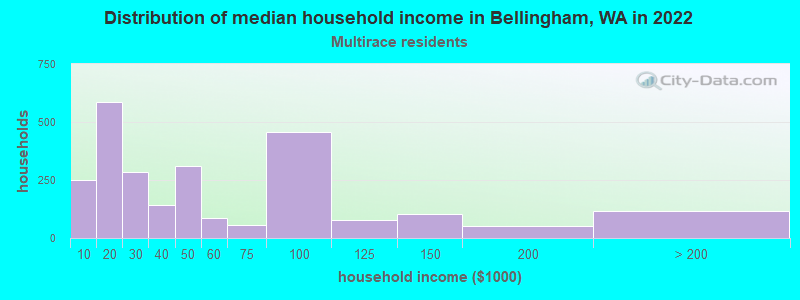
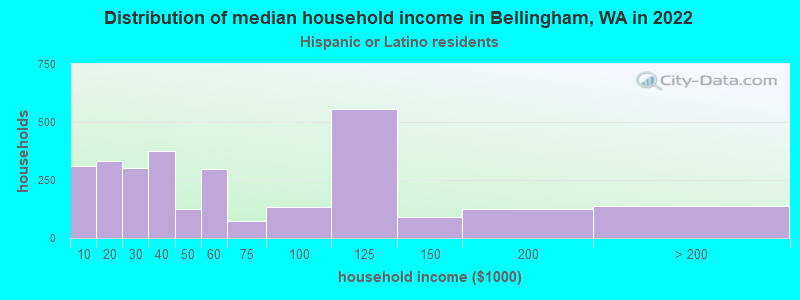
Income and house value in Bellingham Median household income in 2022 $65,053 White non-Hispanic householders$96,566 Black householders$40,578 American Indian and Alaska Native householders$61,074 Asian householders$101,547 Some other race householders$44,846 Two or more races householders$65,978 Hispanic or Latino race householdersMedian 2022 house value $639,779 White Non-Hispanic householders$605,009 Black or African American householders$626,280 American Indian or Alaska Native householders $664,733 Asian householders$642,643 Some other race householders$580,056 Two or more races householders$575,965 Hispanic or Latino householders
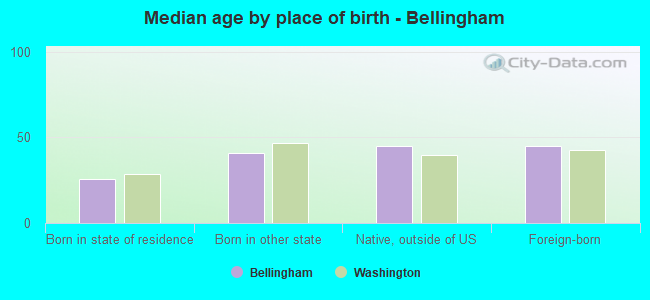
Median age by race in Bellingham
36.8 Median age for White residents36.6 37.7 29.1 Median age for Black or African American residents29.5 25.9 28.2 Median age for American Indian / Alaska Native residents35.3 27.9 38.4 Median age for Asian residents44.5 35.8 22.1 Median age for Native Hawaiian / Pacific Islander residents-666,666,666.0 22.1 27.4 Median age for Other race residents24.7 27.9 20.8 Median age for Two or more races residents21.5 19.5 37.4 Median age for White alone residents36.9 38.2 22.6 Median age for Hispanic or Latino residents21.0 26.4
Owner/renter occupied households by race in Bellingham
House owners and renters - White residents 15,913 45.5% Owner occupied19,023 54.5% Renter occupiedHouse owners and renters - Black or African American residents 101 22.0% Owner occupied356 78.0% Renter occupiedHouse owners and renters - American Indian / Alaska Native residents 99 37.9% Owner occupied163 62.1% Renter occupiedHouse owners and renters - Asian residents 1,277 51.3% Owner occupied1,213 48.7% Renter occupiedHouse owners and renters - Native Hawaiian / Pacific Islander residents 43 40.3% Owner occupied63 59.7% Renter occupiedHouse owners and renters - Other race residents 610 50.8% Owner occupied591 49.2% Renter occupiedHouse owners and renters - Two or more races residents 589 24.2% Owner occupied1,848 75.8% Renter occupiedHouse owners and renters - White alone residents 15,309 46.9% Owner occupied17,335 53.1% Renter occupiedHouse owners and renters - Hispanic or Latino residents 785 23.3% Owner occupied2,577 76.7% Renter occupied
Language usage in Bellingham
English speakers - Total 86.2% of residents of Bellingham speak English at home.
5.5% of residents speak Spanish at home 3,768 75.1% Speak English very well1,248 24.9% Speak English less than very well8.2% of residents speak other language at home 5,195 69.3% Speak English very well2,296 30.7% Speak English less than very well
English speakers - Born in the United States 90.8% of residents of Bellingham speak English at home.
6.8% of residents speak Spanish at home 2,372 93.8% Speak English very well156 6.2% Speak English less than very well2.4% of residents speak other language at home 892 100.0% Speak English very well
English speakers - Native, born elsewhere 81.8% of residents of Bellingham speak English at home.
2.9% of residents speak Spanish at home 80 100.0% Speak English very well15.3% of residents speak other language at home 222 52.6% Speak English very well200 47.4% Speak English less than very well
English speakers - Foreign-born 31.5% of residents of Bellingham speak English at home.
17.6% of residents speak Spanish at home 685 38.5% Speak English very well1,092 61.5% Speak English less than very well51.0% of residents speak other language at home 3,224 62.5% Speak English very well1,935 37.5% Speak English less than very well
White (Caucasian) - Speak only English Native:
96.2% (62,946)Foreign-born:
51.9% (1,867)
White (Caucasian) - Speak another language Native:
3.8% (2,497)Foreign-born:
48.1% (1,732)
Black or African American - Speak only English Native:
94.3% (927)Foreign-born:
36.5% (75)
Black or African American - Speak another language Native:
6.1% (60)Foreign-born:
65.4% (135)
American Indian / Alaska Native - Speak only English Native:
82.8% (582)Foreign-born:
17.1% (13)
American Indian / Alaska Native - Speak another language Native:
17.5% (123)Foreign-born:
78.8% (60)
Asian - Speak only English Native:
44.6% (723)Foreign-born:
21.5% (1,004)
Asian - Speak another language Native:
55.4% (897)Foreign-born:
78.5% (3,675)
Native Hawaiian / Pacific Islander - Speak only English Native:
75.1% (145)Foreign-born:
23.8% (12)
Native Hawaiian / Pacific Islander - Speak another language Native:
21.1% (41)Foreign-born:
76.1% (39)
Other race - Speak only English Native:
100.0% (2,173)Foreign-born:
21.8% (178)
Other race - Speak another language Native:
40.3% (875)Foreign-born:
95.7% (781)
Two or more races - Speak only English Native:
85.4% (5,906)Foreign-born:
21.5% (270)
Two or more races - Speak another language Native:
14.4% (998)Foreign-born:
78.1% (983)
White alone - Speak only English Native:
96.6% (59,777)Foreign-born:
56.8% (1,867)
White alone - Speak another language Native:
3.4% (2,106)Foreign-born:
43.2% (1,420)
Hispanic or Latino - Speak only English Native:
73.8% (6,065)Foreign-born:
2.3% (40)
Hispanic or Latino - Speak another language Native:
26.2% (2,157)Foreign-born:
97.7% (1,734)
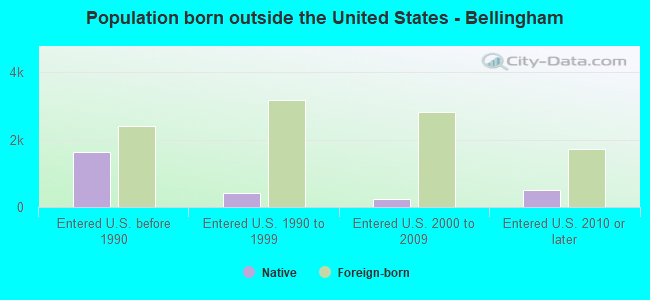
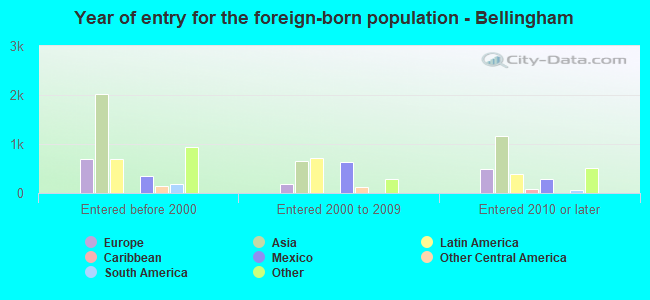
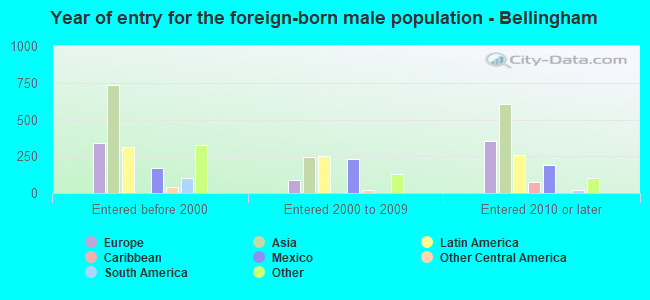
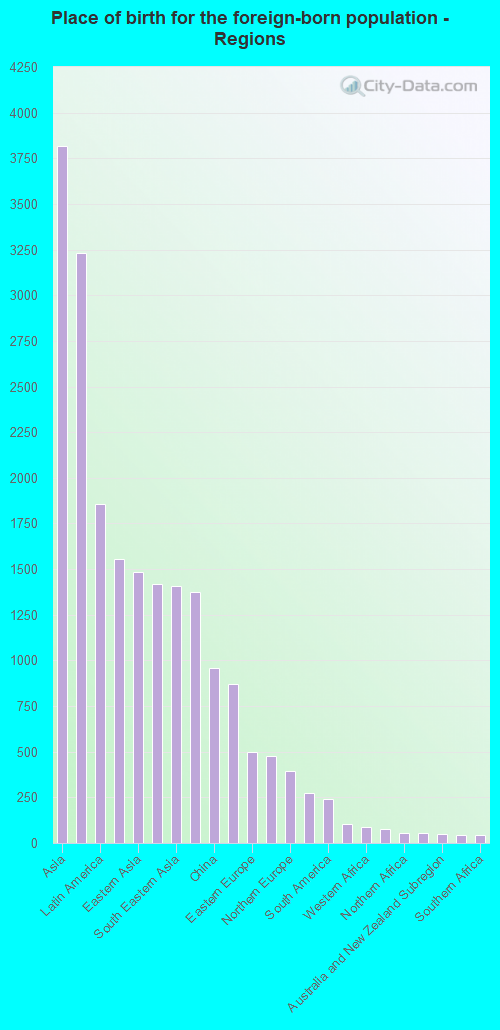
Foreign-born residents in Bellingham 8,845 residents are foreign born (4.0% Asia , 2.0% Latin America , 1.5% Europe , 1.4% North America ).
This city:
9.5%Washington:
14.9%
Marital status for residents in Bellingham Marital status - White (Caucasian) population 15 years and over
Males 46.0% Never married40.2% Now married2.9% Separated2.6% Widowed8.4% DivorcedFemales 44.5% Never married30.9% Now married1.4% Separated8.6% Widowed14.6% DivorcedWomen who gave birth in the past 12 months Now married:
100.0% (720)Unmarried:
0.0% (0)
Women who did not give birth in the past 12 months Now married:
23.0% (4,287)Unmarried:
77.0% (14,313)
Marital status - Black or African American population 15 years and over
Males 55.8% Never married37.9% Now married2.0% Separated1.1% Widowed3.2% DivorcedFemales 42.9% Never married40.9% Now married11.4% Separated0.0% Widowed4.7% DivorcedWomen who gave birth in the past 12 months Now married:
100.0% (17)Unmarried:
0.0% (0)
Women who did not give birth in the past 12 months Now married:
44.7% (105)Unmarried:
55.3% (130)
Marital status - American Indian / Alaska Native population 15 years and over
Males 48.3% Never married30.6% Now married3.7% Separated0.0% Widowed17.4% DivorcedFemales 55.8% Never married40.2% Now married0.0% Separated0.0% Widowed4.0% DivorcedWomen who gave birth in the past 12 months Now married:
100.0% (25)Unmarried:
0.0% (0)
Women who did not give birth in the past 12 months Now married:
24.0% (61)Unmarried:
76.0% (195)
Marital status - Asian population 15 years and over
Males 52.5% Never married43.7% Now married0.4% Separated0.3% Widowed3.0% DivorcedFemales 50.4% Never married42.6% Now married0.5% Separated2.3% Widowed4.3% DivorcedWomen who gave birth in the past 12 months Now married:
100.0% (73)Unmarried:
0.0% (0)
Women who did not give birth in the past 12 months Now married:
27.5% (570)Unmarried:
72.5% (1,501)
Marital status - Native Hawaiian / Pacific Islander population 15 years and over
Males 66.1% Never married17.9% Now married0.0% Separated0.0% Widowed16.1% DivorcedFemales 35.6% Never married22.0% Now married0.0% Separated0.0% Widowed42.4% DivorcedWomen who did not give birth in the past 12 months Now married:
4.9% (4)Unmarried:
95.1% (83)
Marital status - Other race population 15 years and over
Males 58.4% Never married20.6% Now married4.1% Separated0.0% Widowed16.9% DivorcedFemales 48.6% Never married38.3% Now married5.2% Separated1.7% Widowed6.2% DivorcedWomen who did not give birth in the past 12 months Now married:
35.8% (379)Unmarried:
64.2% (678)
Marital status - Two or more races population 15 years and over
Males 70.7% Never married18.6% Now married2.1% Separated2.2% Widowed6.4% DivorcedFemales 57.8% Never married31.0% Now married1.3% Separated1.7% Widowed8.2% DivorcedWomen who gave birth in the past 12 months Now married:
45.5% (32)Unmarried:
54.5% (39)
Women who did not give birth in the past 12 months Now married:
26.2% (797)Unmarried:
73.8% (2,249)
Marital status - White alone, not Hispanic / Latino population 15 years and over
Males 45.7% Never married39.9% Now married3.0% Separated2.7% Widowed8.7% DivorcedFemales 44.6% Never married30.8% Now married0.8% Separated9.1% Widowed14.6% DivorcedWomen who gave birth in the past 12 months Now married:
100.0% (720)Unmarried:
0.0% (0)
Women who did not give birth in the past 12 months Now married:
21.2% (3,613)Unmarried:
78.8% (13,411)
Marital status - Hispanic or Latino population 15 years and over
Males 54.1% Never married21.4% Now married10.4% Separated0.0% Widowed14.0% DivorcedFemales 45.6% Never married38.5% Now married5.1% Separated0.9% Widowed9.9% DivorcedWomen who gave birth in the past 12 months Now married:
100.0% (48)Unmarried:
0.0% (0)
Women who did not give birth in the past 12 months Now married:
25.3% (776)Unmarried:
74.7% (2,288)
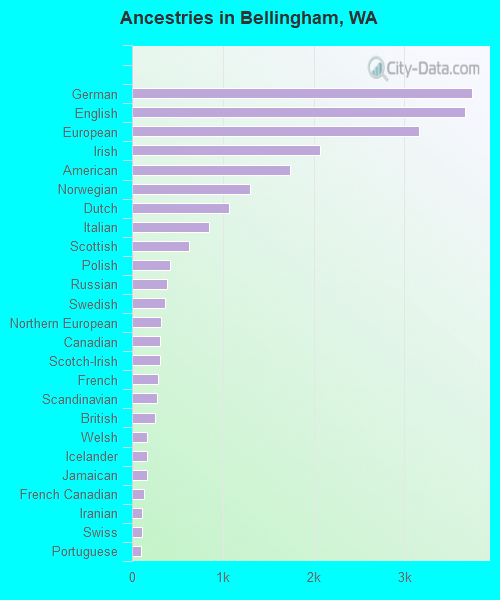
Ancestries in Bellingham
3,744 9.9% German3,663 9.7% English3,160 8.4% European2,071 5.5% Irish1,745 4.6% American1,302 3.5% Norwegian1,068 2.8% Dutch852 2.3% Italian626 1.7% Scottish423 1.1% Polish387 1.0% Russian360 1.0% Swedish318 0.8% Northern European312 0.8% Canadian307 0.8% Scotch-Irish284 0.8% French280 0.7% Scandinavian257 0.7% British162 0.4% Welsh161 0.4% Icelander160 0.4% Jamaican133 0.4% French Canadian107 0.3% Iranian106 0.3% Swiss101 0.3% Portuguese100 0.3% Serbian84 0.2% Lithuanian74 0.2% Celtic71 0.2% Ukrainian71 0.2% Eastern European71 0.2% Finnish66 0.2% Yugoslavian66 0.2% Danish63 0.2% Czech54 0.1% Bulgarian52 0.1% Austrian48 0.1% Romanian45 0.1% Egyptian41 0.1% Estonian37 0.10% Greek35 0.09% Ethiopian27 0.07% Turkish23 0.06% Arab19 0.05% Hungarian19 0.05% Slovene18 0.05% Australian16 0.04% Latvian14 0.04% Croatian11 0.03% Carpatho Rusyn10 0.03% Belgian10 0.03% Haitian9 0.02% African5 0.01% Somali
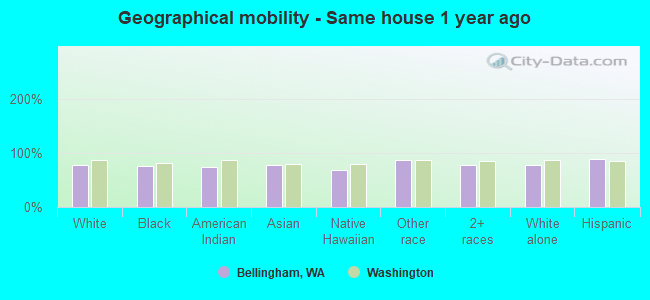
Geographical mobility in Bellingham Same house 1 year ago 54,710 77.8% White (Caucasian)906 75.3% Black or African American588 73.4% American Indian / Alaska Native4,915 77.1% Asian165 67.4% Native Hawaiian / Pacific Islander2,601 87.1% Other race6,840 78.3% Two or more races50,961 76.9% White alone, not Hispanic / Latino9,761 88.9% Hispanic or LatinoMoved within same county 6,851 9.7% White / Caucasian210 17.4% Black or African American65 8.1% American Indian / Alaska Native573 9.0% Asian30 12.4% Native Hawaiian / Pacific Islander144 4.8% Other race799 9.1% Two or more races6,671 10.1% White alone, not Hispanic / Latino557 5.1% Hispanic or LatinoMoved within same state 6,257 8.9% White / Caucasian29 2.4% Black or African American53 6.6% American Indian / Alaska Native647 10.1% Asian15 6.0% Native Hawaiian / Pacific Islander81 2.7% Other race855 9.8% Two or more races6,257 9.4% White alone, not Hispanic / Latino416 3.8% Hispanic or LatinoMoved from different state 2,387 3.4% White / Caucasian16 1.3% Black or African American84 10.5% American Indian / Alaska Native205 3.2% Asian27 11.1% Native Hawaiian / Pacific Islander166 5.6% Other race181 2.1% Two or more races2,387 3.6% White alone, not Hispanic / Latino153 1.4% Hispanic or LatinoMoved from abroad 96 0.1% White13 1.1% Black or African American38 0.6% Asian59 0.7% Two or more races96 0.9% Hispanic or Latino
Children Nativity (place of birth) in Bellingham
Children under 6 years - Living with two parents Both parents native 1,710 100.0% NativeBoth parents foreign-born 235 100.0% NativeOne native, one foreign-born parent 442 100.0% NativeChildren under 6 years - Living with one parent Native parent 443 100.0% NativeForeign-born parent 227 100.0% NativeChildren 6 to 17 years - Living with two parents Both parents native 4,254 98.2% Native77 1.8% Foreign-bornBoth parents foreign-born 486 78.5% Native133 21.5% Foreign-bornOne native, one foreign-born parent 572 100.0% NativeChildren 6 to 17 years - Living with one parent Native parent 2,391 100.0% NativeForeign-born parent 282 50.6% Native274 49.4% Foreign-born
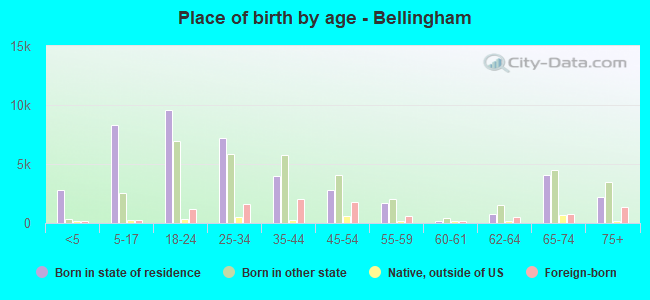
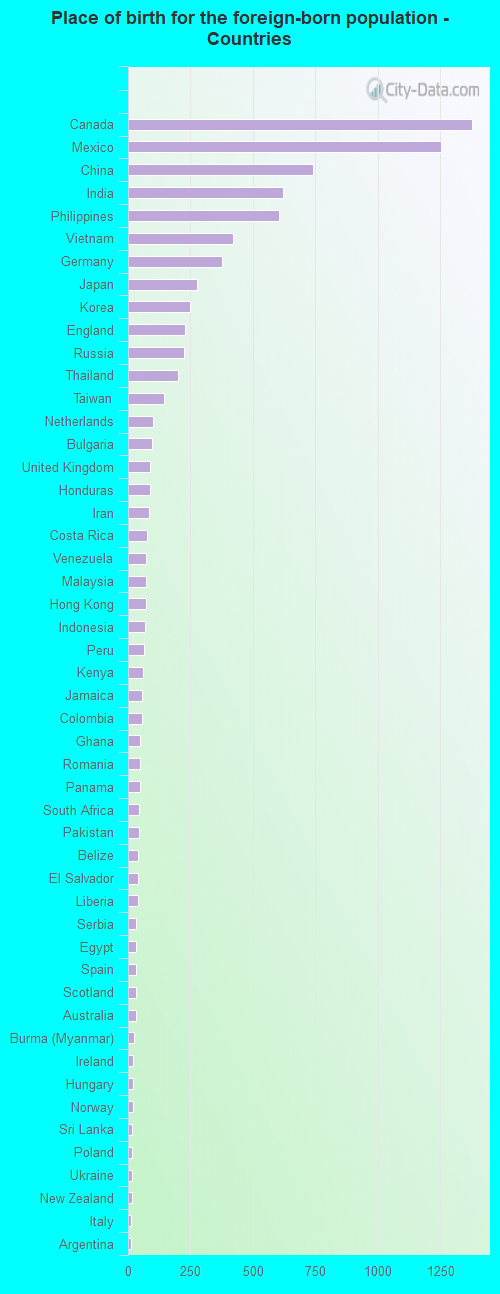
Place of birth for residents in Bellingham 3,820 Asia3,231 Americas1,855 Latin America1,556 Central America1,483 Eastern Asia1,417 Europe1,407 South Eastern Asia1,376 Northern America957 China869 South Central Asia496 Eastern Europe479 Western Europe394 Northern Europe273 Africa243 South America102 Oceania90 Western Africa74 Eastern Africa57 Northern Africa55 Caribbean47 Australia and New Zealand Subregion46 Southern Europe44 Southern Africa17 Western Asia6 Middle Africa1,376 Canada1,251 Mexico739 China621 India605 Philippines421 Vietnam375 Germany277 Japan248 Korea229 England225 Russia200 Thailand145 Taiwan100 Netherlands96 Bulgaria87 United Kingdom87 Honduras84 Iran77 Costa Rica74 Venezuela72 Malaysia71 Hong Kong68 Indonesia66 Peru62 Kenya55 Jamaica55 Colombia50 Ghana48 Romania47 Panama44 South Africa43 Pakistan42 Belize42 El Salvador39 Liberia33 Serbia33 Egypt32 Spain31 Scotland31 Australia25 Burma (Myanmar)22 Ireland22 Hungary20 Norway18 Sri Lanka18 Poland17 Ukraine16 New Zealand14 Italy14 Argentina12 Nepal12 Latvia12 Ethiopia11 Croatia11 Cambodia10 Saudi Arabia7 Guatemala7 United Arab Emirates6 Democratic Republic of Congo (Zaire)5 Bosnia and Herzegovina3 Denmark3 Switzerland
Grandparents responsible for own grandchildren in Bellingham
Grandparents (30 to 59 years) White / Caucasian 82 41.6% Responsible for grandchildren116 58.4% Not responsible for grandchildrenBlack or African American 11 100.0% Not responsible for grandchildrenOther race 27 100.0% Not responsible for grandchildrenTwo or more races 7 100.0% Not responsible for grandchildrenWhite alone, not Hispanic / Latino 66 34.1% Responsible for grandchildren128 65.9% Not responsible for grandchildrenHispanic or Latino 31 84.0% Responsible for grandchildren6 16.0% Not responsible for grandchildrenGrandparents (60 years and over) White / Caucasian 85 35.5% Responsible for grandchildren154 64.5% Not responsible for grandchildrenTwo or more races 18 100.0% Not responsible for grandchildrenWhite alone, not Hispanic / Latino 86 39.9% Responsible for grandchildren130 60.1% Not responsible for grandchildrenHispanic or Latino 47 100.0% Not responsible for grandchildren