Races in Billerica, Massachusetts (MA) Detailed Stats
Ancestries, Foreign-born residents, place of birth

Recent posts about races in Billerica, Massachusetts on our local forum with over 2,400,000 registered users:
 | Billerica Houses (47 replies) |
| Break-ins targeting South Asian families (58 replies) |
| Under $250k any Massachusetts single family house with yard (117 replies) |
| 2024 Real Estate Observations (759 replies) |
| towns that offer the most jobs per dollar of house (58 replies) |
| Billerica in 2019 (47 replies) |
Latest news about races in Billerica, MA collected exclusively by city-data.com from local newspapers, TV, and radio stations
6.2% of Billerica, MA residents are foreign-born (2.7% born in Asia, 2.1% born in Europe, 0.8% born in North America), which is 189.2% less than the foreign-born rate of 18.0% across the entire state of Massachusetts.
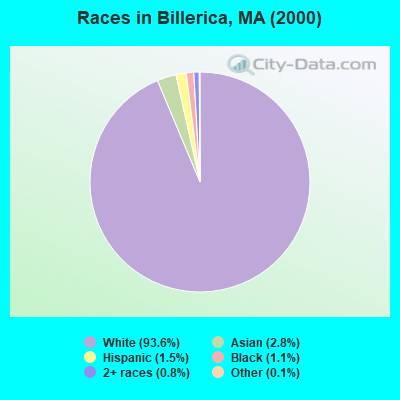
Race distribution in Billerica

- 36,48793.6%White alone
- 1,0732.8%Asian alone
- 6001.5%Hispanic
- 4181.1%Black alone
- 3140.8%Two or more races
- 410.1%Other race alone
- 360.09%American Indian alone
- 120.03%Native Hawaiian and Other
Pacific Islander alone
2000
2022
-
- 5,198,35981.9%White alone
- 428,7296.8%Hispanic
- 318,3295.0%Black alone
- 236,7863.7%Asian alone
- 110,3381.7%Two or more races
- 43,5860.7%Other race alone
- 11,2640.2%American Indian alone
- 1,7060.03%Native Hawaiian and Other
Pacific Islander alone

-
- 4,676,62767.0%White alone
- 911,03813.0%Hispanic
- 501,4637.2%Asian alone
- 459,7406.6%Black alone
- 341,8894.9%Two or more races
- 84,4031.2%Other race alone
- 5,8380.08%American Indian alone
- 9760.01%Native Hawaiian and Other
Pacific Islander alone

Income and house value in Billerica
- Median household income in 2022
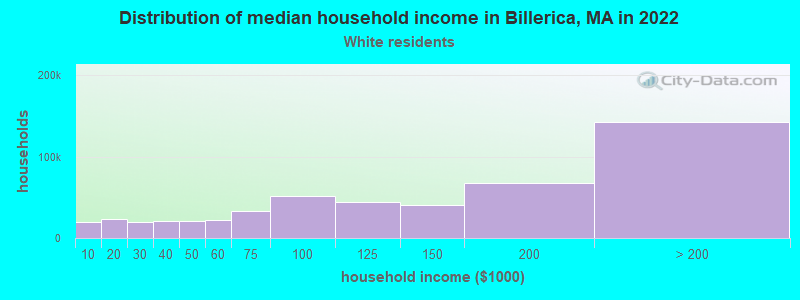
- $133,341White non-Hispanic householders
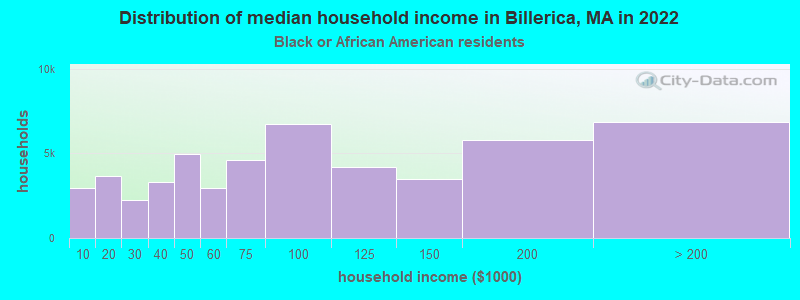
- $154,887Black householders
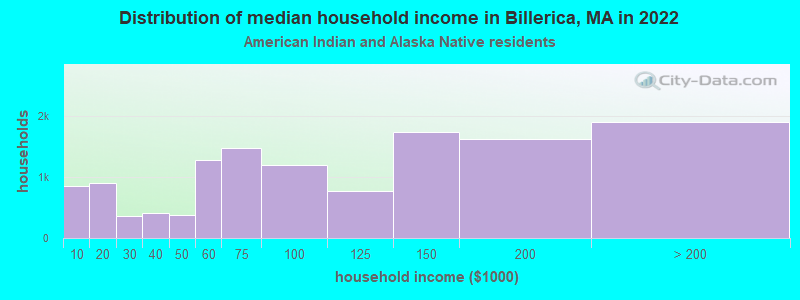
- over $200,000American Indian and Alaska Native householders
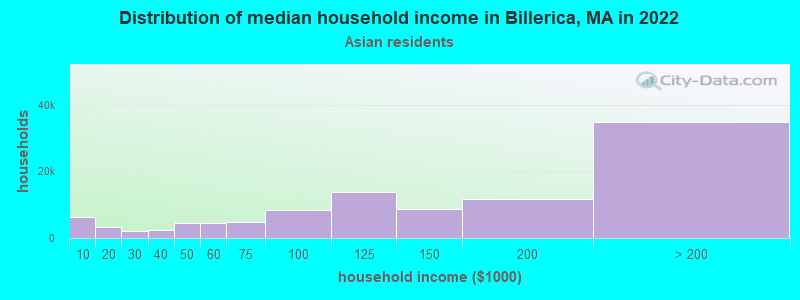
- $179,576Asian householders
- $77,732Some other race householders
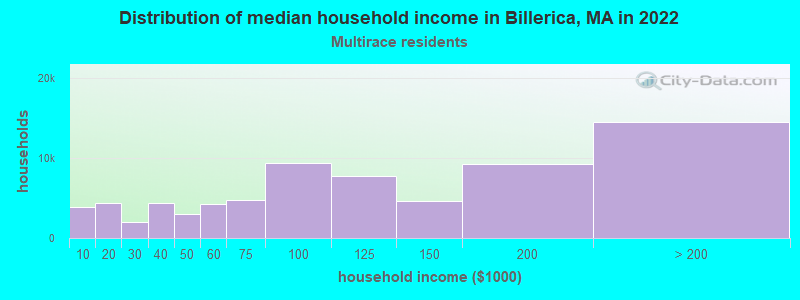
- $162,881Two or more races householders
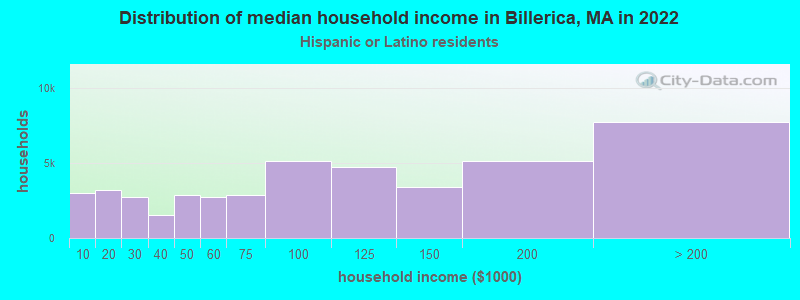
- $98,789Hispanic or Latino race householders
- Median 2022 house value
- $577,174White Non-Hispanic householders
- $573,217Black or African American householders
- $346,247American Indian or Alaska Native householders
- $669,318Asian householders
- $343,138Some other race householders
- $644,727Two or more races householders
- $532,797Hispanic or Latino householders
Household income for White non-Hispanic householders
Household income for Black householders
Household income for American Indian and Alaska Native householders
Household income for Asian householders
Household income for Two or more races householders
Household income for Hispanic or Latino race householders
Foreign-born residents in Billerica
2,426 residents are foreign born (2.7% Asia, 2.1% Europe, 0.8% North America).
| This city: | 6.2% |
| Massachusetts: | 12.2% |
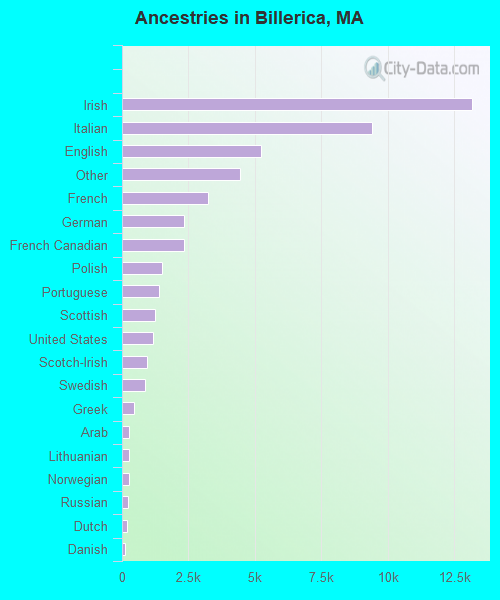
Ancestries in Billerica

- 13,15726.6%Irish
- 9,40319.0%Italian
- 5,23810.6%English
- 4,4309.0%Other
- 3,2566.6%French
- 2,3424.7%German
- 2,3234.7%French Canadian
- 1,5063.0%Polish
- 1,3832.8%Portuguese
- 1,2352.5%Scottish
- 1,1652.4%United States
- 9241.9%Scotch-Irish
- 8681.8%Swedish
- 4480.9%Greek
- 2820.6%Arab
- 2610.5%Lithuanian
- 2570.5%Norwegian
- 2290.5%Russian
- 1880.4%Dutch
- 1200.2%Danish
- 970.2%Welsh
- 680.1%Hungarian
- 680.1%Subsaharan African
- 530.1%Czech
- 510.1%Slovak
- 340.07%Ukrainian
- 240.05%Swiss
- 200.04%West Indian
Zip codes: 01821.