Races in Blue Mound, Texas (TX) Detailed Stats
Data:
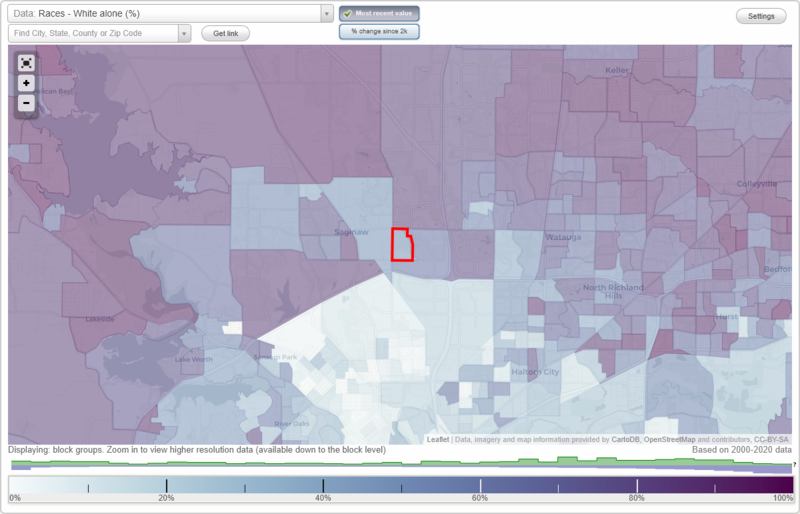
Races - White alone (%)
Races - White alone (% change since 2000)
Races - Black alone (%)
Races - Black alone (% change since 2000)
Races - American Indian alone (%)
Races - American Indian alone (% change since 2000)
Races - Asian alone (%)
Races - Asian alone (% change since 2000)
Races - Hispanic (%)
Races - Hispanic (% change since 2000)
Races - Native Hawaiian and Other Pacific Islander alone (%)
Races - Native Hawaiian and Other Pacific Islander alone (% change since 2000)
Races - Two or more races(%)
Races - Two or more races(% change since 2000)
Races - Other race alone (%)
Races - Other race alone (% change since 2000)
Racial diversity
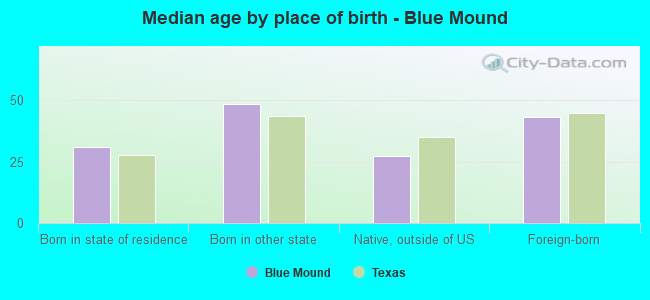
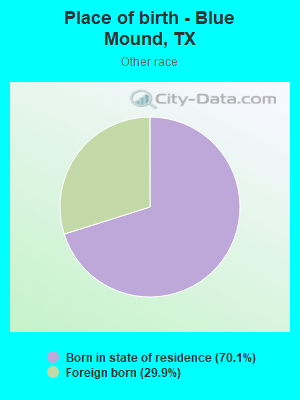
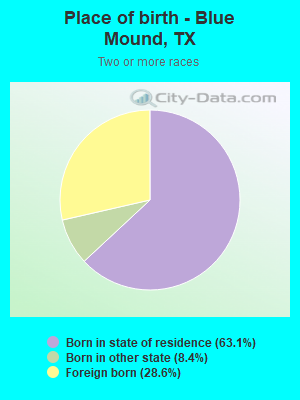
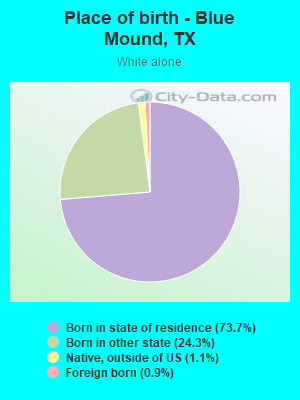
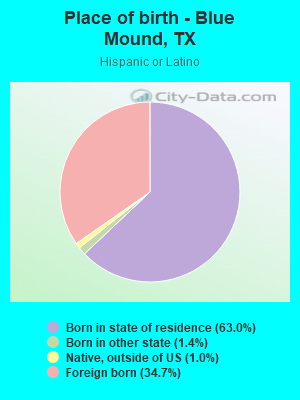
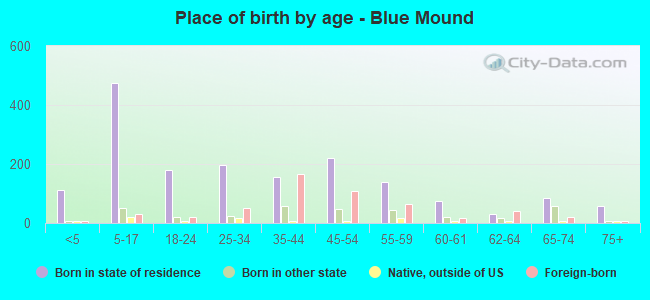
Place of birth - Born in state of residence (%)
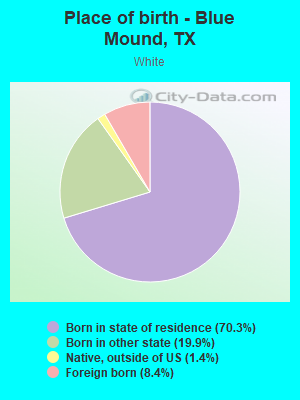
Place of birth - Born in state of residence (%) - White
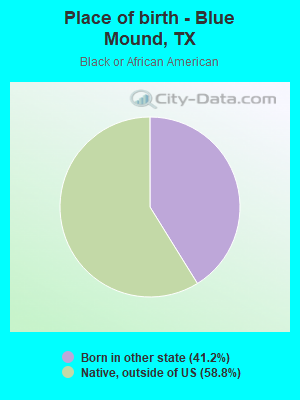
Place of birth - Born in state of residence (%) - Black or African American
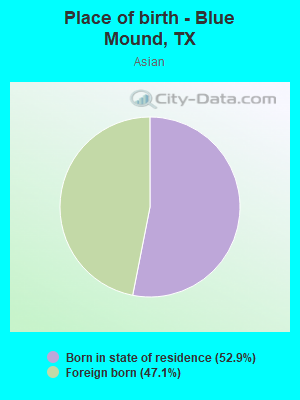
Place of birth - Born in state of residence (%) - Asian
Place of birth - Born in state of residence (%) - Hispanic or Latino
Place of birth - Born in state of residence (%) - American Indian and Alaska Native
Place of birth - Born in state of residence (%) - Multirace
Place of birth - Born in state of residence (%) - Other Race
Place of birth - Born in other state (%)
Place of birth - Born in other state (%) - White
Place of birth - Born in other state (%) - Black or African American
Place of birth - Born in other state (%) - Asian
Place of birth - Born in other state (%) - Hispanic or Latino
Place of birth - Born in other state (%) - American Indian and Alaska Native
Place of birth - Born in other state (%) - Multirace
Place of birth - Born in other state (%) - Other Race
Place of birth - Native, outside of US (%)
Place of birth - Native, outside of US (%) - White
Place of birth - Native, outside of US (%) - Black or African American
Place of birth - Native, outside of US (%) - Asian
Place of birth - Native, outside of US (%) - Hispanic or Latino
Place of birth - Native, outside of US (%) - American Indian and Alaska Native
Place of birth - Native, outside of US (%) - Multirace
Place of birth - Native, outside of US (%) - Other Race
Place of birth - Foreign born (%)
Place of birth - Foreign born (%) - White
Place of birth - Foreign born (%) - Black or African American
Place of birth - Foreign born (%) - Asian
Place of birth - Foreign born (%) - Hispanic or Latino
Place of birth - Foreign born (%) - American Indian and Alaska Native
Place of birth - Foreign born (%) - Multirace
Place of birth - Foreign born (%) - Other Race
Residents speaking English at home (%)
Residents speaking English at home - Born in the United States (%)
Residents speaking English at home - Native, born elsewhere (%)
Residents speaking English at home - Foreign born (%)
Residents speaking Spanish at home (%)
Residents speaking Spanish at home - Born in the United States (%)
Residents speaking Spanish at home - Native, born elsewhere (%)
Residents speaking Spanish at home - Foreign born (%)
Residents speaking other language at home (%)
Residents speaking other language at home - Born in the United States (%)
Residents speaking other language at home - Native, born elsewhere (%)
Residents speaking other language at home - Foreign born (%)
Marital status - Never married (%)
Marital status - Now married (%)
Marital status - Separated (%)
Marital status - Widowed (%)
Marital status - Divorced (%)
Ancestries Reported - Arab (%)
Ancestries Reported - Czech (%)
Ancestries Reported - Danish (%)
Ancestries Reported - Dutch (%)
Ancestries Reported - English (%)
Ancestries Reported - French (%)
Ancestries Reported - French Canadian (%)
Ancestries Reported - German (%)
Ancestries Reported - Greek (%)
Ancestries Reported - Hungarian (%)
Ancestries Reported - Irish (%)
Ancestries Reported - Italian (%)
Ancestries Reported - Lithuanian (%)
Ancestries Reported - Norwegian (%)
Ancestries Reported - Polish (%)
Ancestries Reported - Portuguese (%)
Ancestries Reported - Russian (%)
Ancestries Reported - Scotch-Irish (%)
Ancestries Reported - Scottish (%)
Ancestries Reported - Slovak (%)
Ancestries Reported - Subsaharan African (%)
Ancestries Reported - Swedish (%)
Ancestries Reported - Swiss (%)
Ancestries Reported - Ukrainian (%)
Ancestries Reported - United States (%)
Ancestries Reported - Welsh (%)
Ancestries Reported - West Indian (%)
Ancestries Reported - Other (%)
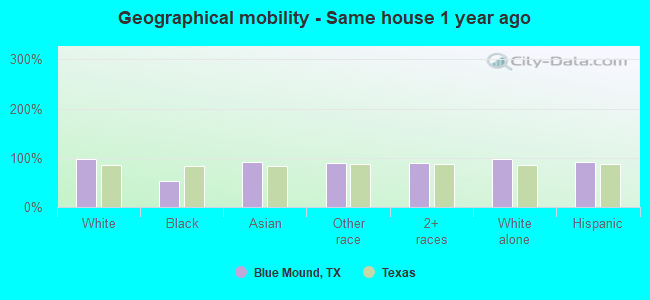
Geographical mobility - Same house 1 year ago (%)
Geographical mobility - Same house 1 year ago (%) - White
Geographical mobility - Same house 1 year ago (%) - Black or African American
Geographical mobility - Same house 1 year ago (%) - Asian
Geographical mobility - Same house 1 year ago (%) - Hispanic or Latino
Geographical mobility - Same house 1 year ago (%) - American Indian and Alaska Native
Geographical mobility - Same house 1 year ago (%) - Multirace
Geographical mobility - Same house 1 year ago (%) - Other Race
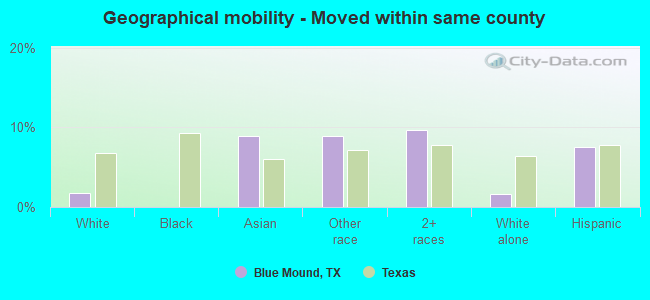
Geographical mobility - Moved within same county (%)
Geographical mobility - Moved within same county (%) - White
Geographical mobility - Moved within same county (%) - Black or African American
Geographical mobility - Moved within same county (%) - Asian
Geographical mobility - Moved within same county (%) - Hispanic or Latino
Geographical mobility - Moved within same county (%) - American Indian and Alaska Native
Geographical mobility - Moved within same county (%) - Multirace
Geographical mobility - Moved within same county (%) - Other Race
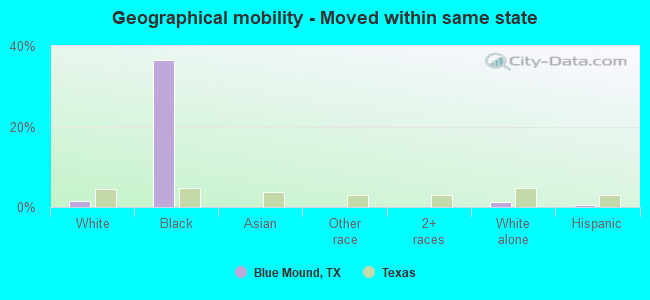
Geographical mobility - Moved from different county within same state (%)
Geographical mobility - Moved from different county within same state (%) - White
Geographical mobility - Moved from different county within same state (%) - Black or African American
Geographical mobility - Moved from different county within same state (%) - Asian
Geographical mobility - Moved from different county within same state (%) - Hispanic or Latino
Geographical mobility - Moved from different county within same state (%) - American Indian and Alaska Native
Geographical mobility - Moved from different county within same state (%) - Multirace
Geographical mobility - Moved from different county within same state (%) - Other Race
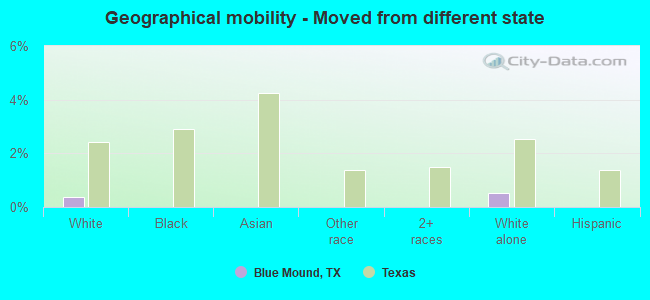
Geographical mobility - Moved from different state (%)
Geographical mobility - Moved from different state (%) - White
Geographical mobility - Moved from different state (%) - Black or African American
Geographical mobility - Moved from different state (%) - Asian
Geographical mobility - Moved from different state (%) - Hispanic or Latino
Geographical mobility - Moved from different state (%) - American Indian and Alaska Native
Geographical mobility - Moved from different state (%) - Multirace
Geographical mobility - Moved from different state (%) - Other Race
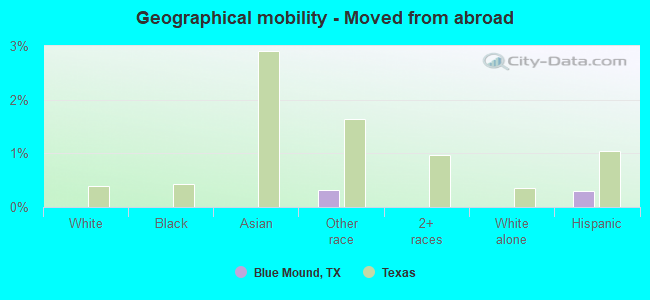
Geographical mobility - Moved from abroad (%)
Geographical mobility - Moved from abroad (%) - White
Geographical mobility - Moved from abroad (%) - Black or African American
Geographical mobility - Moved from abroad (%) - Asian
Geographical mobility - Moved from abroad (%) - Hispanic or Latino
Geographical mobility - Moved from abroad (%) - American Indian and Alaska Native
Geographical mobility - Moved from abroad (%) - Multirace
Geographical mobility - Moved from abroad (%) - Other Race
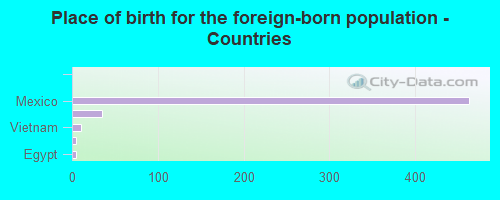
Place of birth for the foreign-born population - Ireland (%)
Place of birth for the foreign-born population - Denmark (%)
Place of birth for the foreign-born population - Norway (%)
Place of birth for the foreign-born population - Sweden (%)
Place of birth for the foreign-born population - United Kingdom (%)
Place of birth for the foreign-born population - England (%)
Place of birth for the foreign-born population - Scotland (%)
Place of birth for the foreign-born population - Other Northern Europe (%)
Place of birth for the foreign-born population - Austria (%)
Place of birth for the foreign-born population - Belgium (%)
Place of birth for the foreign-born population - France (%)
Place of birth for the foreign-born population - Germany (%)
Place of birth for the foreign-born population - Netherlands (%)
Place of birth for the foreign-born population - Switzerland (%)
Place of birth for the foreign-born population - Other Western Europe (%)
Place of birth for the foreign-born population - Greece (%)
Place of birth for the foreign-born population - Italy (%)
Place of birth for the foreign-born population - Portugal (%)
Place of birth for the foreign-born population - Spain (%)
Place of birth for the foreign-born population - Other Southern Europe (%)
Place of birth for the foreign-born population - Albania (%)
Place of birth for the foreign-born population - Belarus (%)
Place of birth for the foreign-born population - Bosnia and Herzegovina (%)
Place of birth for the foreign-born population - Bulgaria (%)
Place of birth for the foreign-born population - Croatia (%)
Place of birth for the foreign-born population - Czechoslovakia (%)
Place of birth for the foreign-born population - Hungary (%)
Place of birth for the foreign-born population - Latvia (%)
Place of birth for the foreign-born population - Lithuania (%)
Place of birth for the foreign-born population - North Macedonia (Macedonia) (%)
Place of birth for the foreign-born population - Moldova (%)
Place of birth for the foreign-born population - Poland (%)
Place of birth for the foreign-born population - Romania (%)
Place of birth for the foreign-born population - Russia (%)
Place of birth for the foreign-born population - Serbia (%)
Place of birth for the foreign-born population - Ukraine (%)
Place of birth for the foreign-born population - Other Eastern Europe (%)
Place of birth for the foreign-born population - China (%)
Place of birth for the foreign-born population - Hong Kong (%)
Place of birth for the foreign-born population - Taiwan (%)
Place of birth for the foreign-born population - Japan (%)
Place of birth for the foreign-born population - Korea (%)
Place of birth for the foreign-born population - Other Eastern Asia (%)
Place of birth for the foreign-born population - Afghanistan (%)
Place of birth for the foreign-born population - Bangladesh (%)
Place of birth for the foreign-born population - India (%)
Place of birth for the foreign-born population - Iran (%)
Place of birth for the foreign-born population - Kazakhstan (%)
Place of birth for the foreign-born population - Nepal (%)
Place of birth for the foreign-born population - Pakistan (%)
Place of birth for the foreign-born population - Sri Lanka (%)
Place of birth for the foreign-born population - Uzbekistan (%)
Place of birth for the foreign-born population - Other South Central Asia (%)
Place of birth for the foreign-born population - Burma (%)
Place of birth for the foreign-born population - Cambodia (%)
Place of birth for the foreign-born population - Indonesia (%)
Place of birth for the foreign-born population - Laos (%)
Place of birth for the foreign-born population - Malaysia (%)
Place of birth for the foreign-born population - Philippines (%)
Place of birth for the foreign-born population - Singapore (%)
Place of birth for the foreign-born population - Thailand (%)
Place of birth for the foreign-born population - Vietnam (%)
Place of birth for the foreign-born population - Other South Eastern Asia (%)
Place of birth for the foreign-born population - Armenia (%)
Place of birth for the foreign-born population - Iraq (%)
Place of birth for the foreign-born population - Israel (%)
Place of birth for the foreign-born population - Jordan (%)
Place of birth for the foreign-born population - Kuwait (%)
Place of birth for the foreign-born population - Lebanon (%)
Place of birth for the foreign-born population - Saudi Arabia (%)
Place of birth for the foreign-born population - Syria (%)
Place of birth for the foreign-born population - Turkey (%)
Place of birth for the foreign-born population - Yemen (%)
Place of birth for the foreign-born population - Other Western Asia (%)
Place of birth for the foreign-born population - Eritrea (%)
Place of birth for the foreign-born population - Ethiopia (%)
Place of birth for the foreign-born population - Kenya (%)
Place of birth for the foreign-born population - Somalia (%)
Place of birth for the foreign-born population - Uganda (%)
Place of birth for the foreign-born population - Zimbabwe (%)
Place of birth for the foreign-born population - Other Eastern Africa (%)
Place of birth for the foreign-born population - Cameroon (%)
Place of birth for the foreign-born population - Congo (%)
Place of birth for the foreign-born population - Democratic Republic of Congo (Zaire) (%)
Place of birth for the foreign-born population - Other Middle Africa (%)
Place of birth for the foreign-born population - Egypt (%)
Place of birth for the foreign-born population - Morocco (%)
Place of birth for the foreign-born population - Sudan (%)
Place of birth for the foreign-born population - Other Northern Africa (%)
Place of birth for the foreign-born population - South Africa (%)
Place of birth for the foreign-born population - Other Southern Africa (%)
Place of birth for the foreign-born population - Cabo Verde (%)
Place of birth for the foreign-born population - Ghana (%)
Place of birth for the foreign-born population - Liberia (%)
Place of birth for the foreign-born population - Nigeria (%)
Place of birth for the foreign-born population - Senegal (%)
Place of birth for the foreign-born population - Sierra Leone (%)
Place of birth for the foreign-born population - Other Western Africa (%)
Place of birth for the foreign-born population - Australia (%)
Place of birth for the foreign-born population - New Zealand (%)
Place of birth for the foreign-born population - Fiji (%)
Place of birth for the foreign-born population - Micronesia (%)
Place of birth for the foreign-born population - Bahamas (%)
Place of birth for the foreign-born population - Barbados (%)
Place of birth for the foreign-born population - Cuba (%)
Place of birth for the foreign-born population - Dominica (%)
Place of birth for the foreign-born population - Dominican Republic (%)
Place of birth for the foreign-born population - Grenada (%)
Place of birth for the foreign-born population - Haiti (%)
Place of birth for the foreign-born population - Jamaica (%)
Place of birth for the foreign-born population - St. Vincent and the Grenadines (%)
Place of birth for the foreign-born population - Trinidad and Tobago (%)
Place of birth for the foreign-born population - West Indies (%)
Place of birth for the foreign-born population - Other Caribbean (%)
Place of birth for the foreign-born population - Belize (%)
Place of birth for the foreign-born population - Costa Rica (%)
Place of birth for the foreign-born population - El Salvador (%)
Place of birth for the foreign-born population - Guatemala (%)
Place of birth for the foreign-born population - Honduras (%)
Place of birth for the foreign-born population - Mexico (%)
Place of birth for the foreign-born population - Nicaragua (%)
Place of birth for the foreign-born population - Panama (%)
Place of birth for the foreign-born population - Other Central America (%)
Place of birth for the foreign-born population - Argentina (%)
Place of birth for the foreign-born population - Bolivia (%)
Place of birth for the foreign-born population - Brazil (%)
Place of birth for the foreign-born population - Chile (%)
Place of birth for the foreign-born population - Colombia (%)
Place of birth for the foreign-born population - Ecuador (%)
Place of birth for the foreign-born population - Guyana (%)
Place of birth for the foreign-born population - Peru (%)
Place of birth for the foreign-born population - Uruguay (%)
Place of birth for the foreign-born population - Venezuela (%)
Place of birth for the foreign-born population - Other South America (%)
Place of birth for the foreign-born population - Canada (%)
Place of birth for the foreign-born population - Other Northern America (%)
Place of birth for the foreign-born population - Other (%)
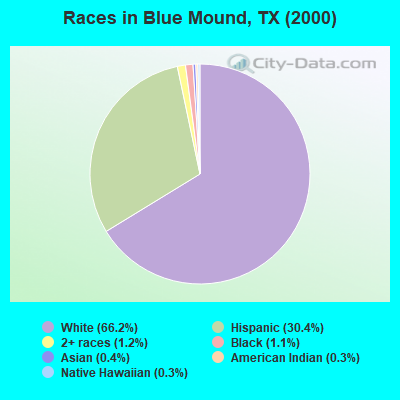
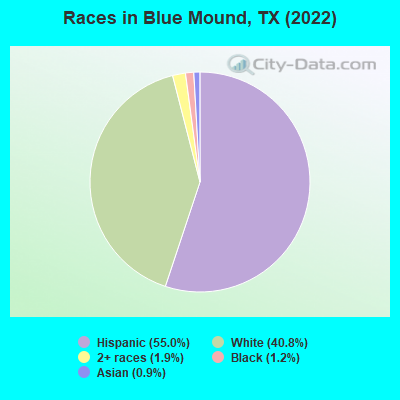
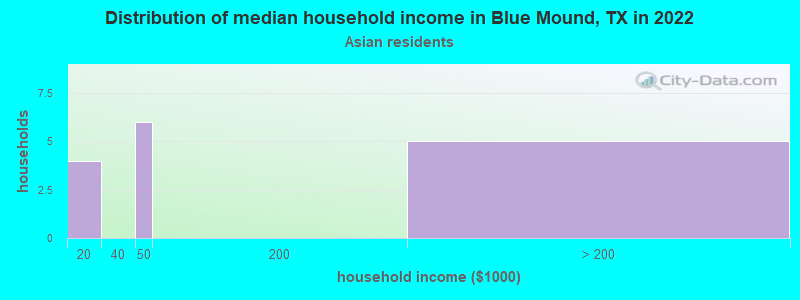
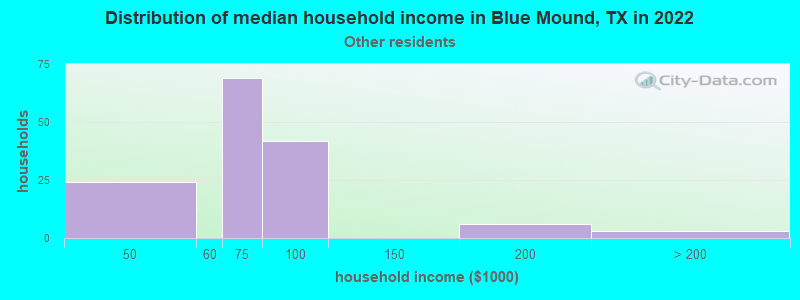
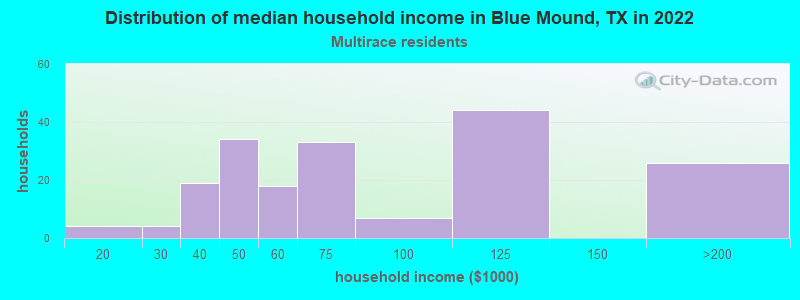
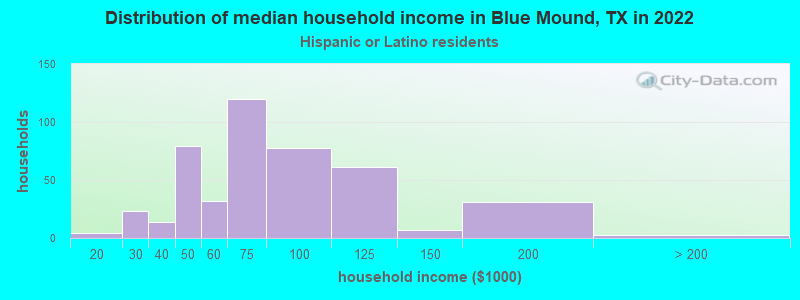
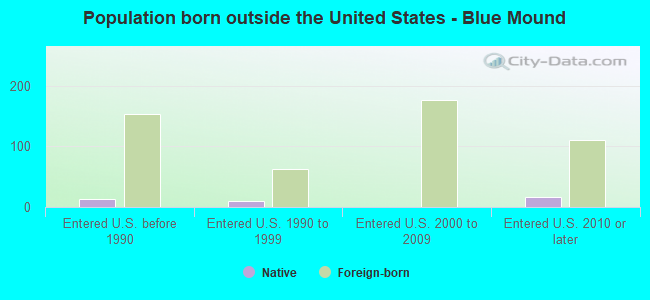
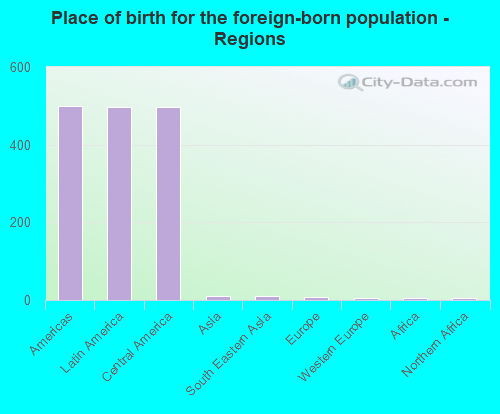
According to 2022 data, the most numerous races in Blue Mound, TX are Hispanic (1,469 residents), White alone (1,090 residents), and Black alone (31 residents). 58.9% of Blue Mound residents speak English at home. 19.6% of Blue Mound, TX residents are foreign-born (18.3% born in Latin America), which is 13.4% greater than the foreign-born rate of 17.0% across the entire state of Texas.
Race distribution in Blue Mound
2000 2022
10,933,313 52.4% White alone 6,669,666 32.0% Hispanic 2,364,255 11.3% Black alone 554,445 2.7% Asian alone 230,567 1.1% Two or more races 68,859 0.3% American Indian alone 19,958 0.10% Other race alone 10,757 0.05% Native Hawaiian and Other
12,070,642 40.2% Hispanic 11,683,430 38.9% White alone 3,508,706 11.7% Black alone 1,608,173 5.4% Asian alone 956,560 3.2% Two or more races 125,763 0.4% Other race alone 47,023 0.2% American Indian alone 29,275 0.10% Native Hawaiian and Other
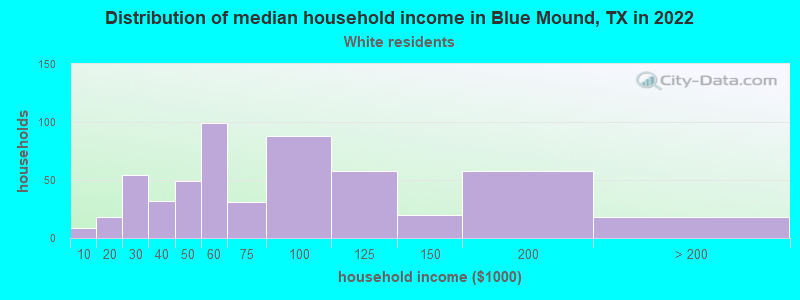
Income and house value in Blue Mound Median household income in 2022 $60,554 White non-Hispanic householders$67,500 Some other race householders$58,639 Two or more races householders$67,841 Hispanic or Latino race householdersMedian 2022 house value $179,946 White Non-Hispanic householders$224,501 American Indian or Alaska Native householders $155,424 Asian householders$206,541 Some other race householders$146,789 Two or more races householders$200,324 Hispanic or Latino householders
Median age by race in Blue Mound
42.6 Median age for White residents40.6 48.5 -666,666,666.0 Median age for Black or African American residents-666,666,666.0 -668,662,674.0 -831,349,205.5 Median age for American Indian / Alaska Native residents-867,996,200.5 -763,406,939.3 56.8 Median age for Asian residents-683,615,818.5 55.9 -565,040,649.8 Median age for Native Hawaiian / Pacific Islander residents-550,102,248.9 -551,928,782.8 31.8 Median age for Other race residents32.0 32.1 36.4 Median age for Two or more races residents26.6 44.1 44.4 Median age for White alone residents40.4 50.2 34.2 Median age for Hispanic or Latino residents32.8 37.2
Owner/renter occupied households by race in Blue Mound
House owners and renters - White residents 463 85.1% Owner occupied81 14.9% Renter occupiedHouse owners and renters - Black or African American residents 14 100.0% Renter occupiedHouse owners and renters - Asian residents 14 100.0% Owner occupiedHouse owners and renters - Other race residents 133 83.5% Owner occupied26 16.5% Renter occupiedHouse owners and renters - Two or more races residents 151 79.6% Owner occupied39 20.4% Renter occupiedHouse owners and renters - White alone residents 337 82.2% Owner occupied73 17.8% Renter occupiedHouse owners and renters - Hispanic or Latino residents 400 84.4% Owner occupied74 15.6% Renter occupied
Language usage in Blue Mound
English speakers - Total 58.9% of residents of Blue Mound speak English at home.
40.4% of residents speak Spanish at home 690 66.7% Speak English very well344 33.3% Speak English less than very well1.4% of residents speak other language at home 24 68.6% Speak English very well11 31.4% Speak English less than very well
English speakers - Born in the United States 95.7% of residents of Blue Mound speak English at home.
3.2% of residents speak Spanish at home 11 100.0% Speak English very well
English speakers - Native, born elsewhere 28.9% of residents of Blue Mound speak English at home.
33.3% of residents speak Spanish at home 15 100.0% Speak English very well46.7% of residents speak other language at home 21 100.0% Speak English very well
English speakers - Foreign-born 3.1% of residents of Blue Mound speak English at home.
95.5% of residents speak Spanish at home 156 31.6% Speak English very well337 68.4% Speak English less than very well1.7% of residents speak other language at home 4 44.4% Speak English very well5 55.6% Speak English less than very well
White (Caucasian) - Speak only English Native:
92.9% (1,118)Foreign-born:
12.5% (14)
White (Caucasian) - Speak another language Native:
6.9% (83)Foreign-born:
81.0% (91)
Asian - Speak another language Native:
88.1% (11)Foreign-born:
98.6% (10)
Other race - Speak another language Native:
67.3% (235)Foreign-born:
97.6% (148)
Two or more races - Speak another language Native:
39.7% (176)Foreign-born:
100.0% (177)
White alone - Speak only English Native:
100.0% (1,042)Foreign-born:
100.0% (10)
Hispanic or Latino - Speak only English Native:
40.1% (361)Foreign-born:
0.8% (4)
Hispanic or Latino - Speak another language Native:
60.0% (541)Foreign-born:
99.5% (496)
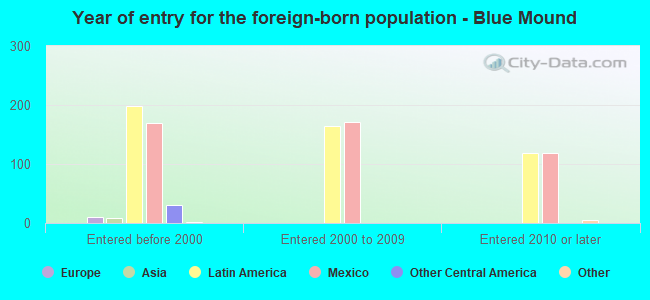
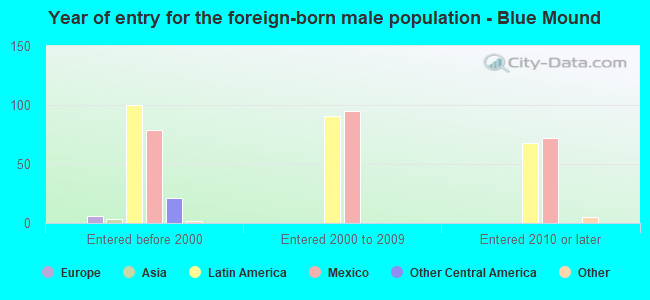
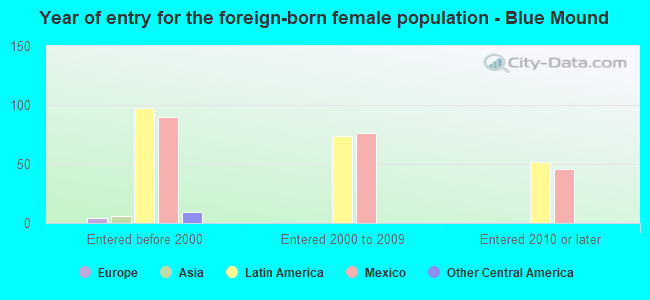
Foreign-born residents in Blue Mound 525 residents are foreign born (18.3% Latin America ).
This city:
19.6%Texas:
17.1%
Marital status for residents in Blue Mound Marital status - White (Caucasian) population 15 years and over
Males 31.3% Never married54.7% Now married3.2% Separated1.1% Widowed9.6% DivorcedFemales 22.9% Never married61.6% Now married0.5% Separated6.7% Widowed8.4% DivorcedWomen who gave birth in the past 12 months Now married:
23.1% (3)Unmarried:
76.9% (9)
Women who did not give birth in the past 12 months Now married:
56.1% (145)Unmarried:
43.9% (114)
Marital status - Black or African American population 15 years and over
Males 0.0% Never married100.0% Now married0.0% Separated0.0% Widowed0.0% DivorcedFemales 100.0% Never married0.0% Now married0.0% Separated0.0% Widowed0.0% DivorcedWomen who did not give birth in the past 12 months Now married:
0.0% (0)Unmarried:
100.0% (15)
Marital status - Asian population 15 years and over
Males 60.0% Never married40.0% Now married0.0% Separated0.0% Widowed0.0% DivorcedFemales 0.0% Never married83.3% Now married0.0% Separated16.7% Widowed0.0% DivorcedWomen who did not give birth in the past 12 months Now married:
100.0% (4)Unmarried:
0.0% (0)
Marital status - Other race population 15 years and over
Males 15.8% Never married72.7% Now married0.0% Separated0.0% Widowed11.5% DivorcedFemales 34.6% Never married62.4% Now married0.0% Separated0.0% Widowed2.9% DivorcedWomen who gave birth in the past 12 months Now married:
100.0% (3)Unmarried:
0.0% (0)
Women who did not give birth in the past 12 months Now married:
54.7% (88)Unmarried:
45.3% (73)
Marital status - Two or more races population 15 years and over
Males 50.6% Never married40.6% Now married1.9% Separated1.2% Widowed5.6% DivorcedFemales 33.6% Never married45.1% Now married2.7% Separated9.7% Widowed8.8% DivorcedWomen who gave birth in the past 12 months Now married:
100.0% (9)Unmarried:
0.0% (0)
Women who did not give birth in the past 12 months Now married:
42.0% (50)Unmarried:
58.0% (69)
Marital status - White alone, not Hispanic / Latino population 15 years and over
Males 33.7% Never married51.0% Now married2.7% Separated1.6% Widowed11.0% DivorcedFemales 23.8% Never married58.8% Now married0.7% Separated6.2% Widowed10.6% DivorcedWomen who gave birth in the past 12 months Now married:
30.0% (3)Unmarried:
70.0% (7)
Women who did not give birth in the past 12 months Now married:
53.2% (103)Unmarried:
46.8% (91)
Marital status - Hispanic or Latino population 15 years and over
Males 29.7% Never married60.3% Now married1.7% Separated0.4% Widowed7.9% DivorcedFemales 29.8% Never married61.0% Now married0.0% Separated5.2% Widowed4.0% DivorcedWomen who gave birth in the past 12 months Now married:
72.7% (8)Unmarried:
27.3% (3)
Women who did not give birth in the past 12 months Now married:
53.7% (191)Unmarried:
46.3% (165)
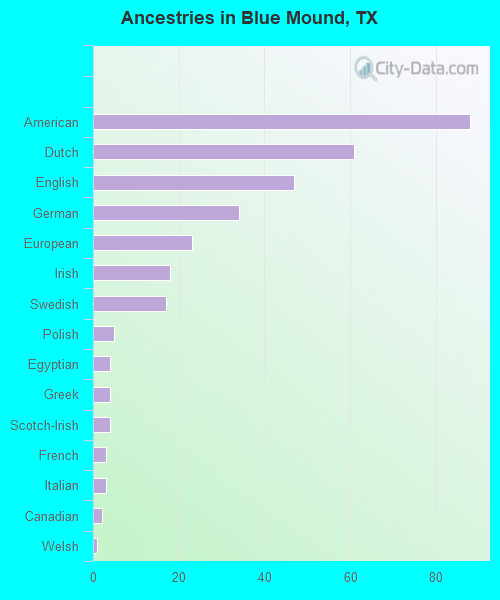
Ancestries in Blue Mound
88 5.4% American61 3.8% Dutch47 2.9% English34 2.1% German23 1.4% European18 1.1% Irish17 1.0% Swedish5 0.3% Polish4 0.2% Egyptian4 0.2% Greek4 0.2% Scotch-Irish3 0.2% French3 0.2% Italian2 0.1% Canadian1 0.06% Welsh
Children Nativity (place of birth) in Blue Mound
Children under 6 years - Living with two parents Both parents native 42 100.0% NativeBoth parents foreign-born 58 100.0% NativeOne native, one foreign-born parent 16 100.0% NativeChildren under 6 years - Living with one parent Native parent 19 100.0% NativeForeign-born parent 5 100.0% NativeChildren 6 to 17 years - Living with two parents Both parents native 200 99.4% Native1 0.6% Foreign-bornBoth parents foreign-born 200 88.5% Native26 11.5% Foreign-bornOne native, one foreign-born parent 16 100.0% NativeChildren 6 to 17 years - Living with one parent Native parent 109 100.0% NativeForeign-born parent 6 49.9% Native6 50.1% Foreign-born
Grandparents responsible for own grandchildren in Blue Mound
Grandparents (30 to 59 years) White / Caucasian 2 100.0% Not responsible for grandchildrenOther race 4 100.0% Not responsible for grandchildrenWhite alone, not Hispanic / Latino 2 100.0% Not responsible for grandchildrenHispanic or Latino 5 100.0% Not responsible for grandchildren
Grandparents (60 years and over) White / Caucasian 12 100.0% Not responsible for grandchildrenWhite alone, not Hispanic / Latino 8 100.0% Not responsible for grandchildrenHispanic or Latino 5 100.0% Not responsible for grandchildren