Races in Blythe, California (CA) Detailed Stats
Data:
Races - White alone (%)
Races - White alone (% change since 2000)
Races - Black alone (%)
Races - Black alone (% change since 2000)
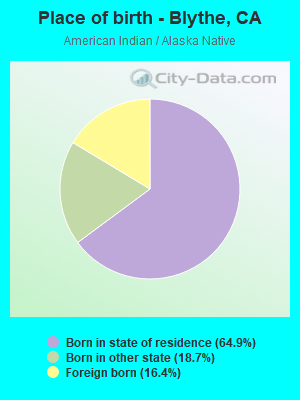
Races - American Indian alone (%)
Races - American Indian alone (% change since 2000)
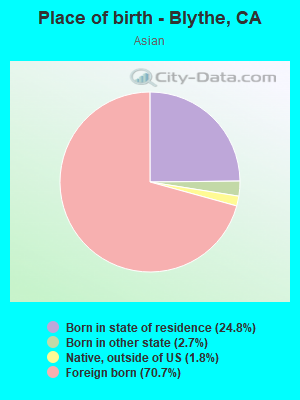
Races - Asian alone (%)
Races - Asian alone (% change since 2000)
Races - Hispanic (%)
Races - Hispanic (% change since 2000)
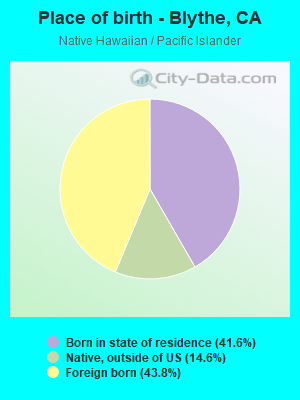
Races - Native Hawaiian and Other Pacific Islander alone (%)
Races - Native Hawaiian and Other Pacific Islander alone (% change since 2000)
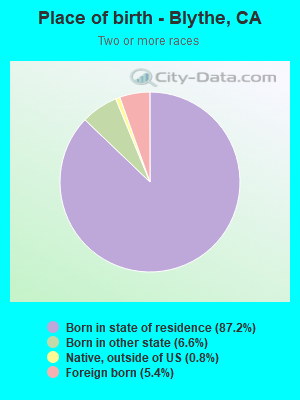
Races - Two or more races(%)
Races - Two or more races(% change since 2000)
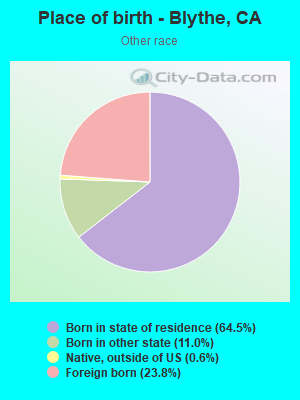
Races - Other race alone (%)
Races - Other race alone (% change since 2000)
Racial diversity
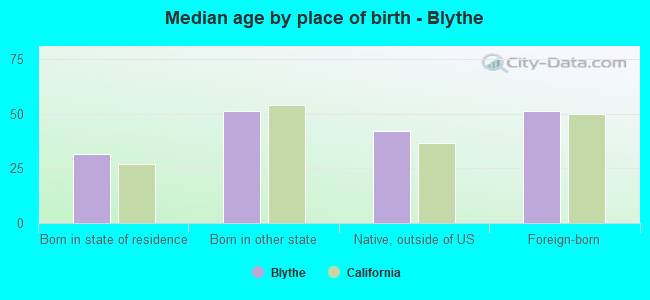
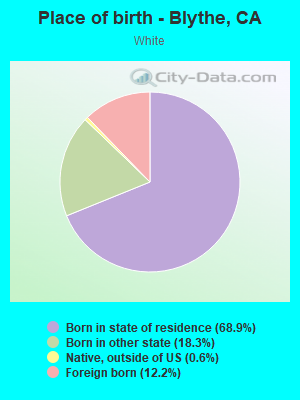
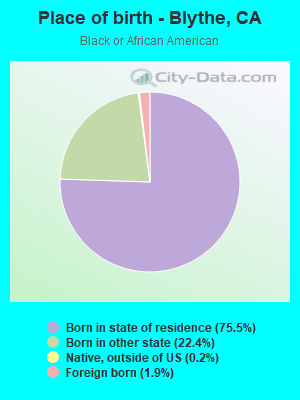
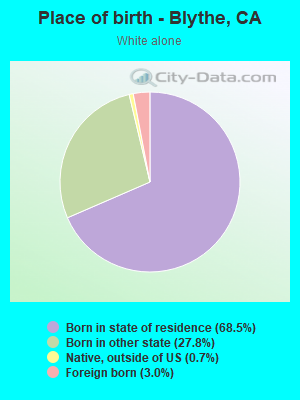
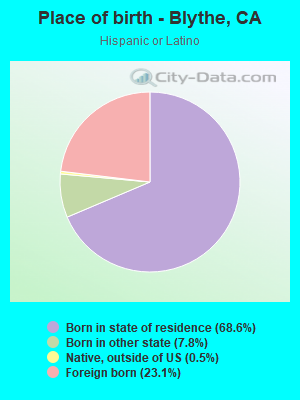
Place of birth - Born in state of residence (%)
Place of birth - Born in state of residence (%) - White
Place of birth - Born in state of residence (%) - Black or African American
Place of birth - Born in state of residence (%) - Asian
Place of birth - Born in state of residence (%) - Hispanic or Latino
Place of birth - Born in state of residence (%) - American Indian and Alaska Native
Place of birth - Born in state of residence (%) - Multirace
Place of birth - Born in state of residence (%) - Other Race
Place of birth - Born in other state (%)
Place of birth - Born in other state (%) - White
Place of birth - Born in other state (%) - Black or African American
Place of birth - Born in other state (%) - Asian
Place of birth - Born in other state (%) - Hispanic or Latino
Place of birth - Born in other state (%) - American Indian and Alaska Native
Place of birth - Born in other state (%) - Multirace
Place of birth - Born in other state (%) - Other Race
Place of birth - Native, outside of US (%)
Place of birth - Native, outside of US (%) - White
Place of birth - Native, outside of US (%) - Black or African American
Place of birth - Native, outside of US (%) - Asian
Place of birth - Native, outside of US (%) - Hispanic or Latino
Place of birth - Native, outside of US (%) - American Indian and Alaska Native
Place of birth - Native, outside of US (%) - Multirace
Place of birth - Native, outside of US (%) - Other Race
Place of birth - Foreign born (%)
Place of birth - Foreign born (%) - White
Place of birth - Foreign born (%) - Black or African American
Place of birth - Foreign born (%) - Asian
Place of birth - Foreign born (%) - Hispanic or Latino
Place of birth - Foreign born (%) - American Indian and Alaska Native
Place of birth - Foreign born (%) - Multirace
Place of birth - Foreign born (%) - Other Race
Residents speaking English at home (%)
Residents speaking English at home - Born in the United States (%)
Residents speaking English at home - Native, born elsewhere (%)
Residents speaking English at home - Foreign born (%)
Residents speaking Spanish at home (%)
Residents speaking Spanish at home - Born in the United States (%)
Residents speaking Spanish at home - Native, born elsewhere (%)
Residents speaking Spanish at home - Foreign born (%)
Residents speaking other language at home (%)
Residents speaking other language at home - Born in the United States (%)
Residents speaking other language at home - Native, born elsewhere (%)
Residents speaking other language at home - Foreign born (%)
Marital status - Never married (%)
Marital status - Now married (%)
Marital status - Separated (%)
Marital status - Widowed (%)
Marital status - Divorced (%)
Ancestries Reported - Arab (%)
Ancestries Reported - Czech (%)
Ancestries Reported - Danish (%)
Ancestries Reported - Dutch (%)
Ancestries Reported - English (%)
Ancestries Reported - French (%)
Ancestries Reported - French Canadian (%)
Ancestries Reported - German (%)
Ancestries Reported - Greek (%)
Ancestries Reported - Hungarian (%)
Ancestries Reported - Irish (%)
Ancestries Reported - Italian (%)
Ancestries Reported - Lithuanian (%)
Ancestries Reported - Norwegian (%)
Ancestries Reported - Polish (%)
Ancestries Reported - Portuguese (%)
Ancestries Reported - Russian (%)
Ancestries Reported - Scotch-Irish (%)
Ancestries Reported - Scottish (%)
Ancestries Reported - Slovak (%)
Ancestries Reported - Subsaharan African (%)
Ancestries Reported - Swedish (%)
Ancestries Reported - Swiss (%)
Ancestries Reported - Ukrainian (%)
Ancestries Reported - United States (%)
Ancestries Reported - Welsh (%)
Ancestries Reported - West Indian (%)
Ancestries Reported - Other (%)
Geographical mobility - Same house 1 year ago (%)
Geographical mobility - Same house 1 year ago (%) - White
Geographical mobility - Same house 1 year ago (%) - Black or African American
Geographical mobility - Same house 1 year ago (%) - Asian
Geographical mobility - Same house 1 year ago (%) - Hispanic or Latino
Geographical mobility - Same house 1 year ago (%) - American Indian and Alaska Native
Geographical mobility - Same house 1 year ago (%) - Multirace
Geographical mobility - Same house 1 year ago (%) - Other Race
Geographical mobility - Moved within same county (%)
Geographical mobility - Moved within same county (%) - White
Geographical mobility - Moved within same county (%) - Black or African American
Geographical mobility - Moved within same county (%) - Asian
Geographical mobility - Moved within same county (%) - Hispanic or Latino
Geographical mobility - Moved within same county (%) - American Indian and Alaska Native
Geographical mobility - Moved within same county (%) - Multirace
Geographical mobility - Moved within same county (%) - Other Race
Geographical mobility - Moved from different county within same state (%)
Geographical mobility - Moved from different county within same state (%) - White
Geographical mobility - Moved from different county within same state (%) - Black or African American
Geographical mobility - Moved from different county within same state (%) - Asian
Geographical mobility - Moved from different county within same state (%) - Hispanic or Latino
Geographical mobility - Moved from different county within same state (%) - American Indian and Alaska Native
Geographical mobility - Moved from different county within same state (%) - Multirace
Geographical mobility - Moved from different county within same state (%) - Other Race
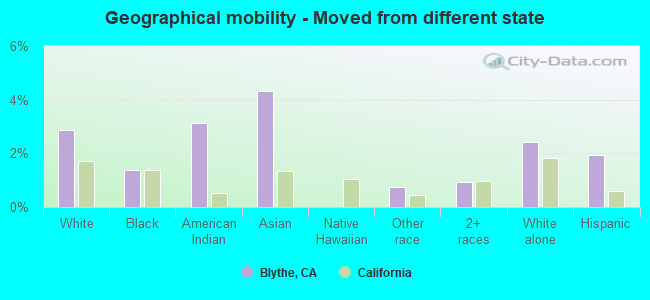
Geographical mobility - Moved from different state (%)
Geographical mobility - Moved from different state (%) - White
Geographical mobility - Moved from different state (%) - Black or African American
Geographical mobility - Moved from different state (%) - Asian
Geographical mobility - Moved from different state (%) - Hispanic or Latino
Geographical mobility - Moved from different state (%) - American Indian and Alaska Native
Geographical mobility - Moved from different state (%) - Multirace
Geographical mobility - Moved from different state (%) - Other Race
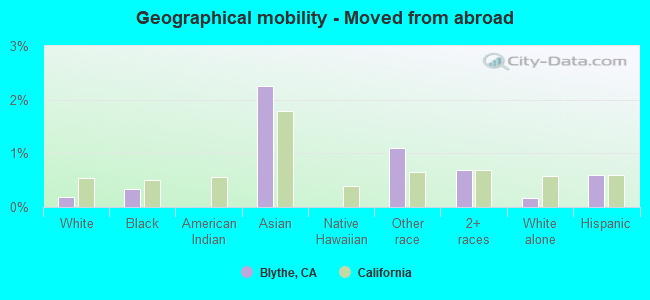
Geographical mobility - Moved from abroad (%)
Geographical mobility - Moved from abroad (%) - White
Geographical mobility - Moved from abroad (%) - Black or African American
Geographical mobility - Moved from abroad (%) - Asian
Geographical mobility - Moved from abroad (%) - Hispanic or Latino
Geographical mobility - Moved from abroad (%) - American Indian and Alaska Native
Geographical mobility - Moved from abroad (%) - Multirace
Geographical mobility - Moved from abroad (%) - Other Race
Place of birth for the foreign-born population - Ireland (%)
Place of birth for the foreign-born population - Denmark (%)
Place of birth for the foreign-born population - Norway (%)
Place of birth for the foreign-born population - Sweden (%)
Place of birth for the foreign-born population - United Kingdom (%)
Place of birth for the foreign-born population - England (%)
Place of birth for the foreign-born population - Scotland (%)
Place of birth for the foreign-born population - Other Northern Europe (%)
Place of birth for the foreign-born population - Austria (%)
Place of birth for the foreign-born population - Belgium (%)
Place of birth for the foreign-born population - France (%)
Place of birth for the foreign-born population - Germany (%)
Place of birth for the foreign-born population - Netherlands (%)
Place of birth for the foreign-born population - Switzerland (%)
Place of birth for the foreign-born population - Other Western Europe (%)
Place of birth for the foreign-born population - Greece (%)
Place of birth for the foreign-born population - Italy (%)
Place of birth for the foreign-born population - Portugal (%)
Place of birth for the foreign-born population - Spain (%)
Place of birth for the foreign-born population - Other Southern Europe (%)
Place of birth for the foreign-born population - Albania (%)
Place of birth for the foreign-born population - Belarus (%)
Place of birth for the foreign-born population - Bosnia and Herzegovina (%)
Place of birth for the foreign-born population - Bulgaria (%)
Place of birth for the foreign-born population - Croatia (%)
Place of birth for the foreign-born population - Czechoslovakia (%)
Place of birth for the foreign-born population - Hungary (%)
Place of birth for the foreign-born population - Latvia (%)
Place of birth for the foreign-born population - Lithuania (%)
Place of birth for the foreign-born population - North Macedonia (Macedonia) (%)
Place of birth for the foreign-born population - Moldova (%)
Place of birth for the foreign-born population - Poland (%)
Place of birth for the foreign-born population - Romania (%)
Place of birth for the foreign-born population - Russia (%)
Place of birth for the foreign-born population - Serbia (%)
Place of birth for the foreign-born population - Ukraine (%)
Place of birth for the foreign-born population - Other Eastern Europe (%)
Place of birth for the foreign-born population - China (%)
Place of birth for the foreign-born population - Hong Kong (%)
Place of birth for the foreign-born population - Taiwan (%)
Place of birth for the foreign-born population - Japan (%)
Place of birth for the foreign-born population - Korea (%)
Place of birth for the foreign-born population - Other Eastern Asia (%)
Place of birth for the foreign-born population - Afghanistan (%)
Place of birth for the foreign-born population - Bangladesh (%)
Place of birth for the foreign-born population - India (%)
Place of birth for the foreign-born population - Iran (%)
Place of birth for the foreign-born population - Kazakhstan (%)
Place of birth for the foreign-born population - Nepal (%)
Place of birth for the foreign-born population - Pakistan (%)
Place of birth for the foreign-born population - Sri Lanka (%)
Place of birth for the foreign-born population - Uzbekistan (%)
Place of birth for the foreign-born population - Other South Central Asia (%)
Place of birth for the foreign-born population - Burma (%)
Place of birth for the foreign-born population - Cambodia (%)
Place of birth for the foreign-born population - Indonesia (%)
Place of birth for the foreign-born population - Laos (%)
Place of birth for the foreign-born population - Malaysia (%)
Place of birth for the foreign-born population - Philippines (%)
Place of birth for the foreign-born population - Singapore (%)
Place of birth for the foreign-born population - Thailand (%)
Place of birth for the foreign-born population - Vietnam (%)
Place of birth for the foreign-born population - Other South Eastern Asia (%)
Place of birth for the foreign-born population - Armenia (%)
Place of birth for the foreign-born population - Iraq (%)
Place of birth for the foreign-born population - Israel (%)
Place of birth for the foreign-born population - Jordan (%)
Place of birth for the foreign-born population - Kuwait (%)
Place of birth for the foreign-born population - Lebanon (%)
Place of birth for the foreign-born population - Saudi Arabia (%)
Place of birth for the foreign-born population - Syria (%)
Place of birth for the foreign-born population - Turkey (%)
Place of birth for the foreign-born population - Yemen (%)
Place of birth for the foreign-born population - Other Western Asia (%)
Place of birth for the foreign-born population - Eritrea (%)
Place of birth for the foreign-born population - Ethiopia (%)
Place of birth for the foreign-born population - Kenya (%)
Place of birth for the foreign-born population - Somalia (%)
Place of birth for the foreign-born population - Uganda (%)
Place of birth for the foreign-born population - Zimbabwe (%)
Place of birth for the foreign-born population - Other Eastern Africa (%)
Place of birth for the foreign-born population - Cameroon (%)
Place of birth for the foreign-born population - Congo (%)
Place of birth for the foreign-born population - Democratic Republic of Congo (Zaire) (%)
Place of birth for the foreign-born population - Other Middle Africa (%)
Place of birth for the foreign-born population - Egypt (%)
Place of birth for the foreign-born population - Morocco (%)
Place of birth for the foreign-born population - Sudan (%)
Place of birth for the foreign-born population - Other Northern Africa (%)
Place of birth for the foreign-born population - South Africa (%)
Place of birth for the foreign-born population - Other Southern Africa (%)
Place of birth for the foreign-born population - Cabo Verde (%)
Place of birth for the foreign-born population - Ghana (%)
Place of birth for the foreign-born population - Liberia (%)
Place of birth for the foreign-born population - Nigeria (%)
Place of birth for the foreign-born population - Senegal (%)
Place of birth for the foreign-born population - Sierra Leone (%)
Place of birth for the foreign-born population - Other Western Africa (%)
Place of birth for the foreign-born population - Australia (%)
Place of birth for the foreign-born population - New Zealand (%)
Place of birth for the foreign-born population - Fiji (%)
Place of birth for the foreign-born population - Micronesia (%)
Place of birth for the foreign-born population - Bahamas (%)
Place of birth for the foreign-born population - Barbados (%)
Place of birth for the foreign-born population - Cuba (%)
Place of birth for the foreign-born population - Dominica (%)
Place of birth for the foreign-born population - Dominican Republic (%)
Place of birth for the foreign-born population - Grenada (%)
Place of birth for the foreign-born population - Haiti (%)
Place of birth for the foreign-born population - Jamaica (%)
Place of birth for the foreign-born population - St. Vincent and the Grenadines (%)
Place of birth for the foreign-born population - Trinidad and Tobago (%)
Place of birth for the foreign-born population - West Indies (%)
Place of birth for the foreign-born population - Other Caribbean (%)
Place of birth for the foreign-born population - Belize (%)
Place of birth for the foreign-born population - Costa Rica (%)
Place of birth for the foreign-born population - El Salvador (%)
Place of birth for the foreign-born population - Guatemala (%)
Place of birth for the foreign-born population - Honduras (%)
Place of birth for the foreign-born population - Mexico (%)
Place of birth for the foreign-born population - Nicaragua (%)
Place of birth for the foreign-born population - Panama (%)
Place of birth for the foreign-born population - Other Central America (%)
Place of birth for the foreign-born population - Argentina (%)
Place of birth for the foreign-born population - Bolivia (%)
Place of birth for the foreign-born population - Brazil (%)
Place of birth for the foreign-born population - Chile (%)
Place of birth for the foreign-born population - Colombia (%)
Place of birth for the foreign-born population - Ecuador (%)
Place of birth for the foreign-born population - Guyana (%)
Place of birth for the foreign-born population - Peru (%)
Place of birth for the foreign-born population - Uruguay (%)
Place of birth for the foreign-born population - Venezuela (%)
Place of birth for the foreign-born population - Other South America (%)
Place of birth for the foreign-born population - Canada (%)
Place of birth for the foreign-born population - Other Northern America (%)
Place of birth for the foreign-born population - Other (%)
Latest news about races in Blythe, CA collected exclusively by city-data.com from local newspapers, TV, and radio stations
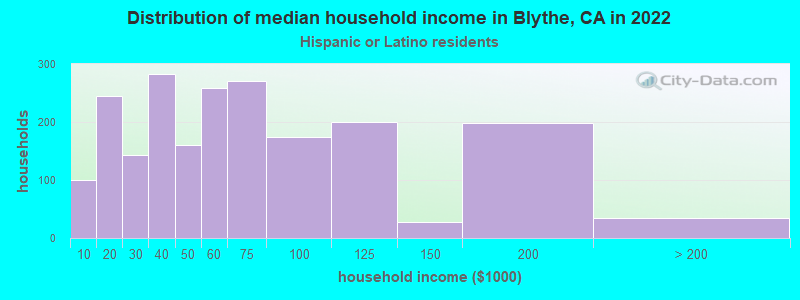
According to 2022 data, the most numerous races in Blythe, CA are Hispanic (11,997 residents), White alone (4,743 residents), and Asian alone (513 residents). 57.4% of Blythe residents speak English at home. 16.6% of Blythe, CA residents are foreign-born (14.1% born in Latin America, 1.9% born in Asia), which is 56.7% less than the foreign-born rate of 26.0% across the entire state of California.
Race distribution in Blythe
2000 2022
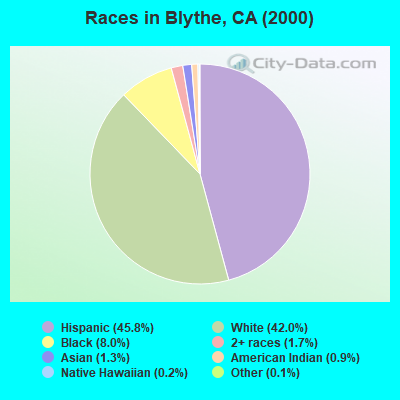
15,816,790 46.7% White alone 10,966,556 32.4% Hispanic 3,648,860 10.8% Asian alone 2,181,926 6.4% Black alone 903,115 2.7% Two or more races 178,984 0.5% American Indian alone 103,736 0.3% Native Hawaiian and Other 71,681 0.2% Other race alone
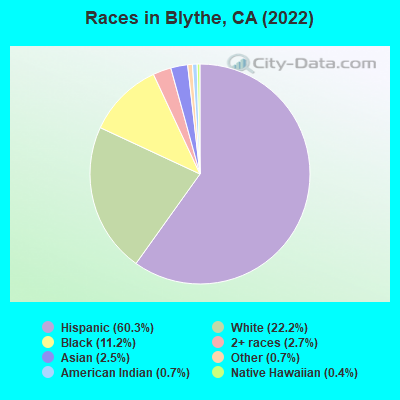
15,732,184 40.3% Hispanic 13,160,426 33.7% White alone 5,957,867 15.3% Asian alone 2,025,218 5.2% Black alone 1,663,222 4.3% Two or more races 251,618 0.6% Other race alone 135,777 0.3% Native Hawaiian and Other 103,030 0.3% American Indian alone
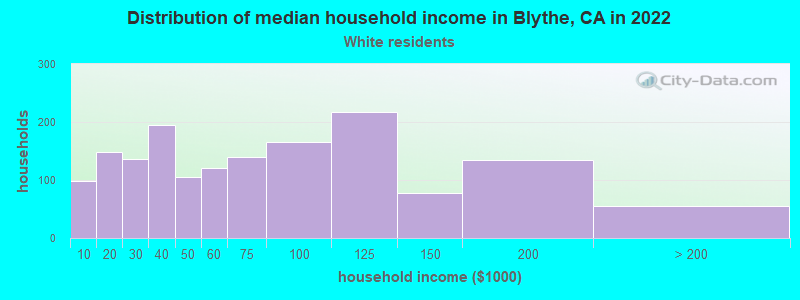
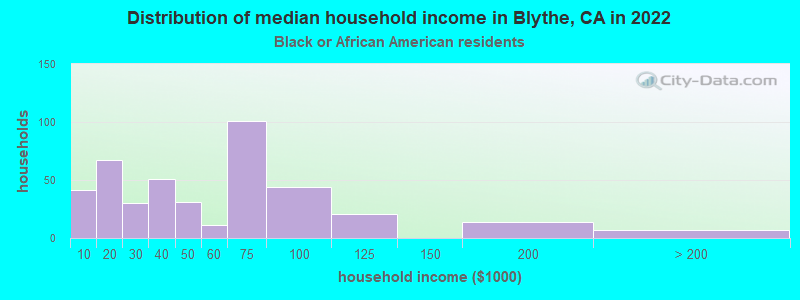
Income and house value in Blythe Median household income in 2022 $63,647 White non-Hispanic householders$34,743 Black householders$46,586 American Indian and Alaska Native householders$102,152 Asian householders$50,823 Some other race householders$29,784 Two or more races householders$61,631 Hispanic or Latino race householdersMedian 2022 house value $360,289 White Non-Hispanic householders$277,865 Black or African American householders$809,841 American Indian or Alaska Native householders$285,064 Some other race householders$332,215 Two or more races householders$293,342 Hispanic or Latino householders
Median age by race in Blythe
42.2 Median age for White residents41.4 45.3 41.1 Median age for Black or African American residents38.3 56.1 48.9 Median age for American Indian / Alaska Native residents49.8 74.2 42.9 Median age for Asian residents39.1 50.0 51.1 Median age for Native Hawaiian / Pacific Islander residents30.1 Median age for Other race residents25.4 33.8 20.6 Median age for Two or more races residents24.8 19.8 46.4 Median age for White alone residents46.4 47.1 33.0 Median age for Hispanic or Latino residents33.7 30.2
Owner/renter occupied households by race in Blythe
House owners and renters - White residents 1,358 61.6% Owner occupied846 38.4% Renter occupiedHouse owners and renters - Black or African American residents 208 46.9% Owner occupied236 53.1% Renter occupiedHouse owners and renters - American Indian / Alaska Native residents 37 63.7% Owner occupied21 36.3% Renter occupiedHouse owners and renters - Asian residents 67 46.2% Owner occupied78 53.8% Renter occupiedHouse owners and renters - Other race residents 867 47.5% Owner occupied957 52.5% Renter occupiedHouse owners and renters - Two or more races residents 521 62.4% Owner occupied314 37.6% Renter occupiedHouse owners and renters - White alone residents 1,054 56.8% Owner occupied802 43.2% Renter occupiedHouse owners and renters - Hispanic or Latino residents 1,403 56.6% Owner occupied1,077 43.4% Renter occupied
Language usage in Blythe
English speakers - Total 57.4% of residents of Blythe speak English at home.
39.0% of residents speak Spanish at home 5,059 70.6% Speak English very well2,107 29.4% Speak English less than very well3.6% of residents speak other language at home 519 78.6% Speak English very well141 21.4% Speak English less than very well
English speakers - Born in the United States 75.6% of residents of Blythe speak English at home.
23.2% of residents speak Spanish at home 528 84.2% Speak English very well99 15.8% Speak English less than very well1.2% of residents speak other language at home 32 100.0% Speak English very well
English speakers - Native, born elsewhere 58.6% of residents of Blythe speak English at home.
36.8% of residents speak Spanish at home 49 100.0% Speak English very well4.5% of residents speak other language at home 6 100.0% Speak English very well
English speakers - Foreign-born 7.6% of residents of Blythe speak English at home.
77.3% of residents speak Spanish at home 942 37.2% Speak English very well1,588 62.8% Speak English less than very well13.2% of residents speak other language at home 293 67.8% Speak English very well139 32.2% Speak English less than very well
White (Caucasian) - Speak only English Native:
75.7% (5,376)Foreign-born:
8.8% (91)
White (Caucasian) - Speak another language Native:
22.2% (1,575)Foreign-born:
89.2% (915)
Black or African American - Speak only English Native:
95.7% (2,069)Foreign-born:
21.1% (9)
Black or African American - Speak another language Native:
3.9% (85)Foreign-born:
78.4% (33)
American Indian / Alaska Native - Speak another language Native:
51.9% (93)Foreign-born:
100.0% (34)
Asian - Speak only English Native:
26.7% (43)Foreign-born:
10.0% (38)
Asian - Speak another language Native:
60.4% (97)Foreign-born:
89.4% (339)
Native Hawaiian / Pacific Islander - Speak another language Native:
28.6% (12)Foreign-born:
87.8% (26)
Other race - Speak only English Native:
38.4% (1,523)Foreign-born:
8.6% (124)
Other race - Speak another language Native:
62.4% (2,475)Foreign-born:
92.4% (1,331)
Two or more races - Speak only English Native:
64.7% (2,045)Foreign-born:
7.6% (17)
Two or more races - Speak another language Native:
33.9% (1,070)Foreign-born:
93.9% (210)
White alone - Speak only English Native:
95.0% (4,222)Foreign-born:
45.3% (66)
White alone - Speak another language Native:
5.1% (226)Foreign-born:
54.6% (79)
Hispanic or Latino - Speak only English Native:
45.1% (3,817)Foreign-born:
5.3% (141)
Hispanic or Latino - Speak another language Native:
55.1% (4,668)Foreign-born:
94.7% (2,533)
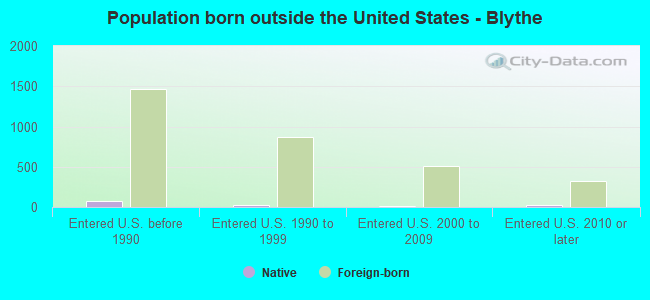
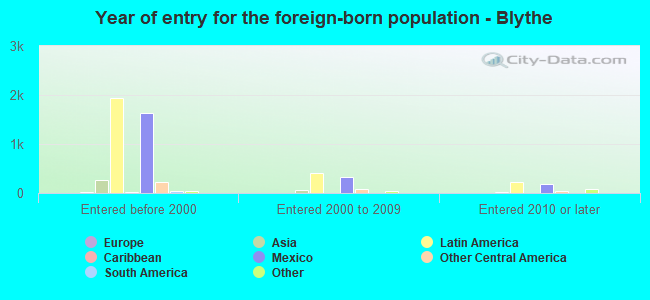
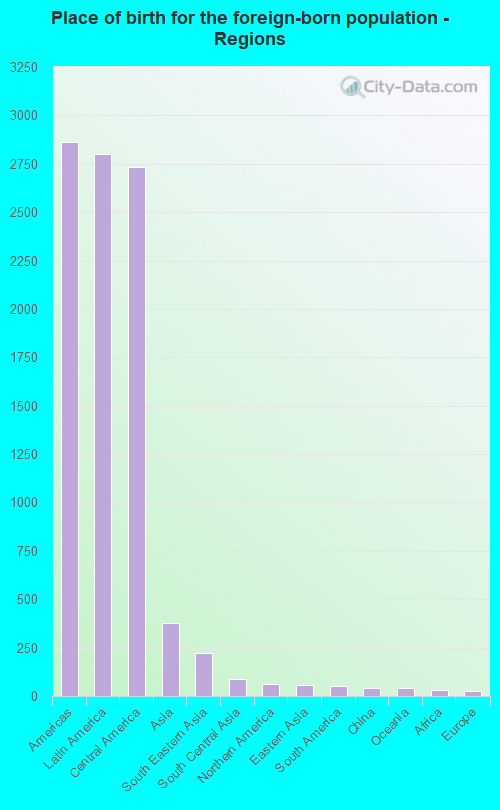
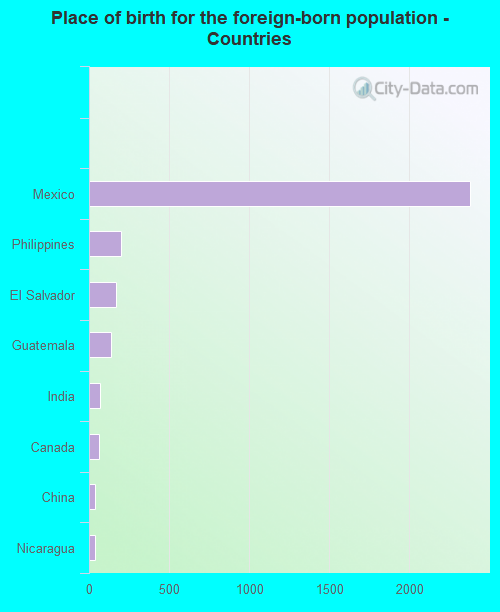
Foreign-born residents in Blythe 3,346 residents are foreign born (14.1% Latin America , 1.9% Asia ).
This city:
16.6%California:
100.0%
Marital status for residents in Blythe Marital status - White (Caucasian) population 15 years and over
Males 50.6% Never married29.3% Now married3.4% Separated1.3% Widowed15.3% DivorcedFemales 17.6% Never married51.2% Now married1.8% Separated12.7% Widowed16.6% DivorcedWomen who gave birth in the past 12 months Now married:
62.4% (77)Unmarried:
37.6% (47)
Women who did not give birth in the past 12 months Now married:
53.2% (473)Unmarried:
46.8% (416)
Marital status - Black or African American population 15 years and over
Males 58.0% Never married23.9% Now married5.2% Separated2.6% Widowed10.3% DivorcedFemales 35.9% Never married37.4% Now married6.8% Separated10.6% Widowed9.4% DivorcedWomen who gave birth in the past 12 months Now married:
100.0% (11)Unmarried:
0.0% (0)
Women who did not give birth in the past 12 months Now married:
13.9% (14)Unmarried:
86.1% (87)
Marital status - American Indian / Alaska Native population 15 years and over
Males 46.2% Never married28.6% Now married10.9% Separated0.0% Widowed14.3% DivorcedFemales 15.6% Never married25.0% Now married0.0% Separated0.0% Widowed59.4% DivorcedWomen who did not give birth in the past 12 months Now married:
0.0% (0)Unmarried:
100.0% (7)
Marital status - Asian population 15 years and over
Males 58.8% Never married25.2% Now married4.3% Separated4.0% Widowed7.6% DivorcedFemales 28.0% Never married51.8% Now married4.2% Separated16.1% Widowed0.0% DivorcedWomen who did not give birth in the past 12 months Now married:
59.1% (74)Unmarried:
40.9% (51)
Marital status - Native Hawaiian / Pacific Islander population 15 years and over
Males 79.6% Never married0.0% Now married8.2% Separated12.2% Widowed0.0% DivorcedFemales 0.0% Never married0.0% Now married0.0% Separated0.0% Widowed100.0% DivorcedMarital status - Other race population 15 years and over
Males 47.2% Never married38.6% Now married3.6% Separated1.8% Widowed8.8% DivorcedFemales 32.2% Never married48.9% Now married5.9% Separated6.5% Widowed6.5% DivorcedWomen who gave birth in the past 12 months Now married:
46.6% (31)Unmarried:
53.4% (35)
Women who did not give birth in the past 12 months Now married:
53.0% (618)Unmarried:
47.0% (549)
Marital status - Two or more races population 15 years and over
Males 58.6% Never married19.4% Now married1.9% Separated7.8% Widowed12.3% DivorcedFemales 77.0% Never married13.9% Now married0.0% Separated0.0% Widowed9.0% DivorcedWomen who gave birth in the past 12 months Now married:
0.0% (0)Unmarried:
100.0% (88)
Women who did not give birth in the past 12 months Now married:
10.1% (97)Unmarried:
89.9% (870)
Marital status - White alone, not Hispanic / Latino population 15 years and over
Males 37.5% Never married40.1% Now married3.3% Separated1.0% Widowed18.1% DivorcedFemales 13.8% Never married54.7% Now married1.6% Separated12.6% Widowed17.2% DivorcedWomen who gave birth in the past 12 months Now married:
73.8% (67)Unmarried:
26.2% (24)
Women who did not give birth in the past 12 months Now married:
56.9% (385)Unmarried:
43.1% (292)
Marital status - Hispanic or Latino population 15 years and over
Males 56.9% Never married26.6% Now married3.6% Separated1.6% Widowed11.3% DivorcedFemales 37.4% Never married42.4% Now married4.3% Separated7.3% Widowed8.6% DivorcedWomen who gave birth in the past 12 months Now married:
36.3% (52)Unmarried:
63.7% (91)
Women who did not give birth in the past 12 months Now married:
44.2% (762)Unmarried:
55.8% (961)
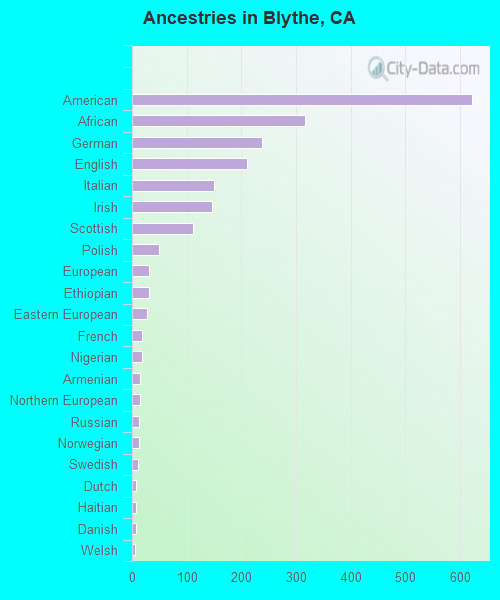
Ancestries in Blythe
350 2.6% American293 2.2% African253 1.9% Irish228 1.7% English163 1.2% German58 0.4% Scottish51 0.4% Italian40 0.3% European36 0.3% Nigerian29 0.2% French28 0.2% Dutch28 0.2% Norwegian28 0.2% Polish24 0.2% Ethiopian21 0.2% Swedish19 0.1% Welsh16 0.1% Canadian15 0.1% Czechoslovakian13 0.10% Armenian12 0.09% Greek12 0.09% Belgian10 0.08% Haitian8 0.06% Brazilian8 0.06% French Canadian7 0.05% Afghan7 0.05% Basque7 0.05% Portuguese6 0.05% Albanian6 0.05% Icelander5 0.04% British4 0.03% Scotch-Irish4 0.03% Ukrainian4 0.03% Finnish4 0.03% Jamaican3 0.02% Northern European3 0.02% Scandinavian
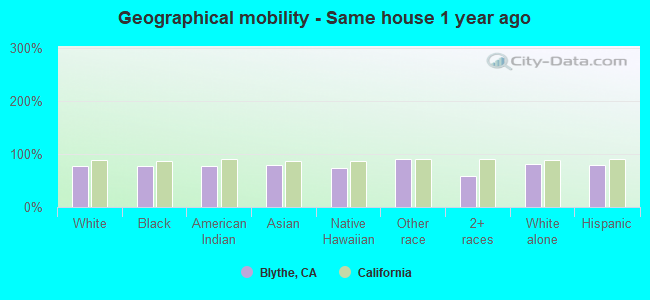
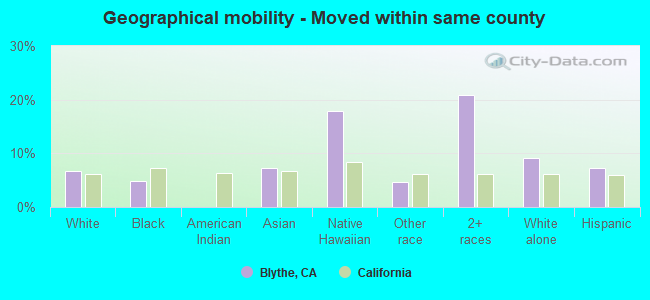
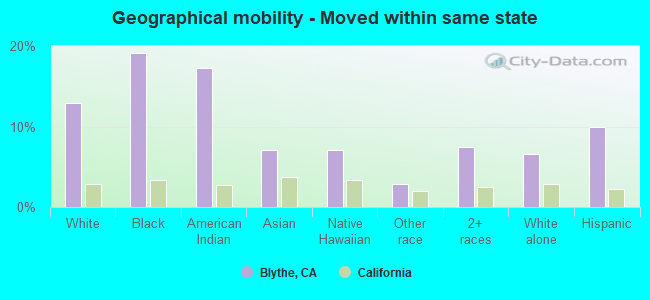
Geographical mobility in Blythe Same house 1 year ago 6,389 77.7% White (Caucasian)1,706 76.5% Black or African American170 77.7% American Indian / Alaska Native429 78.4% Asian46 73.7% Native Hawaiian / Pacific Islander5,365 90.8% Other race2,317 59.2% Two or more races3,890 81.5% White alone, not Hispanic / Latino8,954 79.6% Hispanic or LatinoMoved within same county 554 6.7% White / Caucasian107 4.8% Black or African American40 7.3% Asian11 18.0% Native Hawaiian / Pacific Islander279 4.7% Other race819 20.9% Two or more races432 9.1% White alone, not Hispanic / Latino828 7.4% Hispanic or LatinoMoved within same state 1,064 12.9% White / Caucasian427 19.2% Black or African American38 17.3% American Indian / Alaska Native39 7.1% Asian4 7.0% Native Hawaiian / Pacific Islander169 2.9% Other race290 7.4% Two or more races315 6.6% White alone, not Hispanic / Latino1,123 10.0% Hispanic or LatinoMoved from different state 235 2.9% White / Caucasian31 1.4% Black or African American7 3.1% American Indian / Alaska Native24 4.3% Asian44 0.7% Other race36 0.9% Two or more races115 2.4% White alone, not Hispanic / Latino219 1.9% Hispanic or LatinoMoved from abroad 15 0.2% White7 0.3% Black or African American12 2.2% Asian65 1.1% Other race27 0.7% Two or more races8 0.2% White alone, not Hispanic / Latino68 0.6% Hispanic or Latino
Children Nativity (place of birth) in Blythe
Children under 6 years - Living with two parents Both parents native 395 100.0% NativeBoth parents foreign-born 95 100.0% NativeOne native, one foreign-born parent 56 100.0% NativeChildren under 6 years - Living with one parent Native parent 647 100.0% NativeForeign-born parent 131 100.0% NativeChildren 6 to 17 years - Living with two parents Both parents native 548 100.0% NativeBoth parents foreign-born 122 100.0% NativeOne native, one foreign-born parent 217 93.3% Native15 6.7% Foreign-bornChildren 6 to 17 years - Living with one parent Native parent 1,456 100.0% NativeForeign-born parent 40 54.5% Native33 45.5% Foreign-born
Grandparents responsible for own grandchildren in Blythe
Grandparents (30 to 59 years) White / Caucasian 30 37.2% Responsible for grandchildren51 62.8% Not responsible for grandchildrenBlack or African American 26 100.0% Responsible for grandchildrenNative Hawaiian / Pacific Islander 14 100.0% Not responsible for grandchildrenOther race 28 100.0% Responsible for grandchildrenWhite alone, not Hispanic / Latino 25 35.8% Responsible for grandchildren45 64.2% Not responsible for grandchildrenHispanic or Latino 32 69.5% Responsible for grandchildren14 30.5% Not responsible for grandchildrenGrandparents (60 years and over) White / Caucasian 26 74.2% Responsible for grandchildren9 25.8% Not responsible for grandchildrenBlack or African American 15 100.0% Responsible for grandchildrenOther race 13 28.8% Responsible for grandchildren33 71.2% Not responsible for grandchildrenWhite alone, not Hispanic / Latino 18 94.3% Responsible for grandchildren1 5.7% Not responsible for grandchildrenHispanic or Latino 28 40.9% Responsible for grandchildren40 59.1% Not responsible for grandchildren