Races in Boca Del Mar, Florida (FL) Detailed Stats
Ancestries, Foreign-born residents, place of birth

Recent posts about races in Boca Del Mar, Florida on our local forum with over 2,400,000 registered users:
 | Boca Raton area- Is is possible to find a house w/o mandatory equity purchase? (23 replies) |
| 1 bedroom apts - dog friendly $1100? Boca/Delray (8 replies) |
| Finding the right development in Boca (21 replies) |
| Boca Raton - maybe I'll buy a house there and move (4 replies) |
| "He wants to live in Boca Raton, of all places." (15 replies) |
| experienced a hurricane? (18 replies) |
16.1% of Boca Del Mar, FL residents are foreign-born (6.7% born in Latin America, 5.5% born in Europe, 2.1% born in Asia), which is 30.7% less than the foreign-born rate of 21.0% across the entire state of Florida.
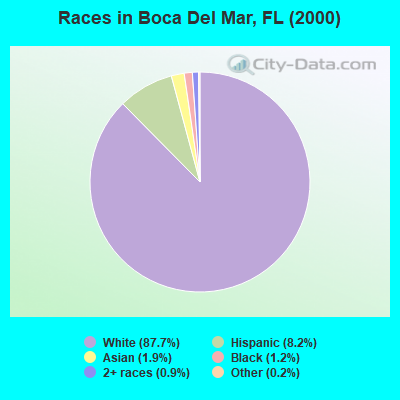
Race distribution in Boca Del Mar

- 19,13687.7%White alone
- 1,7828.2%Hispanic
- 4091.9%Asian alone
- 2561.2%Black alone
- 1920.9%Two or more races
- 420.2%Other race alone
- 120.05%American Indian alone
- 30.01%Native Hawaiian and Other
Pacific Islander alone
2000
2022
-
- 10,458,50965.4%White alone
- 2,682,71516.8%Hispanic
- 2,264,26814.2%Black alone
- 261,6931.6%Asian alone
- 236,9541.5%Two or more races
- 42,3580.3%American Indian alone
- 28,9940.2%Other race alone
- 6,8870.04%Native Hawaiian and Other
Pacific Islander alone

-
- 11,309,40350.8%White alone
- 6,025,03927.1%Hispanic
- 3,241,01514.6%Black alone
- 861,6303.9%Two or more races
- 623,6922.8%Asian alone
- 152,0540.7%Other race alone
- 22,5040.1%American Indian alone
- 9,4860.04%Native Hawaiian and Other
Pacific Islander alone

Income and house value in Boca Del Mar
- Median household income in 2022
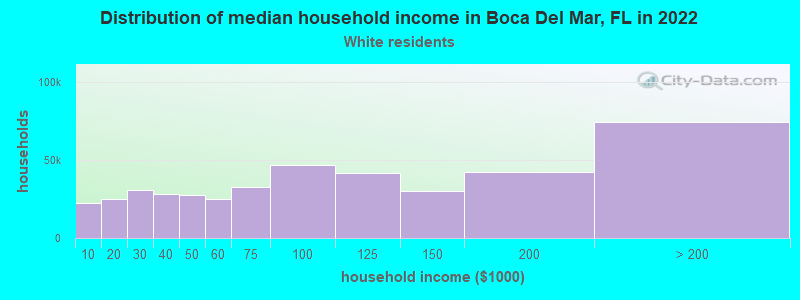
- $92,501White non-Hispanic householders
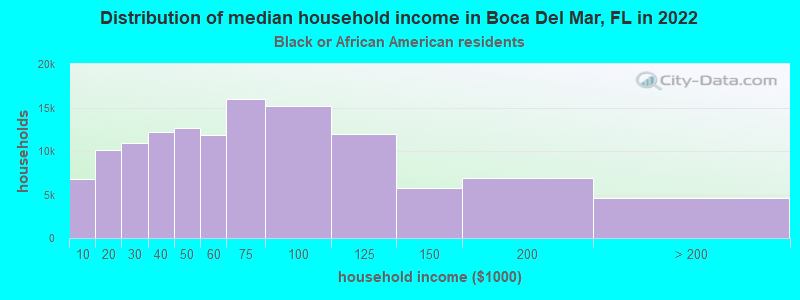
- $83,560Black householders
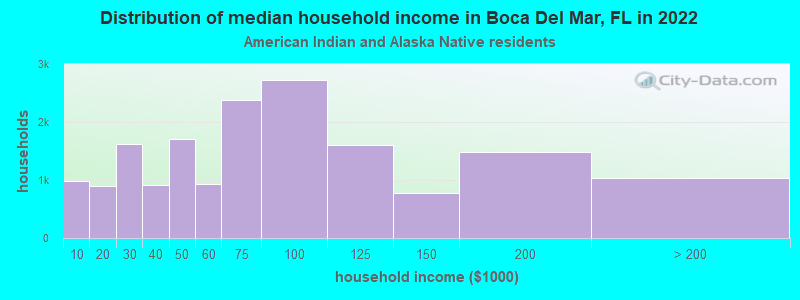
- $44,393American Indian and Alaska Native householders
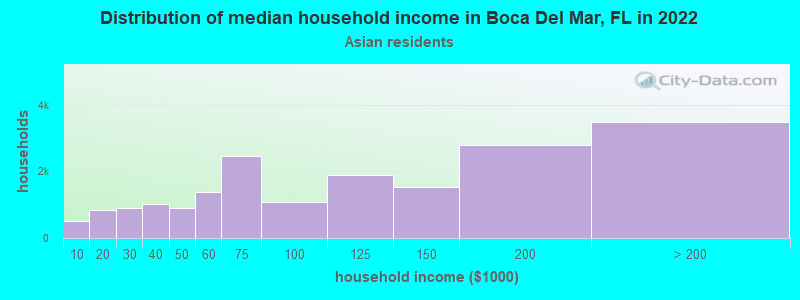
- $137,591Asian householders
- $90,258Some other race householders
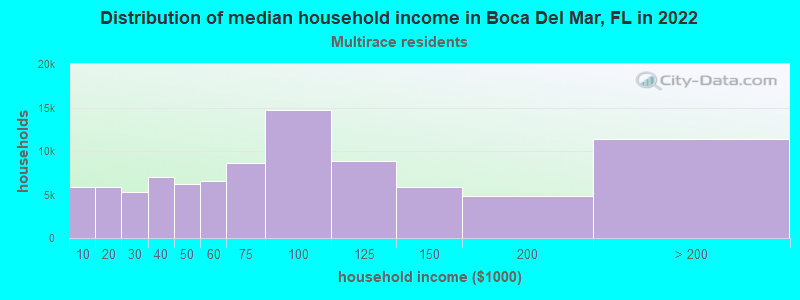
- $84,996Two or more races householders
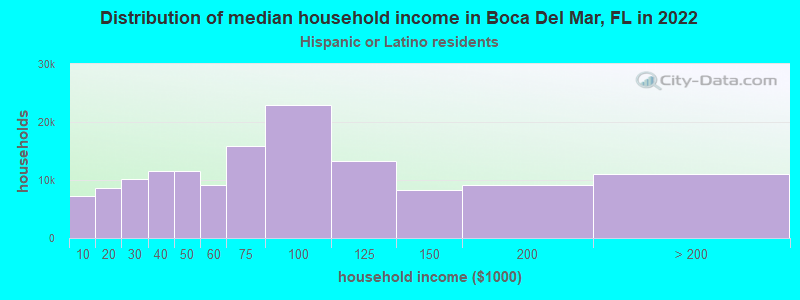
- $80,520Hispanic or Latino race householders
- Median 2022 house value
- $676,676White Non-Hispanic householders
- $650,312Black or African American householders
- $362,982American Indian or Alaska Native householders
- $520,784Asian householders
- $378,266Two or more races householders
- $560,521Hispanic or Latino householders
Household income for White non-Hispanic householders
Household income for Black householders
Household income for American Indian and Alaska Native householders
Household income for Asian householders
Household income for Two or more races householders
Household income for Hispanic or Latino race householders
Foreign-born residents in Boca Del Mar
3,508 residents are foreign born (6.7% Latin America, 5.5% Europe, 2.1% Asia).
| This city: | 16.1% |
| Florida: | 16.7% |
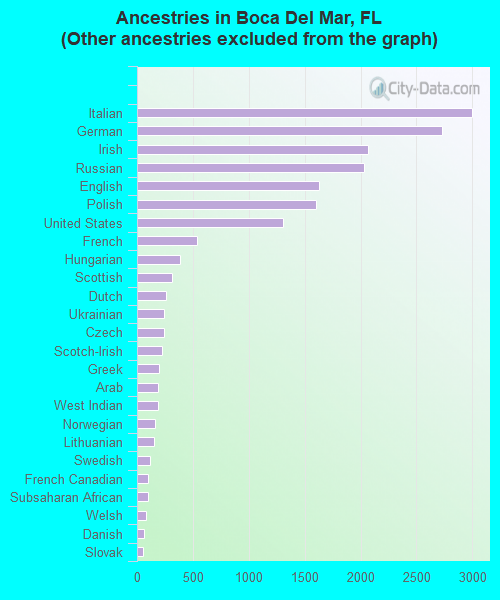
Ancestries in Boca Del Mar

- 5,73824.1%Other
- 2,99912.6%Italian
- 2,73011.5%German
- 2,0638.7%Irish
- 2,0278.5%Russian
- 1,6256.8%English
- 1,6046.7%Polish
- 1,3065.5%United States
- 5372.3%French
- 3821.6%Hungarian
- 3161.3%Scottish
- 2621.1%Dutch
- 2441.0%Ukrainian
- 2411.0%Czech
- 2240.9%Scotch-Irish
- 1950.8%Greek
- 1900.8%Arab
- 1840.8%West Indian
- 1570.7%Norwegian
- 1550.7%Lithuanian
- 1170.5%Swedish
- 1020.4%French Canadian
- 980.4%Subsaharan African
- 830.3%Welsh
- 640.3%Danish
- 520.2%Slovak
- 430.2%Portuguese
- 290.1%Swiss
Zip codes: 33433.