Races in Bonita Springs, Florida (FL) Detailed Stats
Data:
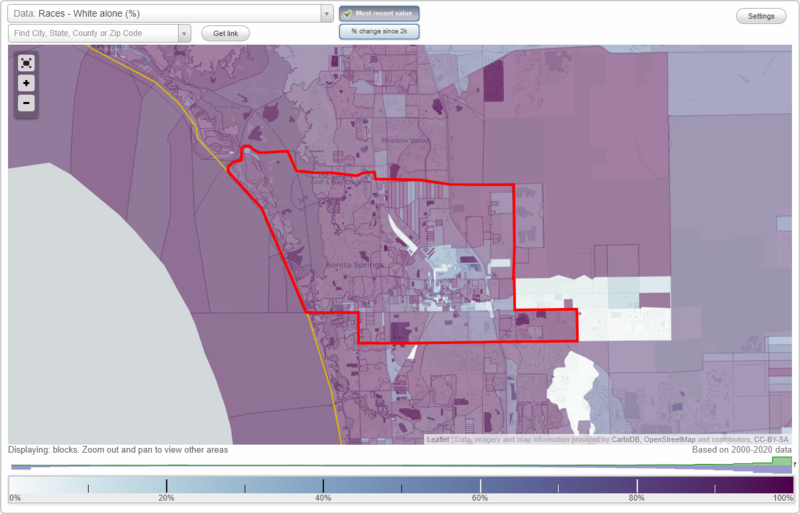
Races - White alone (%)
Races - White alone (% change since 2000)
Races - Black alone (%)
Races - Black alone (% change since 2000)
Races - American Indian alone (%)
Races - American Indian alone (% change since 2000)
Races - Asian alone (%)
Races - Asian alone (% change since 2000)
Races - Hispanic (%)
Races - Hispanic (% change since 2000)
Races - Native Hawaiian and Other Pacific Islander alone (%)
Races - Native Hawaiian and Other Pacific Islander alone (% change since 2000)
Races - Two or more races(%)
Races - Two or more races(% change since 2000)
Races - Other race alone (%)
Races - Other race alone (% change since 2000)
Racial diversity
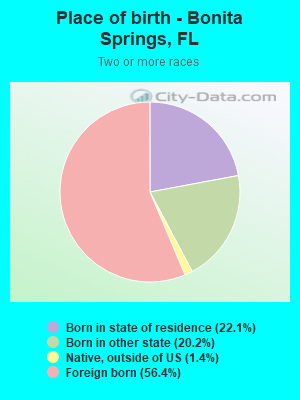
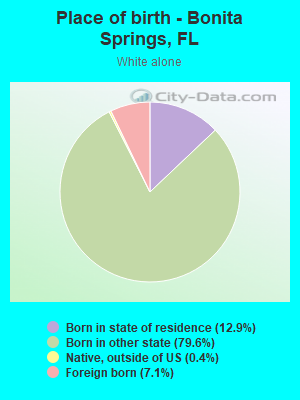
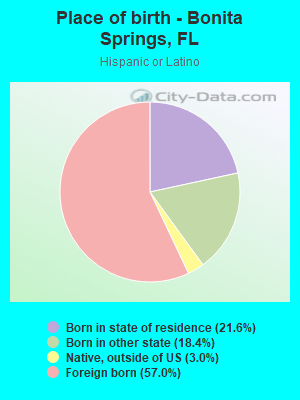
Place of birth - Born in state of residence (%)
Place of birth - Born in state of residence (%) - White
Place of birth - Born in state of residence (%) - Black or African American
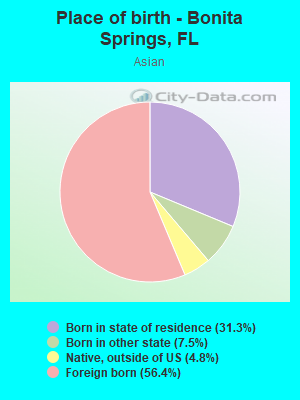
Place of birth - Born in state of residence (%) - Asian
Place of birth - Born in state of residence (%) - Hispanic or Latino
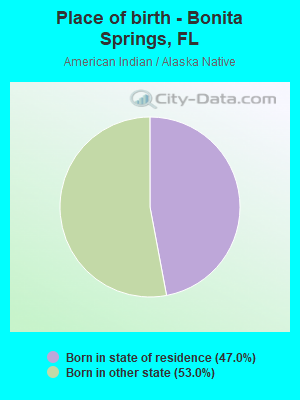
Place of birth - Born in state of residence (%) - American Indian and Alaska Native
Place of birth - Born in state of residence (%) - Multirace
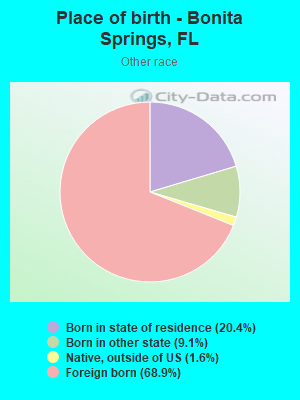
Place of birth - Born in state of residence (%) - Other Race
Place of birth - Born in other state (%)
Place of birth - Born in other state (%) - White
Place of birth - Born in other state (%) - Black or African American
Place of birth - Born in other state (%) - Asian
Place of birth - Born in other state (%) - Hispanic or Latino
Place of birth - Born in other state (%) - American Indian and Alaska Native
Place of birth - Born in other state (%) - Multirace
Place of birth - Born in other state (%) - Other Race
Place of birth - Native, outside of US (%)
Place of birth - Native, outside of US (%) - White
Place of birth - Native, outside of US (%) - Black or African American
Place of birth - Native, outside of US (%) - Asian
Place of birth - Native, outside of US (%) - Hispanic or Latino
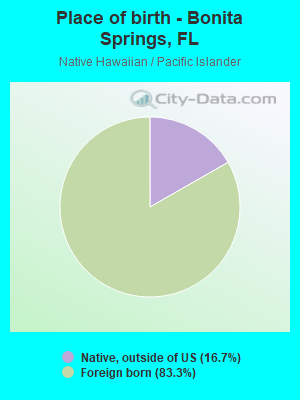
Place of birth - Native, outside of US (%) - American Indian and Alaska Native
Place of birth - Native, outside of US (%) - Multirace
Place of birth - Native, outside of US (%) - Other Race
Place of birth - Foreign born (%)
Place of birth - Foreign born (%) - White
Place of birth - Foreign born (%) - Black or African American
Place of birth - Foreign born (%) - Asian
Place of birth - Foreign born (%) - Hispanic or Latino
Place of birth - Foreign born (%) - American Indian and Alaska Native
Place of birth - Foreign born (%) - Multirace
Place of birth - Foreign born (%) - Other Race
Residents speaking English at home (%)
Residents speaking English at home - Born in the United States (%)
Residents speaking English at home - Native, born elsewhere (%)
Residents speaking English at home - Foreign born (%)
Residents speaking Spanish at home (%)
Residents speaking Spanish at home - Born in the United States (%)
Residents speaking Spanish at home - Native, born elsewhere (%)
Residents speaking Spanish at home - Foreign born (%)
Residents speaking other language at home (%)
Residents speaking other language at home - Born in the United States (%)
Residents speaking other language at home - Native, born elsewhere (%)
Residents speaking other language at home - Foreign born (%)
Marital status - Never married (%)
Marital status - Now married (%)
Marital status - Separated (%)
Marital status - Widowed (%)
Marital status - Divorced (%)
Ancestries Reported - Arab (%)
Ancestries Reported - Czech (%)
Ancestries Reported - Danish (%)
Ancestries Reported - Dutch (%)
Ancestries Reported - English (%)
Ancestries Reported - French (%)
Ancestries Reported - French Canadian (%)
Ancestries Reported - German (%)
Ancestries Reported - Greek (%)
Ancestries Reported - Hungarian (%)
Ancestries Reported - Irish (%)
Ancestries Reported - Italian (%)
Ancestries Reported - Lithuanian (%)
Ancestries Reported - Norwegian (%)
Ancestries Reported - Polish (%)
Ancestries Reported - Portuguese (%)
Ancestries Reported - Russian (%)
Ancestries Reported - Scotch-Irish (%)
Ancestries Reported - Scottish (%)
Ancestries Reported - Slovak (%)
Ancestries Reported - Subsaharan African (%)
Ancestries Reported - Swedish (%)
Ancestries Reported - Swiss (%)
Ancestries Reported - Ukrainian (%)
Ancestries Reported - United States (%)
Ancestries Reported - Welsh (%)
Ancestries Reported - West Indian (%)
Ancestries Reported - Other (%)
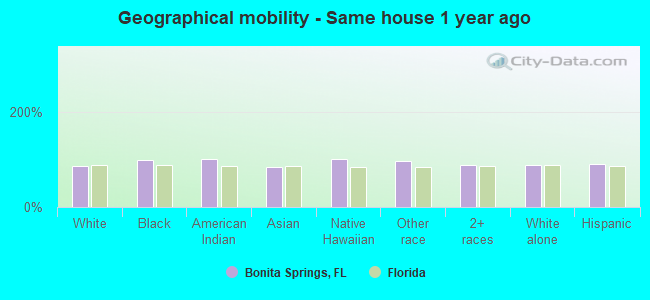
Geographical mobility - Same house 1 year ago (%)
Geographical mobility - Same house 1 year ago (%) - White
Geographical mobility - Same house 1 year ago (%) - Black or African American
Geographical mobility - Same house 1 year ago (%) - Asian
Geographical mobility - Same house 1 year ago (%) - Hispanic or Latino
Geographical mobility - Same house 1 year ago (%) - American Indian and Alaska Native
Geographical mobility - Same house 1 year ago (%) - Multirace
Geographical mobility - Same house 1 year ago (%) - Other Race
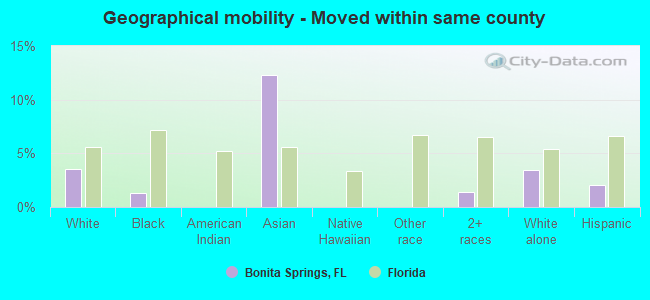
Geographical mobility - Moved within same county (%)
Geographical mobility - Moved within same county (%) - White
Geographical mobility - Moved within same county (%) - Black or African American
Geographical mobility - Moved within same county (%) - Asian
Geographical mobility - Moved within same county (%) - Hispanic or Latino
Geographical mobility - Moved within same county (%) - American Indian and Alaska Native
Geographical mobility - Moved within same county (%) - Multirace
Geographical mobility - Moved within same county (%) - Other Race
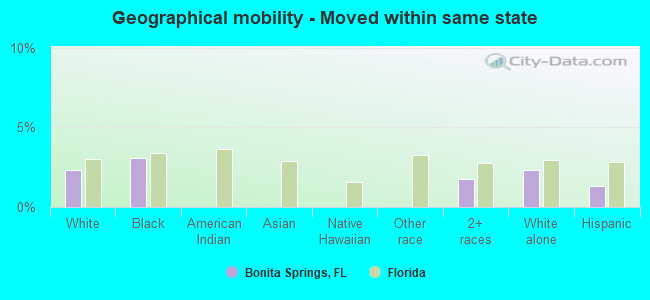
Geographical mobility - Moved from different county within same state (%)
Geographical mobility - Moved from different county within same state (%) - White
Geographical mobility - Moved from different county within same state (%) - Black or African American
Geographical mobility - Moved from different county within same state (%) - Asian
Geographical mobility - Moved from different county within same state (%) - Hispanic or Latino
Geographical mobility - Moved from different county within same state (%) - American Indian and Alaska Native
Geographical mobility - Moved from different county within same state (%) - Multirace
Geographical mobility - Moved from different county within same state (%) - Other Race
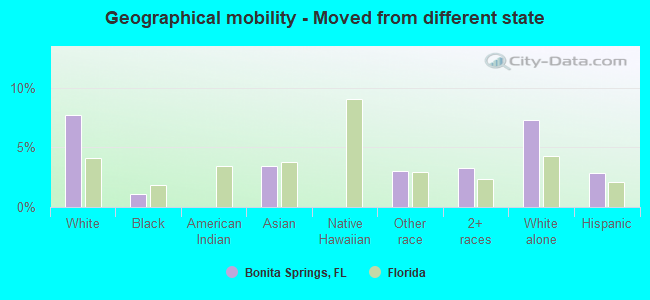
Geographical mobility - Moved from different state (%)
Geographical mobility - Moved from different state (%) - White
Geographical mobility - Moved from different state (%) - Black or African American
Geographical mobility - Moved from different state (%) - Asian
Geographical mobility - Moved from different state (%) - Hispanic or Latino
Geographical mobility - Moved from different state (%) - American Indian and Alaska Native
Geographical mobility - Moved from different state (%) - Multirace
Geographical mobility - Moved from different state (%) - Other Race
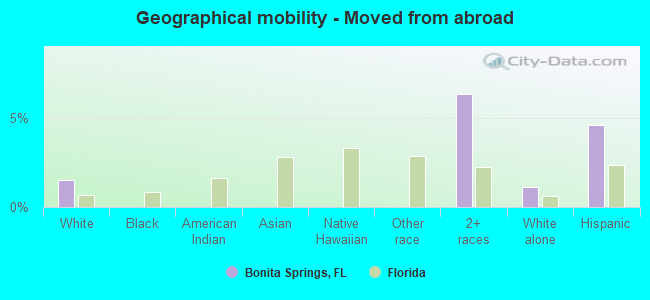
Geographical mobility - Moved from abroad (%)
Geographical mobility - Moved from abroad (%) - White
Geographical mobility - Moved from abroad (%) - Black or African American
Geographical mobility - Moved from abroad (%) - Asian
Geographical mobility - Moved from abroad (%) - Hispanic or Latino
Geographical mobility - Moved from abroad (%) - American Indian and Alaska Native
Geographical mobility - Moved from abroad (%) - Multirace
Geographical mobility - Moved from abroad (%) - Other Race
Place of birth for the foreign-born population - Ireland (%)
Place of birth for the foreign-born population - Denmark (%)
Place of birth for the foreign-born population - Norway (%)
Place of birth for the foreign-born population - Sweden (%)
Place of birth for the foreign-born population - United Kingdom (%)
Place of birth for the foreign-born population - England (%)
Place of birth for the foreign-born population - Scotland (%)
Place of birth for the foreign-born population - Other Northern Europe (%)
Place of birth for the foreign-born population - Austria (%)
Place of birth for the foreign-born population - Belgium (%)
Place of birth for the foreign-born population - France (%)
Place of birth for the foreign-born population - Germany (%)
Place of birth for the foreign-born population - Netherlands (%)
Place of birth for the foreign-born population - Switzerland (%)
Place of birth for the foreign-born population - Other Western Europe (%)
Place of birth for the foreign-born population - Greece (%)
Place of birth for the foreign-born population - Italy (%)
Place of birth for the foreign-born population - Portugal (%)
Place of birth for the foreign-born population - Spain (%)
Place of birth for the foreign-born population - Other Southern Europe (%)
Place of birth for the foreign-born population - Albania (%)
Place of birth for the foreign-born population - Belarus (%)
Place of birth for the foreign-born population - Bosnia and Herzegovina (%)
Place of birth for the foreign-born population - Bulgaria (%)
Place of birth for the foreign-born population - Croatia (%)
Place of birth for the foreign-born population - Czechoslovakia (%)
Place of birth for the foreign-born population - Hungary (%)
Place of birth for the foreign-born population - Latvia (%)
Place of birth for the foreign-born population - Lithuania (%)
Place of birth for the foreign-born population - North Macedonia (Macedonia) (%)
Place of birth for the foreign-born population - Moldova (%)
Place of birth for the foreign-born population - Poland (%)
Place of birth for the foreign-born population - Romania (%)
Place of birth for the foreign-born population - Russia (%)
Place of birth for the foreign-born population - Serbia (%)
Place of birth for the foreign-born population - Ukraine (%)
Place of birth for the foreign-born population - Other Eastern Europe (%)
Place of birth for the foreign-born population - China (%)
Place of birth for the foreign-born population - Hong Kong (%)
Place of birth for the foreign-born population - Taiwan (%)
Place of birth for the foreign-born population - Japan (%)
Place of birth for the foreign-born population - Korea (%)
Place of birth for the foreign-born population - Other Eastern Asia (%)
Place of birth for the foreign-born population - Afghanistan (%)
Place of birth for the foreign-born population - Bangladesh (%)
Place of birth for the foreign-born population - India (%)
Place of birth for the foreign-born population - Iran (%)
Place of birth for the foreign-born population - Kazakhstan (%)
Place of birth for the foreign-born population - Nepal (%)
Place of birth for the foreign-born population - Pakistan (%)
Place of birth for the foreign-born population - Sri Lanka (%)
Place of birth for the foreign-born population - Uzbekistan (%)
Place of birth for the foreign-born population - Other South Central Asia (%)
Place of birth for the foreign-born population - Burma (%)
Place of birth for the foreign-born population - Cambodia (%)
Place of birth for the foreign-born population - Indonesia (%)
Place of birth for the foreign-born population - Laos (%)
Place of birth for the foreign-born population - Malaysia (%)
Place of birth for the foreign-born population - Philippines (%)
Place of birth for the foreign-born population - Singapore (%)
Place of birth for the foreign-born population - Thailand (%)
Place of birth for the foreign-born population - Vietnam (%)
Place of birth for the foreign-born population - Other South Eastern Asia (%)
Place of birth for the foreign-born population - Armenia (%)
Place of birth for the foreign-born population - Iraq (%)
Place of birth for the foreign-born population - Israel (%)
Place of birth for the foreign-born population - Jordan (%)
Place of birth for the foreign-born population - Kuwait (%)
Place of birth for the foreign-born population - Lebanon (%)
Place of birth for the foreign-born population - Saudi Arabia (%)
Place of birth for the foreign-born population - Syria (%)
Place of birth for the foreign-born population - Turkey (%)
Place of birth for the foreign-born population - Yemen (%)
Place of birth for the foreign-born population - Other Western Asia (%)
Place of birth for the foreign-born population - Eritrea (%)
Place of birth for the foreign-born population - Ethiopia (%)
Place of birth for the foreign-born population - Kenya (%)
Place of birth for the foreign-born population - Somalia (%)
Place of birth for the foreign-born population - Uganda (%)
Place of birth for the foreign-born population - Zimbabwe (%)
Place of birth for the foreign-born population - Other Eastern Africa (%)
Place of birth for the foreign-born population - Cameroon (%)
Place of birth for the foreign-born population - Congo (%)
Place of birth for the foreign-born population - Democratic Republic of Congo (Zaire) (%)
Place of birth for the foreign-born population - Other Middle Africa (%)
Place of birth for the foreign-born population - Egypt (%)
Place of birth for the foreign-born population - Morocco (%)
Place of birth for the foreign-born population - Sudan (%)
Place of birth for the foreign-born population - Other Northern Africa (%)
Place of birth for the foreign-born population - South Africa (%)
Place of birth for the foreign-born population - Other Southern Africa (%)
Place of birth for the foreign-born population - Cabo Verde (%)
Place of birth for the foreign-born population - Ghana (%)
Place of birth for the foreign-born population - Liberia (%)
Place of birth for the foreign-born population - Nigeria (%)
Place of birth for the foreign-born population - Senegal (%)
Place of birth for the foreign-born population - Sierra Leone (%)
Place of birth for the foreign-born population - Other Western Africa (%)
Place of birth for the foreign-born population - Australia (%)
Place of birth for the foreign-born population - New Zealand (%)
Place of birth for the foreign-born population - Fiji (%)
Place of birth for the foreign-born population - Micronesia (%)
Place of birth for the foreign-born population - Bahamas (%)
Place of birth for the foreign-born population - Barbados (%)
Place of birth for the foreign-born population - Cuba (%)
Place of birth for the foreign-born population - Dominica (%)
Place of birth for the foreign-born population - Dominican Republic (%)
Place of birth for the foreign-born population - Grenada (%)
Place of birth for the foreign-born population - Haiti (%)
Place of birth for the foreign-born population - Jamaica (%)
Place of birth for the foreign-born population - St. Vincent and the Grenadines (%)
Place of birth for the foreign-born population - Trinidad and Tobago (%)
Place of birth for the foreign-born population - West Indies (%)
Place of birth for the foreign-born population - Other Caribbean (%)
Place of birth for the foreign-born population - Belize (%)
Place of birth for the foreign-born population - Costa Rica (%)
Place of birth for the foreign-born population - El Salvador (%)
Place of birth for the foreign-born population - Guatemala (%)
Place of birth for the foreign-born population - Honduras (%)
Place of birth for the foreign-born population - Mexico (%)
Place of birth for the foreign-born population - Nicaragua (%)
Place of birth for the foreign-born population - Panama (%)
Place of birth for the foreign-born population - Other Central America (%)
Place of birth for the foreign-born population - Argentina (%)
Place of birth for the foreign-born population - Bolivia (%)
Place of birth for the foreign-born population - Brazil (%)
Place of birth for the foreign-born population - Chile (%)
Place of birth for the foreign-born population - Colombia (%)
Place of birth for the foreign-born population - Ecuador (%)
Place of birth for the foreign-born population - Guyana (%)
Place of birth for the foreign-born population - Peru (%)
Place of birth for the foreign-born population - Uruguay (%)
Place of birth for the foreign-born population - Venezuela (%)
Place of birth for the foreign-born population - Other South America (%)
Place of birth for the foreign-born population - Canada (%)
Place of birth for the foreign-born population - Other Northern America (%)
Place of birth for the foreign-born population - Other (%)
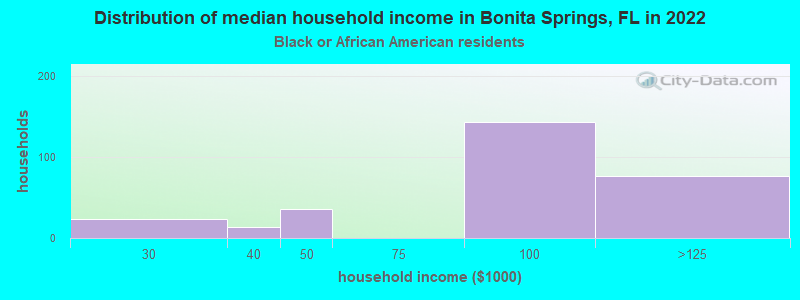
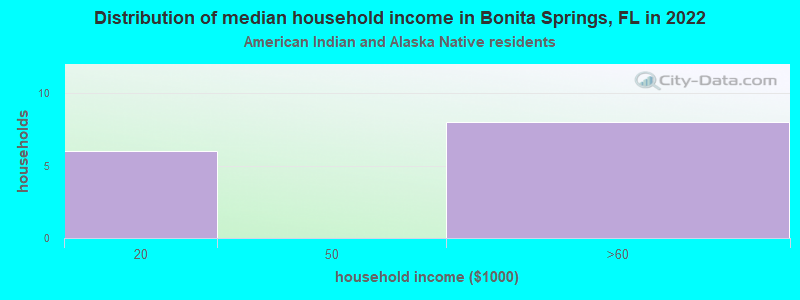
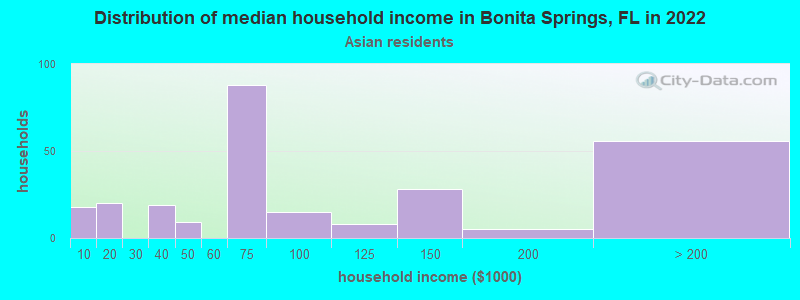
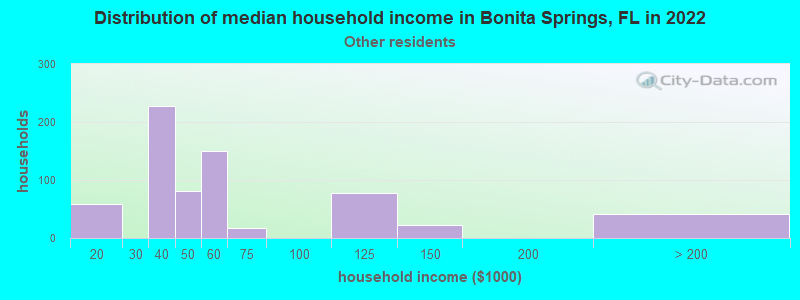
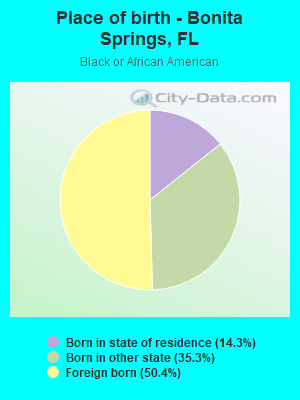
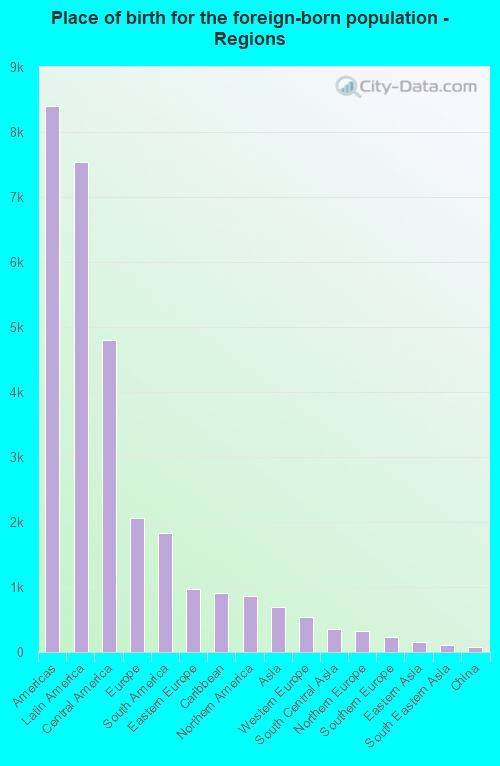
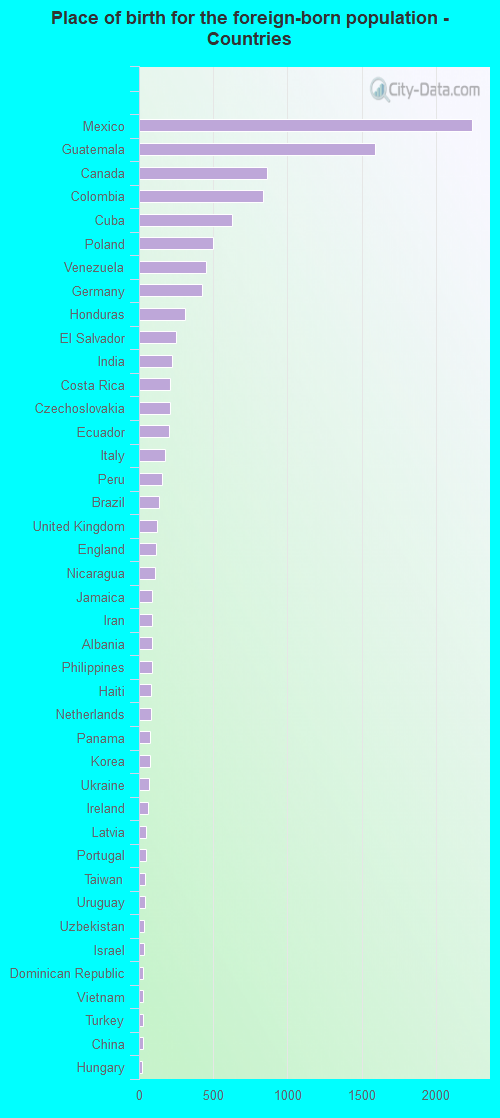
According to 2022 data, the most numerous races in Bonita Springs, FL are White alone (40,961 residents), Hispanic (13,417 residents), and Black alone (770 residents). 75.3% of Bonita Springs residents speak English at home. 19.4% of Bonita Springs, FL residents are foreign-born (13.3% born in Latin America, 3.6% born in Europe), which is 8.1% less than the foreign-born rate of 21.0% across the entire state of Florida.
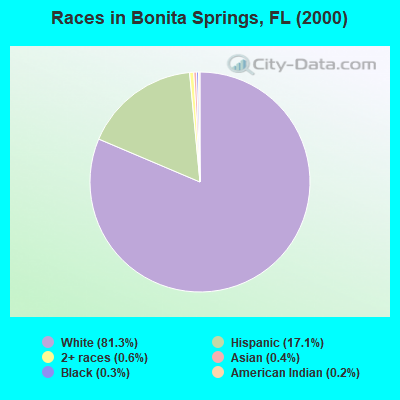
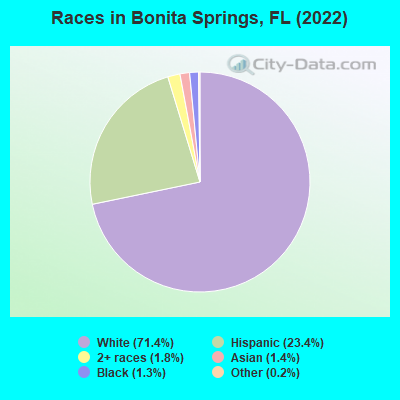
Race distribution in Bonita Springs
2000 2022
10,458,509 65.4% White alone 2,682,715 16.8% Hispanic 2,264,268 14.2% Black alone 261,693 1.6% Asian alone 236,954 1.5% Two or more races 42,358 0.3% American Indian alone 28,994 0.2% Other race alone 6,887 0.04% Native Hawaiian and Other
11,309,403 50.8% White alone 6,025,039 27.1% Hispanic 3,241,015 14.6% Black alone 861,630 3.9% Two or more races 623,692 2.8% Asian alone 152,054 0.7% Other race alone 22,504 0.1% American Indian alone 9,486 0.04% Native Hawaiian and Other
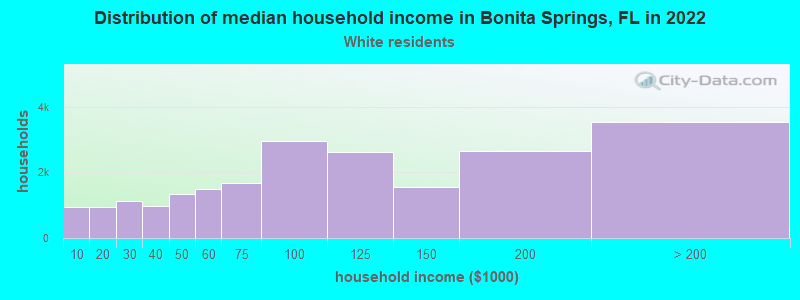
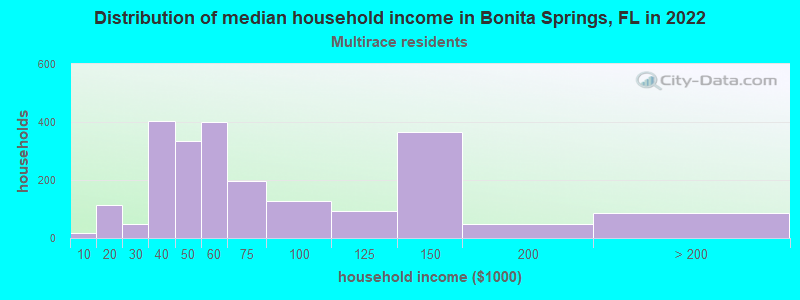
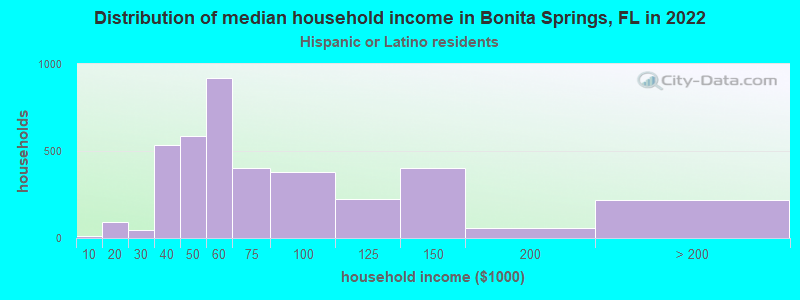
Income and house value in Bonita Springs Median household income in 2022 $93,739 White non-Hispanic householders$94,273 Black householders$87,575 Asian householders$49,909 Some other race householders$52,466 Two or more races householders$56,325 Hispanic or Latino race householdersMedian 2022 house value $701,670 White Non-Hispanic householders$377,029 American Indian or Alaska Native householders $392,110 Asian householders$257,967 Native Hawaiian and other Pacific Islander householders$330,991 Some other race householders$313,529 Two or more races householders$318,291 Hispanic or Latino householders
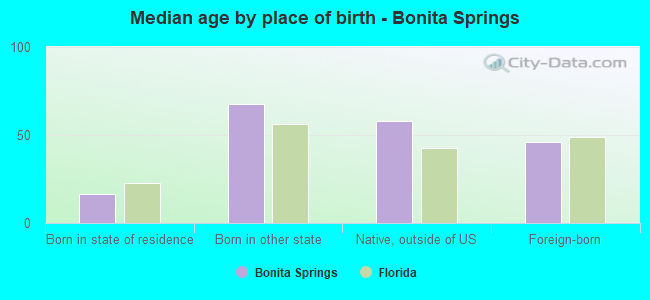
Median age by race in Bonita Springs
67.4 Median age for White residents68.3 66.6 53.1 Median age for Black or African American residents52.2 54.4 59.2 Median age for American Indian / Alaska Native residents-558,080,807.5 -402,449,693.4 40.4 Median age for Asian residents36.2 44.3 42.3 Median age for Native Hawaiian / Pacific Islander residents-858,307,848.3 30.5 41.4 Median age for Other race residents37.2 42.5 33.7 Median age for Two or more races residents37.7 33.2 67.9 Median age for White alone residents68.8 67.6 35.8 Median age for Hispanic or Latino residents33.2 38.4
Owner/renter occupied households by race in Bonita Springs
House owners and renters - White residents 18,193 84.0% Owner occupied3,454 16.0% Renter occupiedHouse owners and renters - Black or African American residents 191 63.9% Owner occupied108 36.1% Renter occupiedHouse owners and renters - American Indian / Alaska Native residents 23 100.0% Owner occupiedHouse owners and renters - Asian residents 167 73.4% Owner occupied61 26.6% Renter occupiedHouse owners and renters - Native Hawaiian / Pacific Islander residents 13 100.0% Owner occupiedHouse owners and renters - Other race residents 354 41.9% Owner occupied491 58.1% Renter occupiedHouse owners and renters - Two or more races residents 1,502 61.6% Owner occupied938 38.4% Renter occupiedHouse owners and renters - White alone residents 17,858 84.3% Owner occupied3,318 15.7% Renter occupiedHouse owners and renters - Hispanic or Latino residents 2,181 55.7% Owner occupied1,734 44.3% Renter occupied
Language usage in Bonita Springs
English speakers - Total 75.3% of residents of Bonita Springs speak English at home.
19.1% of residents speak Spanish at home 5,090 47.8% Speak English very well5,568 52.2% Speak English less than very well5.6% of residents speak other language at home 2,048 65.6% Speak English very well1,076 34.4% Speak English less than very well
English speakers - Born in the United States 93.3% of residents of Bonita Springs speak English at home.
5.0% of residents speak Spanish at home 1,715 96.2% Speak English very well68 3.8% Speak English less than very well1.7% of residents speak other language at home 495 80.4% Speak English very well121 19.6% Speak English less than very well
English speakers - Native, born elsewhere 71.1% of residents of Bonita Springs speak English at home.
14.1% of residents speak Spanish at home 93 100.0% Speak English very well2.7% of residents speak other language at home 18 100.0% Speak English very well
English speakers - Foreign-born 18.9% of residents of Bonita Springs speak English at home.
61.2% of residents speak Spanish at home 2,166 29.4% Speak English very well5,213 70.6% Speak English less than very well19.2% of residents speak other language at home 1,398 60.5% Speak English very well913 39.5% Speak English less than very well
White (Caucasian) - Speak only English Native:
97.4% (37,234)Foreign-born:
42.4% (1,472)
White (Caucasian) - Speak another language Native:
3.4% (1,301)Foreign-born:
57.5% (1,998)
Black or African American - Speak only English Native:
92.3% (387)Foreign-born:
43.8% (201)
Black or African American - Speak another language Native:
6.7% (28)Foreign-born:
57.4% (264)
Asian - Speak only English Native:
91.1% (240)Foreign-born:
23.4% (111)
Asian - Speak another language Native:
15.3% (40)Foreign-born:
75.6% (358)
Other race - Speak only English Native:
17.9% (130)Foreign-born:
2.2% (40)
Other race - Speak another language Native:
86.5% (629)Foreign-born:
97.8% (1,753)
Two or more races - Speak only English Native:
51.5% (1,846)Foreign-born:
5.0% (219)
Two or more races - Speak another language Native:
45.5% (1,633)Foreign-born:
94.9% (4,133)
White alone - Speak only English Native:
97.7% (36,140)Foreign-born:
52.7% (1,532)
White alone - Speak another language Native:
2.3% (842)Foreign-born:
47.1% (1,369)
Hispanic or Latino - Speak only English Native:
44.2% (2,430)Foreign-born:
2.3% (177)
Hispanic or Latino - Speak another language Native:
53.8% (2,955)Foreign-born:
98.0% (7,386)
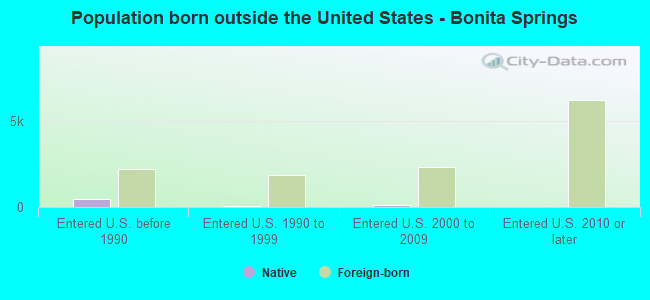
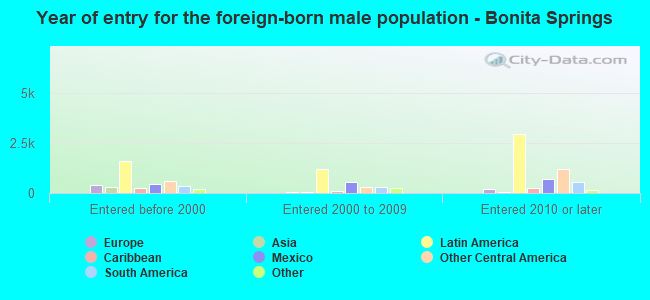
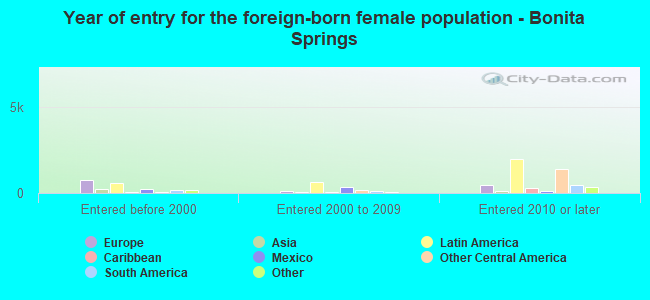
Foreign-born residents in Bonita Springs 11,156 residents are foreign born (13.3% Latin America , 3.6% Europe ).
This city:
19.4%Florida:
21.1%
Marital status for residents in Bonita Springs Marital status - White (Caucasian) population 15 years and over
Males 19.1% Never married65.9% Now married2.0% Separated3.8% Widowed9.1% DivorcedFemales 13.7% Never married60.8% Now married0.9% Separated13.8% Widowed10.7% DivorcedWomen who gave birth in the past 12 months Now married:
70.9% (154)Unmarried:
29.1% (63)
Women who did not give birth in the past 12 months Now married:
41.9% (1,711)Unmarried:
58.1% (2,376)
Marital status - Black or African American population 15 years and over
Males 39.4% Never married43.6% Now married0.0% Separated0.0% Widowed17.0% DivorcedFemales 55.0% Never married45.0% Now married0.0% Separated0.0% Widowed0.0% DivorcedWomen who did not give birth in the past 12 months Now married:
24.3% (43)Unmarried:
75.7% (134)
Marital status - American Indian / Alaska Native population 15 years and over
Males 0.0% Never married30.0% Now married0.0% Separated0.0% Widowed70.0% DivorcedFemales 0.0% Never married0.0% Now married0.0% Separated100.0% Widowed0.0% DivorcedMarital status - Asian population 15 years and over
Males 38.9% Never married58.1% Now married0.0% Separated3.0% Widowed0.0% DivorcedFemales 0.0% Never married82.7% Now married0.0% Separated5.2% Widowed12.1% DivorcedWomen who did not give birth in the past 12 months Now married:
87.8% (99)Unmarried:
12.2% (14)
Marital status - Native Hawaiian / Pacific Islander population 15 years and over
Males 0.0% Never married100.0% Now married0.0% Separated0.0% Widowed0.0% DivorcedFemales 64.5% Never married35.5% Now married0.0% Separated0.0% Widowed0.0% DivorcedWomen who did not give birth in the past 12 months Now married:
0.0% (0)Unmarried:
100.0% (30)
Marital status - Other race population 15 years and over
Males 18.1% Never married77.4% Now married0.0% Separated0.0% Widowed4.5% DivorcedFemales 16.4% Never married66.3% Now married2.0% Separated4.9% Widowed10.4% DivorcedWomen who did not give birth in the past 12 months Now married:
71.5% (581)Unmarried:
28.5% (232)
Marital status - Two or more races population 15 years and over
Males 42.2% Never married52.4% Now married0.0% Separated1.7% Widowed3.7% DivorcedFemales 32.4% Never married60.3% Now married0.0% Separated5.9% Widowed1.3% DivorcedWomen who gave birth in the past 12 months Now married:
0.0% (0)Unmarried:
100.0% (39)
Women who did not give birth in the past 12 months Now married:
54.4% (917)Unmarried:
45.6% (770)
Marital status - White alone, not Hispanic / Latino population 15 years and over
Males 14.2% Never married71.2% Now married0.6% Separated4.3% Widowed9.7% DivorcedFemales 11.6% Never married63.3% Now married0.4% Separated14.7% Widowed10.0% DivorcedWomen who gave birth in the past 12 months Now married:
63.8% (125)Unmarried:
36.2% (71)
Women who did not give birth in the past 12 months Now married:
45.7% (1,608)Unmarried:
54.3% (1,908)
Marital status - Hispanic or Latino population 15 years and over
Males 42.8% Never married48.0% Now married5.1% Separated1.0% Widowed3.1% DivorcedFemales 28.2% Never married52.1% Now married3.6% Separated4.0% Widowed12.1% DivorcedWomen who gave birth in the past 12 months Now married:
68.6% (53)Unmarried:
31.4% (24)
Women who did not give birth in the past 12 months Now married:
54.1% (1,623)Unmarried:
45.9% (1,375)
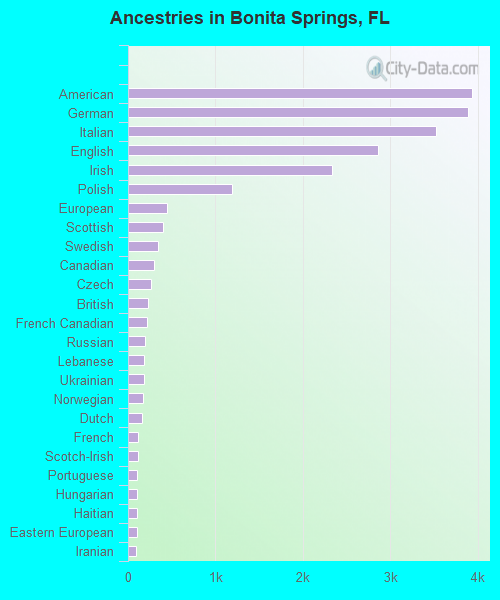
Ancestries in Bonita Springs
3,934 12.2% American3,893 12.1% German3,522 10.9% Italian2,866 8.9% English2,335 7.3% Irish1,195 3.7% Polish447 1.4% European406 1.3% Scottish347 1.1% Swedish300 0.9% Canadian268 0.8% Czech230 0.7% British217 0.7% French Canadian194 0.6% Russian182 0.6% Lebanese182 0.6% Ukrainian166 0.5% Norwegian164 0.5% Dutch113 0.4% French112 0.3% Scotch-Irish105 0.3% Portuguese104 0.3% Hungarian102 0.3% Haitian99 0.3% Eastern European96 0.3% Iranian77 0.2% Slovene76 0.2% Austrian73 0.2% Northern European56 0.2% Syrian55 0.2% Greek52 0.2% Scandinavian51 0.2% Brazilian45 0.1% Belgian42 0.1% Welsh41 0.1% Lithuanian33 0.1% Armenian29 0.09% Czechoslovakian27 0.08% Albanian27 0.08% Turkish26 0.08% Jamaican25 0.08% Danish23 0.07% Macedonian23 0.07% Slovak20 0.06% Romanian20 0.06% Croatian16 0.05% Serbian15 0.05% Yugoslavian12 0.04% Israeli11 0.03% Latvian10 0.03% Slavic10 0.03% Iraqi9 0.03% Finnish6 0.02% Swiss
Geographical mobility in Bonita Springs Same house 1 year ago 36,803 86.1% White (Caucasian)886 98.8% Black or African American27 100.0% American Indian / Alaska Native696 84.2% Asian73 100.0% Native Hawaiian / Pacific Islander2,534 97.4% Other race7,207 87.6% Two or more races35,286 86.7% White alone, not Hispanic / Latino11,992 90.0% Hispanic or LatinoMoved within same county 1,497 3.5% White / Caucasian12 1.3% Black or African American102 12.3% Asian116 1.4% Two or more races1,421 3.5% White alone, not Hispanic / Latino269 2.0% Hispanic or LatinoMoved within same state 981 2.3% White / Caucasian28 3.1% Black or African American147 1.8% Two or more races954 2.3% White alone, not Hispanic / Latino178 1.3% Hispanic or LatinoMoved from different state 3,290 7.7% White / Caucasian9 1.1% Black or African American29 3.5% Asian78 3.0% Other race267 3.2% Two or more races2,980 7.3% White alone, not Hispanic / Latino381 2.9% Hispanic or LatinoMoved from abroad 646 1.5% White518 6.3% Two or more races465 1.1% White alone, not Hispanic / Latino607 4.6% Hispanic or Latino
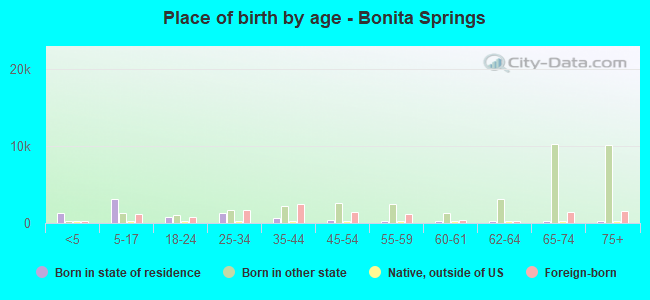
Children Nativity (place of birth) in Bonita Springs
Children under 6 years - Living with two parents Both parents native 757 100.0% NativeBoth parents foreign-born 329 45.3% Native398 54.7% Foreign-bornOne native, one foreign-born parent 277 100.0% NativeChildren under 6 years - Living with one parent Native parent 288 100.0% NativeForeign-born parent 81 100.0% NativeChildren 6 to 17 years - Living with two parents Both parents native 1,738 100.0% NativeBoth parents foreign-born 413 48.4% Native440 51.6% Foreign-bornOne native, one foreign-born parent 392 100.0% NativeChildren 6 to 17 years - Living with one parent Native parent 422 100.0% NativeForeign-born parent 884 69.8% Native383 30.2% Foreign-born
Grandparents responsible for own grandchildren in Bonita Springs
Grandparents (30 to 59 years) White / Caucasian 34 28.0% Responsible for grandchildren87 72.0% Not responsible for grandchildrenOther race 599 100.0% Not responsible for grandchildrenTwo or more races 8 100.0% Not responsible for grandchildrenWhite alone, not Hispanic / Latino 41 40.9% Responsible for grandchildren59 59.1% Not responsible for grandchildrenHispanic or Latino 496 100.0% Not responsible for grandchildrenGrandparents (60 years and over) White / Caucasian 151 79.0% Responsible for grandchildren40 21.0% Not responsible for grandchildrenTwo or more races 13 100.0% Not responsible for grandchildrenWhite alone, not Hispanic / Latino 152 77.0% Responsible for grandchildren45 23.0% Not responsible for grandchildrenHispanic or Latino 8 100.0% Not responsible for grandchildren