Races in Bossier City, Louisiana (LA) Detailed Stats
Data:
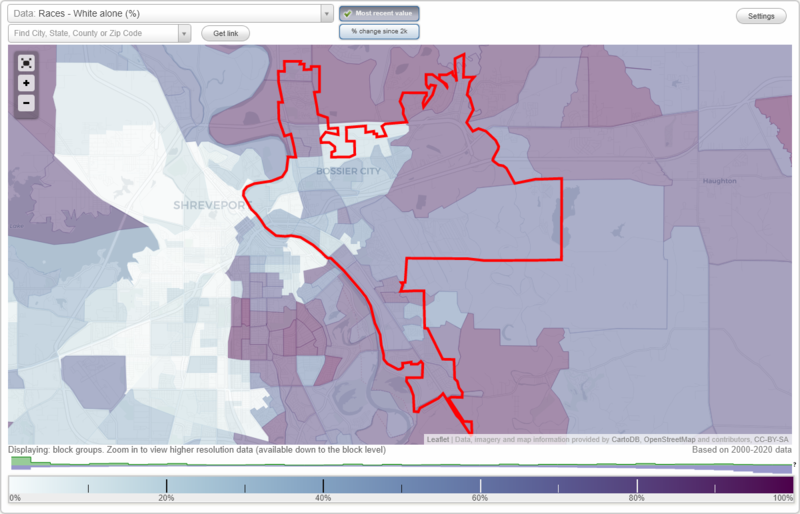
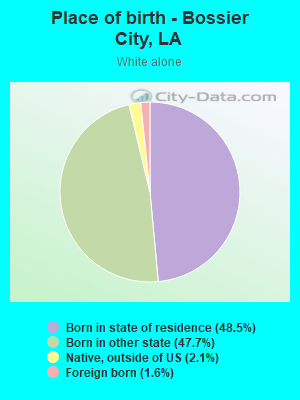
Races - White alone (%)
Races - White alone (% change since 2000)
Races - Black alone (%)
Races - Black alone (% change since 2000)
Races - American Indian alone (%)
Races - American Indian alone (% change since 2000)
Races - Asian alone (%)
Races - Asian alone (% change since 2000)
Races - Hispanic (%)
Races - Hispanic (% change since 2000)
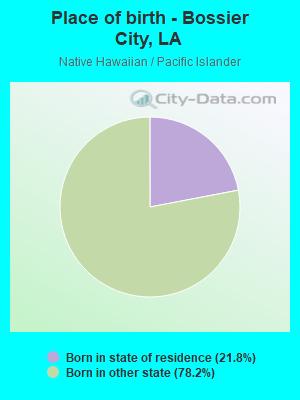
Races - Native Hawaiian and Other Pacific Islander alone (%)
Races - Native Hawaiian and Other Pacific Islander alone (% change since 2000)
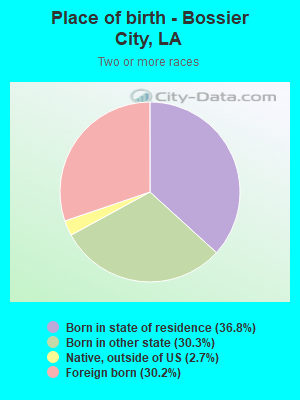
Races - Two or more races(%)
Races - Two or more races(% change since 2000)
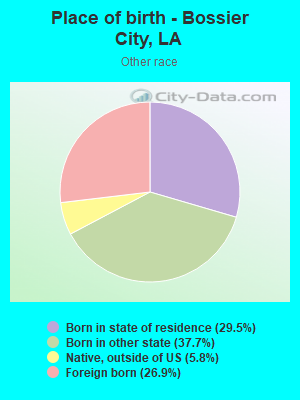
Races - Other race alone (%)
Races - Other race alone (% change since 2000)
Racial diversity
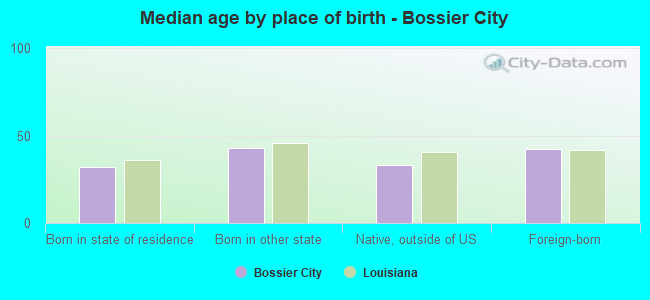
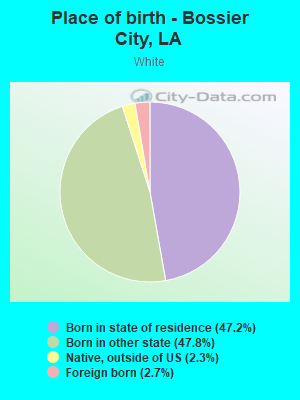
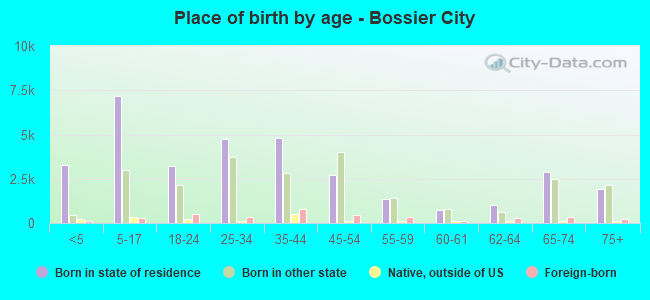
Place of birth - Born in state of residence (%)
Place of birth - Born in state of residence (%) - White
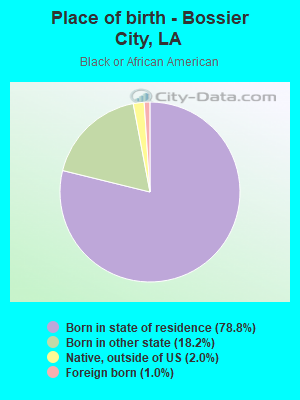
Place of birth - Born in state of residence (%) - Black or African American
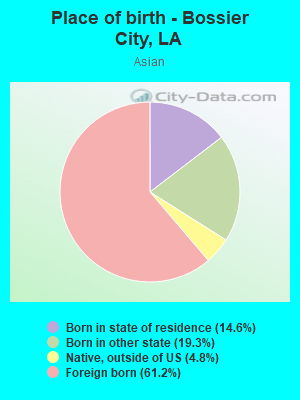
Place of birth - Born in state of residence (%) - Asian
Place of birth - Born in state of residence (%) - Hispanic or Latino
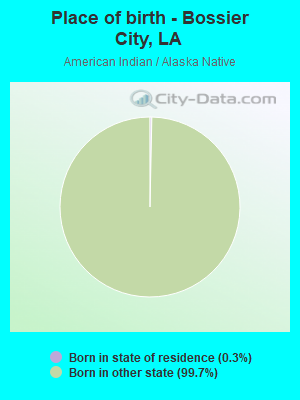
Place of birth - Born in state of residence (%) - American Indian and Alaska Native
Place of birth - Born in state of residence (%) - Multirace
Place of birth - Born in state of residence (%) - Other Race
Place of birth - Born in other state (%)
Place of birth - Born in other state (%) - White
Place of birth - Born in other state (%) - Black or African American
Place of birth - Born in other state (%) - Asian
Place of birth - Born in other state (%) - Hispanic or Latino
Place of birth - Born in other state (%) - American Indian and Alaska Native
Place of birth - Born in other state (%) - Multirace
Place of birth - Born in other state (%) - Other Race
Place of birth - Native, outside of US (%)
Place of birth - Native, outside of US (%) - White
Place of birth - Native, outside of US (%) - Black or African American
Place of birth - Native, outside of US (%) - Asian
Place of birth - Native, outside of US (%) - Hispanic or Latino
Place of birth - Native, outside of US (%) - American Indian and Alaska Native
Place of birth - Native, outside of US (%) - Multirace
Place of birth - Native, outside of US (%) - Other Race
Place of birth - Foreign born (%)
Place of birth - Foreign born (%) - White
Place of birth - Foreign born (%) - Black or African American
Place of birth - Foreign born (%) - Asian
Place of birth - Foreign born (%) - Hispanic or Latino
Place of birth - Foreign born (%) - American Indian and Alaska Native
Place of birth - Foreign born (%) - Multirace
Place of birth - Foreign born (%) - Other Race
Residents speaking English at home (%)
Residents speaking English at home - Born in the United States (%)
Residents speaking English at home - Native, born elsewhere (%)
Residents speaking English at home - Foreign born (%)
Residents speaking Spanish at home (%)
Residents speaking Spanish at home - Born in the United States (%)
Residents speaking Spanish at home - Native, born elsewhere (%)
Residents speaking Spanish at home - Foreign born (%)
Residents speaking other language at home (%)
Residents speaking other language at home - Born in the United States (%)
Residents speaking other language at home - Native, born elsewhere (%)
Residents speaking other language at home - Foreign born (%)
Marital status - Never married (%)
Marital status - Now married (%)
Marital status - Separated (%)
Marital status - Widowed (%)
Marital status - Divorced (%)
Ancestries Reported - Arab (%)
Ancestries Reported - Czech (%)
Ancestries Reported - Danish (%)
Ancestries Reported - Dutch (%)
Ancestries Reported - English (%)
Ancestries Reported - French (%)
Ancestries Reported - French Canadian (%)
Ancestries Reported - German (%)
Ancestries Reported - Greek (%)
Ancestries Reported - Hungarian (%)
Ancestries Reported - Irish (%)
Ancestries Reported - Italian (%)
Ancestries Reported - Lithuanian (%)
Ancestries Reported - Norwegian (%)
Ancestries Reported - Polish (%)
Ancestries Reported - Portuguese (%)
Ancestries Reported - Russian (%)
Ancestries Reported - Scotch-Irish (%)
Ancestries Reported - Scottish (%)
Ancestries Reported - Slovak (%)
Ancestries Reported - Subsaharan African (%)
Ancestries Reported - Swedish (%)
Ancestries Reported - Swiss (%)
Ancestries Reported - Ukrainian (%)
Ancestries Reported - United States (%)
Ancestries Reported - Welsh (%)
Ancestries Reported - West Indian (%)
Ancestries Reported - Other (%)
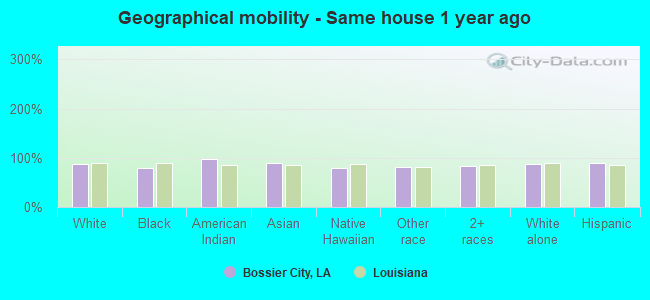
Geographical mobility - Same house 1 year ago (%)
Geographical mobility - Same house 1 year ago (%) - White
Geographical mobility - Same house 1 year ago (%) - Black or African American
Geographical mobility - Same house 1 year ago (%) - Asian
Geographical mobility - Same house 1 year ago (%) - Hispanic or Latino
Geographical mobility - Same house 1 year ago (%) - American Indian and Alaska Native
Geographical mobility - Same house 1 year ago (%) - Multirace
Geographical mobility - Same house 1 year ago (%) - Other Race
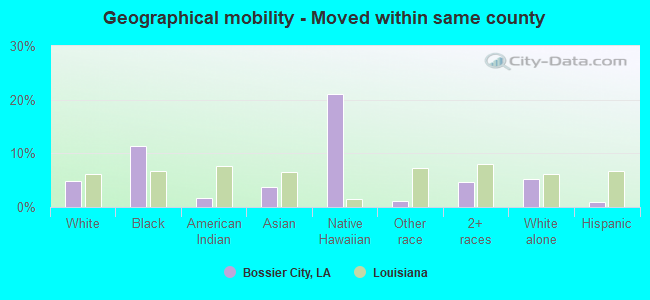
Geographical mobility - Moved within same county (%)
Geographical mobility - Moved within same county (%) - White
Geographical mobility - Moved within same county (%) - Black or African American
Geographical mobility - Moved within same county (%) - Asian
Geographical mobility - Moved within same county (%) - Hispanic or Latino
Geographical mobility - Moved within same county (%) - American Indian and Alaska Native
Geographical mobility - Moved within same county (%) - Multirace
Geographical mobility - Moved within same county (%) - Other Race
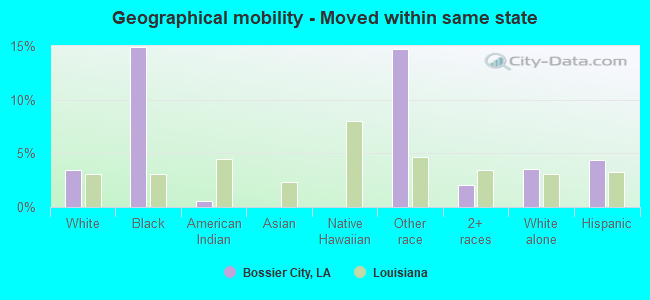
Geographical mobility - Moved from different county within same state (%)
Geographical mobility - Moved from different county within same state (%) - White
Geographical mobility - Moved from different county within same state (%) - Black or African American
Geographical mobility - Moved from different county within same state (%) - Asian
Geographical mobility - Moved from different county within same state (%) - Hispanic or Latino
Geographical mobility - Moved from different county within same state (%) - American Indian and Alaska Native
Geographical mobility - Moved from different county within same state (%) - Multirace
Geographical mobility - Moved from different county within same state (%) - Other Race
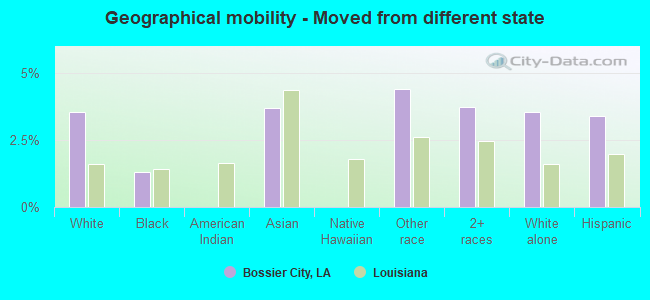
Geographical mobility - Moved from different state (%)
Geographical mobility - Moved from different state (%) - White
Geographical mobility - Moved from different state (%) - Black or African American
Geographical mobility - Moved from different state (%) - Asian
Geographical mobility - Moved from different state (%) - Hispanic or Latino
Geographical mobility - Moved from different state (%) - American Indian and Alaska Native
Geographical mobility - Moved from different state (%) - Multirace
Geographical mobility - Moved from different state (%) - Other Race
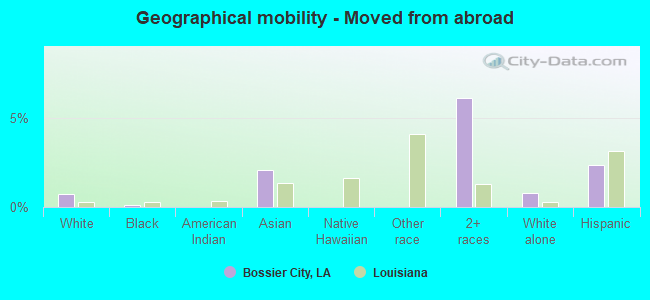
Geographical mobility - Moved from abroad (%)
Geographical mobility - Moved from abroad (%) - White
Geographical mobility - Moved from abroad (%) - Black or African American
Geographical mobility - Moved from abroad (%) - Asian
Geographical mobility - Moved from abroad (%) - Hispanic or Latino
Geographical mobility - Moved from abroad (%) - American Indian and Alaska Native
Geographical mobility - Moved from abroad (%) - Multirace
Geographical mobility - Moved from abroad (%) - Other Race
Place of birth for the foreign-born population - Ireland (%)
Place of birth for the foreign-born population - Denmark (%)
Place of birth for the foreign-born population - Norway (%)
Place of birth for the foreign-born population - Sweden (%)
Place of birth for the foreign-born population - United Kingdom (%)
Place of birth for the foreign-born population - England (%)
Place of birth for the foreign-born population - Scotland (%)
Place of birth for the foreign-born population - Other Northern Europe (%)
Place of birth for the foreign-born population - Austria (%)
Place of birth for the foreign-born population - Belgium (%)
Place of birth for the foreign-born population - France (%)
Place of birth for the foreign-born population - Germany (%)
Place of birth for the foreign-born population - Netherlands (%)
Place of birth for the foreign-born population - Switzerland (%)
Place of birth for the foreign-born population - Other Western Europe (%)
Place of birth for the foreign-born population - Greece (%)
Place of birth for the foreign-born population - Italy (%)
Place of birth for the foreign-born population - Portugal (%)
Place of birth for the foreign-born population - Spain (%)
Place of birth for the foreign-born population - Other Southern Europe (%)
Place of birth for the foreign-born population - Albania (%)
Place of birth for the foreign-born population - Belarus (%)
Place of birth for the foreign-born population - Bosnia and Herzegovina (%)
Place of birth for the foreign-born population - Bulgaria (%)
Place of birth for the foreign-born population - Croatia (%)
Place of birth for the foreign-born population - Czechoslovakia (%)
Place of birth for the foreign-born population - Hungary (%)
Place of birth for the foreign-born population - Latvia (%)
Place of birth for the foreign-born population - Lithuania (%)
Place of birth for the foreign-born population - North Macedonia (Macedonia) (%)
Place of birth for the foreign-born population - Moldova (%)
Place of birth for the foreign-born population - Poland (%)
Place of birth for the foreign-born population - Romania (%)
Place of birth for the foreign-born population - Russia (%)
Place of birth for the foreign-born population - Serbia (%)
Place of birth for the foreign-born population - Ukraine (%)
Place of birth for the foreign-born population - Other Eastern Europe (%)
Place of birth for the foreign-born population - China (%)
Place of birth for the foreign-born population - Hong Kong (%)
Place of birth for the foreign-born population - Taiwan (%)
Place of birth for the foreign-born population - Japan (%)
Place of birth for the foreign-born population - Korea (%)
Place of birth for the foreign-born population - Other Eastern Asia (%)
Place of birth for the foreign-born population - Afghanistan (%)
Place of birth for the foreign-born population - Bangladesh (%)
Place of birth for the foreign-born population - India (%)
Place of birth for the foreign-born population - Iran (%)
Place of birth for the foreign-born population - Kazakhstan (%)
Place of birth for the foreign-born population - Nepal (%)
Place of birth for the foreign-born population - Pakistan (%)
Place of birth for the foreign-born population - Sri Lanka (%)
Place of birth for the foreign-born population - Uzbekistan (%)
Place of birth for the foreign-born population - Other South Central Asia (%)
Place of birth for the foreign-born population - Burma (%)
Place of birth for the foreign-born population - Cambodia (%)
Place of birth for the foreign-born population - Indonesia (%)
Place of birth for the foreign-born population - Laos (%)
Place of birth for the foreign-born population - Malaysia (%)
Place of birth for the foreign-born population - Philippines (%)
Place of birth for the foreign-born population - Singapore (%)
Place of birth for the foreign-born population - Thailand (%)
Place of birth for the foreign-born population - Vietnam (%)
Place of birth for the foreign-born population - Other South Eastern Asia (%)
Place of birth for the foreign-born population - Armenia (%)
Place of birth for the foreign-born population - Iraq (%)
Place of birth for the foreign-born population - Israel (%)
Place of birth for the foreign-born population - Jordan (%)
Place of birth for the foreign-born population - Kuwait (%)
Place of birth for the foreign-born population - Lebanon (%)
Place of birth for the foreign-born population - Saudi Arabia (%)
Place of birth for the foreign-born population - Syria (%)
Place of birth for the foreign-born population - Turkey (%)
Place of birth for the foreign-born population - Yemen (%)
Place of birth for the foreign-born population - Other Western Asia (%)
Place of birth for the foreign-born population - Eritrea (%)
Place of birth for the foreign-born population - Ethiopia (%)
Place of birth for the foreign-born population - Kenya (%)
Place of birth for the foreign-born population - Somalia (%)
Place of birth for the foreign-born population - Uganda (%)
Place of birth for the foreign-born population - Zimbabwe (%)
Place of birth for the foreign-born population - Other Eastern Africa (%)
Place of birth for the foreign-born population - Cameroon (%)
Place of birth for the foreign-born population - Congo (%)
Place of birth for the foreign-born population - Democratic Republic of Congo (Zaire) (%)
Place of birth for the foreign-born population - Other Middle Africa (%)
Place of birth for the foreign-born population - Egypt (%)
Place of birth for the foreign-born population - Morocco (%)
Place of birth for the foreign-born population - Sudan (%)
Place of birth for the foreign-born population - Other Northern Africa (%)
Place of birth for the foreign-born population - South Africa (%)
Place of birth for the foreign-born population - Other Southern Africa (%)
Place of birth for the foreign-born population - Cabo Verde (%)
Place of birth for the foreign-born population - Ghana (%)
Place of birth for the foreign-born population - Liberia (%)
Place of birth for the foreign-born population - Nigeria (%)
Place of birth for the foreign-born population - Senegal (%)
Place of birth for the foreign-born population - Sierra Leone (%)
Place of birth for the foreign-born population - Other Western Africa (%)
Place of birth for the foreign-born population - Australia (%)
Place of birth for the foreign-born population - New Zealand (%)
Place of birth for the foreign-born population - Fiji (%)
Place of birth for the foreign-born population - Micronesia (%)
Place of birth for the foreign-born population - Bahamas (%)
Place of birth for the foreign-born population - Barbados (%)
Place of birth for the foreign-born population - Cuba (%)
Place of birth for the foreign-born population - Dominica (%)
Place of birth for the foreign-born population - Dominican Republic (%)
Place of birth for the foreign-born population - Grenada (%)
Place of birth for the foreign-born population - Haiti (%)
Place of birth for the foreign-born population - Jamaica (%)
Place of birth for the foreign-born population - St. Vincent and the Grenadines (%)
Place of birth for the foreign-born population - Trinidad and Tobago (%)
Place of birth for the foreign-born population - West Indies (%)
Place of birth for the foreign-born population - Other Caribbean (%)
Place of birth for the foreign-born population - Belize (%)
Place of birth for the foreign-born population - Costa Rica (%)
Place of birth for the foreign-born population - El Salvador (%)
Place of birth for the foreign-born population - Guatemala (%)
Place of birth for the foreign-born population - Honduras (%)
Place of birth for the foreign-born population - Mexico (%)
Place of birth for the foreign-born population - Nicaragua (%)
Place of birth for the foreign-born population - Panama (%)
Place of birth for the foreign-born population - Other Central America (%)
Place of birth for the foreign-born population - Argentina (%)
Place of birth for the foreign-born population - Bolivia (%)
Place of birth for the foreign-born population - Brazil (%)
Place of birth for the foreign-born population - Chile (%)
Place of birth for the foreign-born population - Colombia (%)
Place of birth for the foreign-born population - Ecuador (%)
Place of birth for the foreign-born population - Guyana (%)
Place of birth for the foreign-born population - Peru (%)
Place of birth for the foreign-born population - Uruguay (%)
Place of birth for the foreign-born population - Venezuela (%)
Place of birth for the foreign-born population - Other South America (%)
Place of birth for the foreign-born population - Canada (%)
Place of birth for the foreign-born population - Other Northern America (%)
Place of birth for the foreign-born population - Other (%)
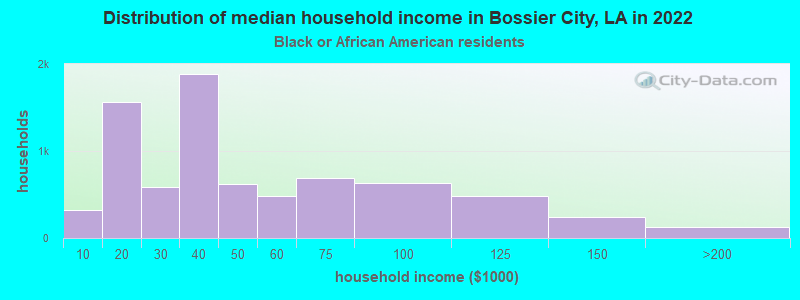
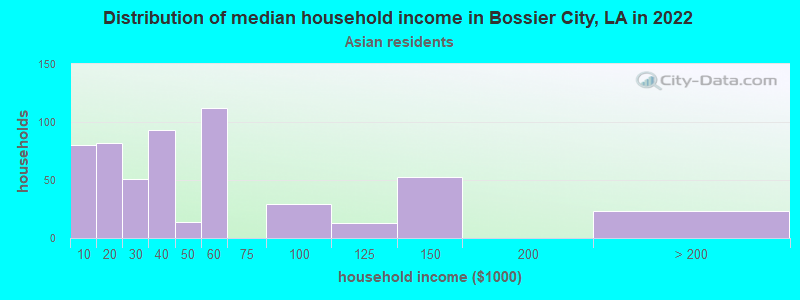
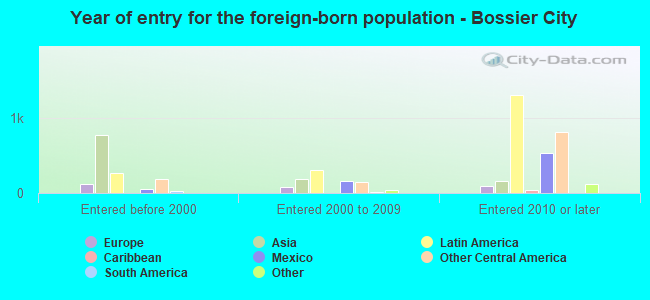
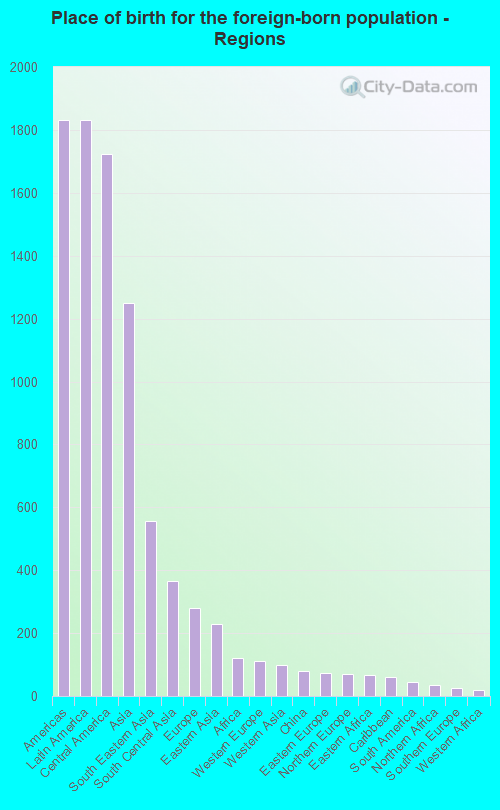
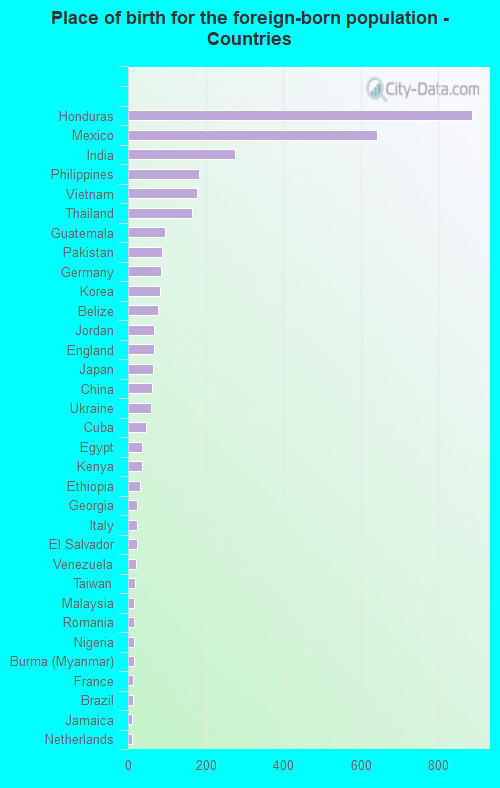
According to 2022 data, the most numerous races in Bossier City, LA are White alone (35,731 residents), Black alone (17,798 residents), and Hispanic (6,635 residents). 89.1% of Bossier City residents speak English at home. 5.5% of Bossier City, LA residents are foreign-born (2.9% born in Latin America, 1.9% born in Asia), which is 27.5% greater than the foreign-born rate of 4.0% across the entire state of Louisiana.
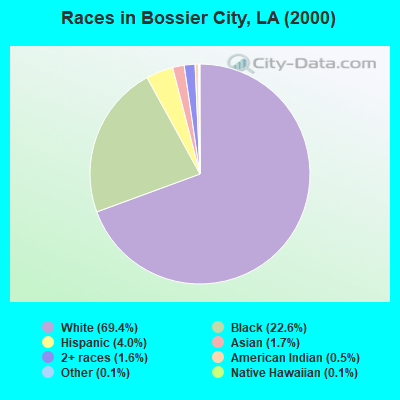
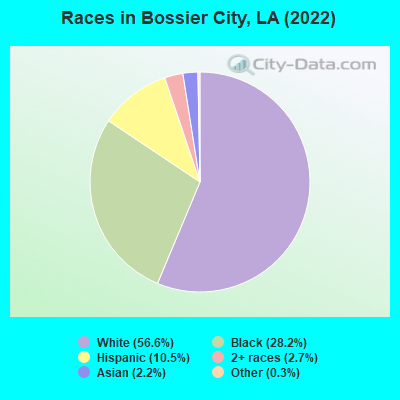
Race distribution in Bossier City
2000 2022
2,794,391 62.5% White alone 1,443,390 32.3% Black alone 107,738 2.4% Hispanic 54,256 1.2% Asian alone 39,260 0.9% Two or more races 24,129 0.5% American Indian alone 4,736 0.1% Other race alone 1,076 0.02% Native Hawaiian and Other
2,603,221 56.7% White alone 1,420,055 30.9% Black alone 262,213 5.7% Hispanic 183,270 4.0% Two or more races 81,169 1.8% Asian alone 19,991 0.4% American Indian alone 18,043 0.4% Other race alone 2,279 0.05% Native Hawaiian and Other
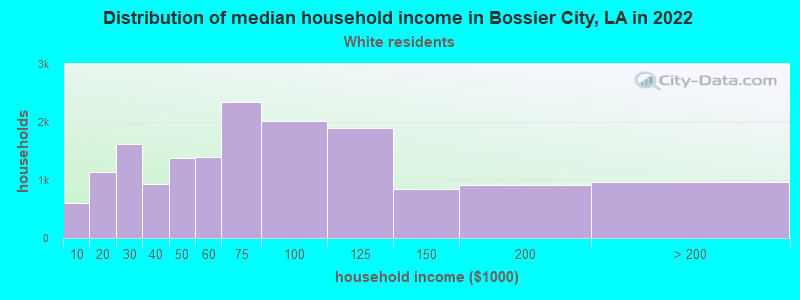
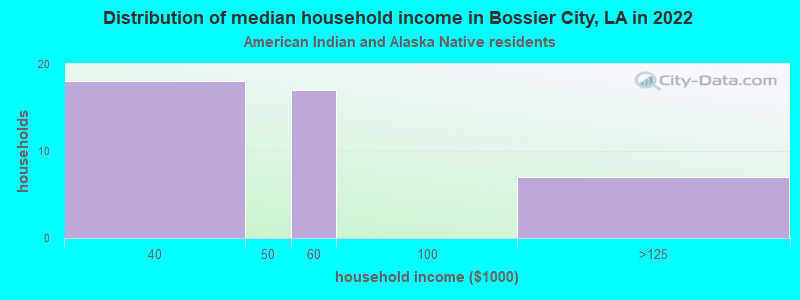
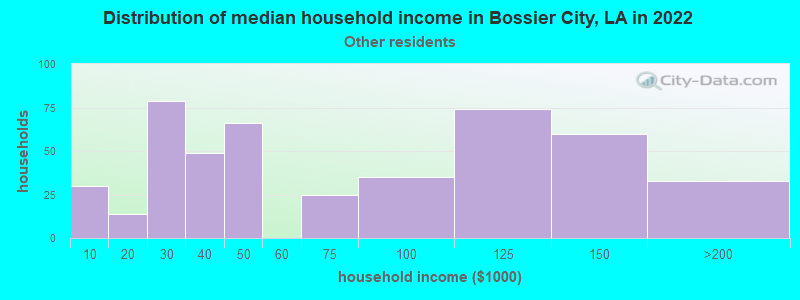
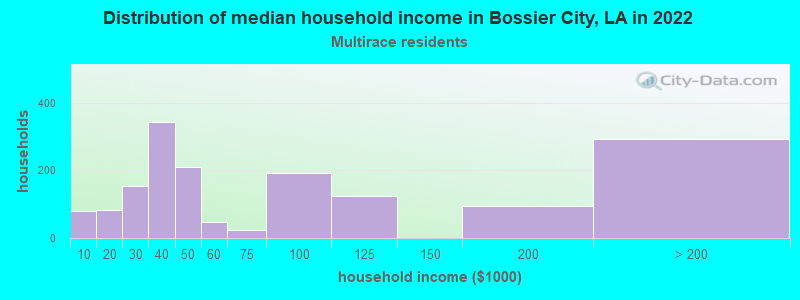
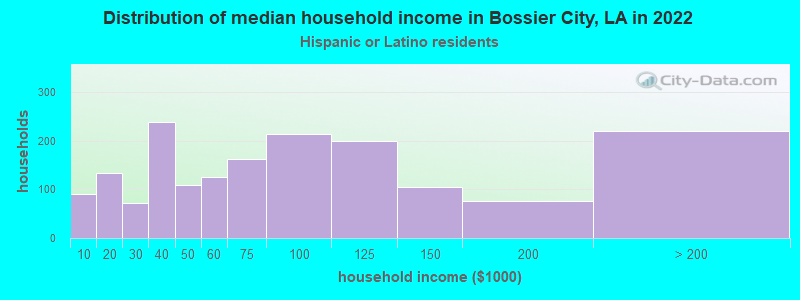
Income and house value in Bossier City Median household income in 2022 $62,451 White non-Hispanic householders$35,893 Black householders$51,080 American Indian and Alaska Native householders$33,127 Asian householders$61,182 Some other race householders$38,756 Two or more races householders$91,184 Hispanic or Latino race householdersMedian 2022 house value $213,189 White Non-Hispanic householders$153,045 Black or African American householders$187,596 American Indian or Alaska Native householders $196,809 Asian householders$287,920 Native Hawaiian and other Pacific Islander householders$155,093 Some other race householders$184,269 Two or more races householders$189,643 Hispanic or Latino householders
Median age by race in Bossier City
39.8 Median age for White residents38.5 42.1 34.3 Median age for Black or African American residents32.7 35.3 19.3 Median age for American Indian / Alaska Native residents78.5 52.5 46.5 Median age for Asian residents49.6 56.2 -821,138,210.6 Median age for Native Hawaiian / Pacific Islander residents-868,167,201.7 -666,666,666.0 28.6 Median age for Other race residents22.4 26.6 23.2 Median age for Two or more races residents20.5 29.5 41.1 Median age for White alone residents38.6 45.0 24.9 Median age for Hispanic or Latino residents23.7 24.5
Owner/renter occupied households by race in Bossier City
House owners and renters - White residents 10,565 67.8% Owner occupied5,009 32.2% Renter occupiedHouse owners and renters - Black or African American residents 2,453 31.0% Owner occupied5,465 69.0% Renter occupiedHouse owners and renters - American Indian / Alaska Native residents 30 59.8% Owner occupied20 40.2% Renter occupiedHouse owners and renters - Asian residents 268 61.2% Owner occupied169 38.8% Renter occupiedHouse owners and renters - Native Hawaiian / Pacific Islander residents 1 100.0% Owner occupiedHouse owners and renters - Other race residents 146 30.2% Owner occupied337 69.8% Renter occupiedHouse owners and renters - Two or more races residents 721 42.7% Owner occupied968 57.3% Renter occupiedHouse owners and renters - White alone residents 10,229 68.1% Owner occupied4,797 31.9% Renter occupiedHouse owners and renters - Hispanic or Latino residents 1,009 57.3% Owner occupied753 42.7% Renter occupied
Language usage in Bossier City
English speakers - Total 89.1% of residents of Bossier City speak English at home.
7.5% of residents speak Spanish at home 2,138 48.2% Speak English very well2,301 51.8% Speak English less than very well3.9% of residents speak other language at home 1,815 79.4% Speak English very well470 20.6% Speak English less than very well
English speakers - Born in the United States 91.8% of residents of Bossier City speak English at home.
6.8% of residents speak Spanish at home 1,152 71.8% Speak English very well452 28.2% Speak English less than very well1.4% of residents speak other language at home 194 60.2% Speak English very well128 39.8% Speak English less than very well
English speakers - Native, born elsewhere 62.2% of residents of Bossier City speak English at home.
7.2% of residents speak Spanish at home 98 94.2% Speak English very well6 5.8% Speak English less than very well12.2% of residents speak other language at home 169 96.6% Speak English very well6 3.4% Speak English less than very well
English speakers - Foreign-born 19.6% of residents of Bossier City speak English at home.
47.4% of residents speak Spanish at home 144 8.2% Speak English very well1,617 91.8% Speak English less than very well34.0% of residents speak other language at home 807 63.9% Speak English very well455 36.1% Speak English less than very well
White (Caucasian) - Speak only English Native:
95.9% (33,267)Foreign-born:
33.2% (316)
White (Caucasian) - Speak another language Native:
4.0% (1,374)Foreign-born:
62.8% (597)
Black or African American - Speak only English Native:
98.9% (15,374)Foreign-born:
44.9% (82)
Black or African American - Speak another language Native:
1.0% (158)Foreign-born:
54.9% (101)
Asian - Speak only English Native:
48.6% (255)Foreign-born:
28.6% (277)
Asian - Speak another language Native:
50.2% (264)Foreign-born:
68.3% (662)
Other race - Speak only English Native:
47.3% (488)Foreign-born:
4.3% (15)
Other race - Speak another language Native:
50.7% (522)Foreign-born:
96.4% (332)
Two or more races - Speak only English Native:
62.0% (2,023)Foreign-born:
1.4% (23)
Two or more races - Speak another language Native:
49.5% (1,618)Foreign-born:
99.1% (1,635)
White alone - Speak only English Native:
98.2% (32,752)Foreign-born:
40.8% (221)
White alone - Speak another language Native:
1.9% (643)Foreign-born:
58.7% (318)
Hispanic or Latino - Speak only English Native:
39.7% (1,701)Foreign-born:
8.2% (162)
Hispanic or Latino - Speak another language Native:
61.1% (2,614)Foreign-born:
91.7% (1,803)
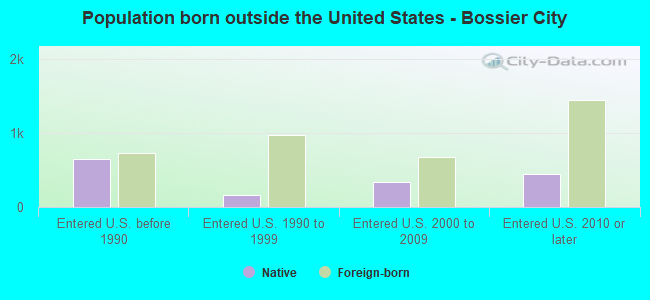
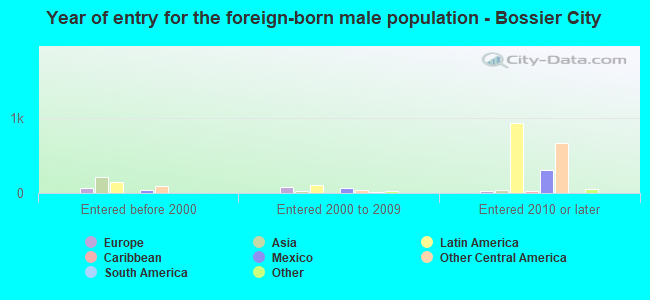
Foreign-born residents in Bossier City 3,485 residents are foreign born (2.9% Latin America , 1.9% Asia ).
This city:
5.5%Louisiana:
4.2%
Marital status for residents in Bossier City Marital status - White (Caucasian) population 15 years and over
Males 32.3% Never married48.1% Now married0.8% Separated4.6% Widowed14.2% DivorcedFemales 20.8% Never married46.1% Now married1.8% Separated14.8% Widowed16.6% DivorcedWomen who gave birth in the past 12 months Now married:
69.4% (166)Unmarried:
30.6% (73)
Women who did not give birth in the past 12 months Now married:
50.6% (3,891)Unmarried:
49.4% (3,797)
Marital status - Black or African American population 15 years and over
Males 49.3% Never married35.6% Now married4.1% Separated2.1% Widowed9.0% DivorcedFemales 48.1% Never married30.2% Now married1.2% Separated5.8% Widowed14.7% DivorcedWomen who gave birth in the past 12 months Now married:
30.2% (38)Unmarried:
69.8% (88)
Women who did not give birth in the past 12 months Now married:
28.4% (1,268)Unmarried:
71.6% (3,202)
Marital status - American Indian / Alaska Native population 15 years and over
Males 0.0% Never married100.0% Now married0.0% Separated0.0% Widowed0.0% DivorcedFemales 57.0% Never married42.5% Now married0.5% Separated0.0% Widowed0.0% DivorcedWomen who did not give birth in the past 12 months Now married:
42.7% (78)Unmarried:
57.3% (105)
Marital status - Asian population 15 years and over
Males 12.9% Never married87.1% Now married0.0% Separated0.0% Widowed0.0% DivorcedFemales 7.5% Never married77.5% Now married0.0% Separated10.1% Widowed4.9% DivorcedWomen who did not give birth in the past 12 months Now married:
82.1% (361)Unmarried:
17.9% (79)
Marital status - Other race population 15 years and over
Males 64.3% Never married33.0% Now married0.0% Separated0.0% Widowed2.7% DivorcedFemales 54.2% Never married38.2% Now married0.0% Separated1.1% Widowed6.5% DivorcedWomen who did not give birth in the past 12 months Now married:
38.5% (170)Unmarried:
61.5% (273)
Marital status - Two or more races population 15 years and over
Males 47.1% Never married45.6% Now married1.3% Separated0.0% Widowed6.0% DivorcedFemales 35.6% Never married31.6% Now married1.5% Separated19.9% Widowed11.5% DivorcedWomen who gave birth in the past 12 months Now married:
27.6% (22)Unmarried:
72.4% (59)
Women who did not give birth in the past 12 months Now married:
40.6% (420)Unmarried:
59.4% (615)
Marital status - White alone, not Hispanic / Latino population 15 years and over
Males 31.8% Never married48.0% Now married0.9% Separated4.8% Widowed14.4% DivorcedFemales 20.2% Never married45.7% Now married1.8% Separated15.3% Widowed17.0% DivorcedWomen who gave birth in the past 12 months Now married:
68.9% (162)Unmarried:
31.1% (73)
Women who did not give birth in the past 12 months Now married:
50.3% (3,596)Unmarried:
49.7% (3,549)
Marital status - Hispanic or Latino population 15 years and over
Males 46.8% Never married45.9% Now married0.7% Separated1.4% Widowed5.2% DivorcedFemales 42.9% Never married47.9% Now married0.6% Separated2.7% Widowed5.9% DivorcedWomen who gave birth in the past 12 months Now married:
100.0% (22)Unmarried:
0.0% (0)
Women who did not give birth in the past 12 months Now married:
45.9% (798)Unmarried:
54.1% (939)
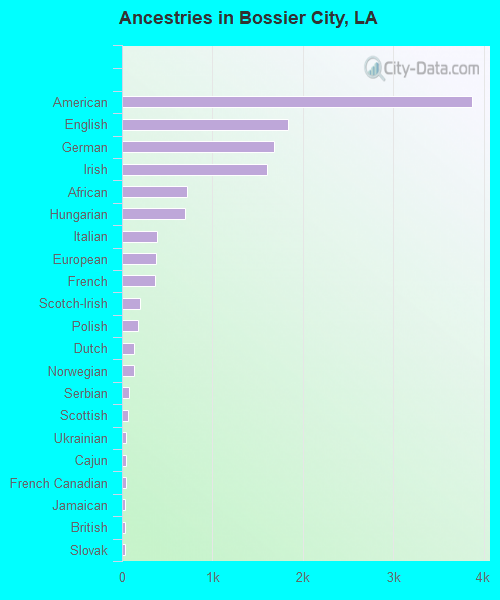
Ancestries in Bossier City
3,863 12.1% American1,834 5.7% English1,677 5.3% German1,603 5.0% Irish715 2.2% African700 2.2% Hungarian386 1.2% Italian376 1.2% European370 1.2% French198 0.6% Scotch-Irish180 0.6% Polish135 0.4% Dutch132 0.4% Norwegian75 0.2% Serbian63 0.2% Scottish48 0.2% Ukrainian45 0.1% Cajun43 0.1% French Canadian38 0.1% Jamaican36 0.1% British36 0.1% Slovak26 0.08% Eastern European25 0.08% Nigerian23 0.07% Swedish23 0.07% Welsh20 0.06% Czech18 0.06% Scandinavian15 0.05% Romanian14 0.04% Belgian14 0.04% Northern European14 0.04% Egyptian13 0.04% Kenyan13 0.04% Lebanese10 0.03% Jordanian9 0.03% Austrian8 0.03% Trinidadian and Tobagonian7 0.02% Guyanese6 0.02% Ethiopian5 0.02% British West Indian2 0.01% Portuguese
Geographical mobility in Bossier City Same house 1 year ago 32,896 87.3% White (Caucasian)13,786 78.8% Black or African American280 97.1% American Indian / Alaska Native1,396 89.4% Asian8 78.6% Native Hawaiian / Pacific Islander1,159 80.4% Other race4,480 84.3% Two or more races30,913 86.9% White alone, not Hispanic / Latino5,746 88.8% Hispanic or LatinoMoved within same county 1,860 4.9% White / Caucasian1,998 11.4% Black or African American5 1.6% American Indian / Alaska Native58 3.7% Asian2 21.0% Native Hawaiian / Pacific Islander15 1.1% Other race252 4.7% Two or more races1,863 5.2% White alone, not Hispanic / Latino57 0.9% Hispanic or LatinoMoved within same state 1,311 3.5% White / Caucasian2,610 14.9% Black or African American2 0.6% American Indian / Alaska Native212 14.7% Other race107 2.0% Two or more races1,269 3.6% White alone, not Hispanic / Latino284 4.4% Hispanic or LatinoMoved from different state 1,329 3.5% White / Caucasian229 1.3% Black or African American58 3.7% Asian63 4.4% Other race197 3.7% Two or more races1,255 3.5% White alone, not Hispanic / Latino218 3.4% Hispanic or LatinoMoved from abroad 268 0.7% White24 0.1% Black or African American32 2.0% Asian324 6.1% Two or more races271 0.8% White alone, not Hispanic / Latino152 2.3% Hispanic or Latino
Children Nativity (place of birth) in Bossier City
Children under 6 years - Living with two parents Both parents native 2,097 99.3% Native14 0.7% Foreign-bornBoth parents foreign-born 139 97.8% Native3 2.2% Foreign-bornOne native, one foreign-born parent 229 100.0% NativeChildren under 6 years - Living with one parent Native parent 2,173 98.9% Native24 1.1% Foreign-bornForeign-born parent 40 100.0% NativeChildren 6 to 17 years - Living with two parents Both parents native 4,387 98.8% Native55 1.2% Foreign-bornBoth parents foreign-born 263 66.2% Native134 33.8% Foreign-bornOne native, one foreign-born parent 355 96.4% Native13 3.6% Foreign-bornChildren 6 to 17 years - Living with one parent Native parent 3,202 100.0% NativeForeign-born parent 255 60.7% Native165 39.3% Foreign-born
Grandparents responsible for own grandchildren in Bossier City
Grandparents (30 to 59 years) White / Caucasian 115 54.1% Responsible for grandchildren98 45.9% Not responsible for grandchildrenBlack or African American 188 36.3% Responsible for grandchildren331 63.7% Not responsible for grandchildrenTwo or more races 55 100.0% Not responsible for grandchildrenWhite alone, not Hispanic / Latino 115 57.4% Responsible for grandchildren86 42.6% Not responsible for grandchildrenHispanic or Latino 39 100.0% Not responsible for grandchildrenGrandparents (60 years and over) White / Caucasian 144 39.7% Responsible for grandchildren218 60.3% Not responsible for grandchildrenBlack or African American 28 47.1% Responsible for grandchildren32 52.9% Not responsible for grandchildrenTwo or more races 278 93.2% Responsible for grandchildren20 6.8% Not responsible for grandchildrenWhite alone, not Hispanic / Latino 101 33.3% Responsible for grandchildren203 66.7% Not responsible for grandchildrenHispanic or Latino 44 50.1% Responsible for grandchildren44 49.9% Not responsible for grandchildren