Races in Brasher, New York (NY) Detailed Stats
Ancestries, Foreign-born residents, place of birth
1.7% of Brasher, NY residents are foreign-born , which is 1218.3% less than the foreign-born rate of 22.0% across the entire state of New York.
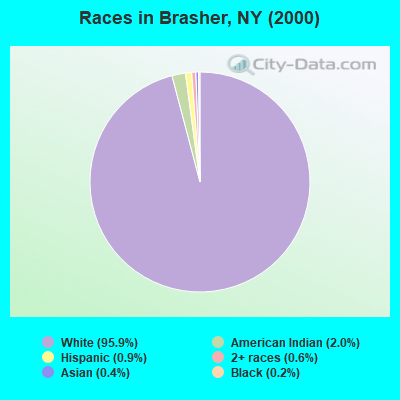
Race distribution in Brasher

- 2,24295.9%White alone
- 462.0%American Indian alone
- 200.9%Hispanic
- 150.6%Two or more races
- 90.4%Asian alone
- 50.2%Black alone
2000
2022
-
- 11,760,98162.0%White alone
- 2,867,58315.1%Hispanic
- 2,812,62314.8%Black alone
- 1,035,9265.5%Asian alone
- 366,1161.9%Two or more races
- 75,4990.4%Other race alone
- 52,4990.3%American Indian alone
- 5,2300.03%Native Hawaiian and Other
Pacific Islander alone

-
- 10,408,93352.9%White alone
- 3,867,29919.7%Hispanic
- 2,633,84013.4%Black alone
- 1,776,2869.0%Asian alone
- 732,6703.7%Two or more races
- 216,1101.1%Other race alone
- 35,0820.2%American Indian alone
- 6,9310.04%Native Hawaiian and Other
Pacific Islander alone

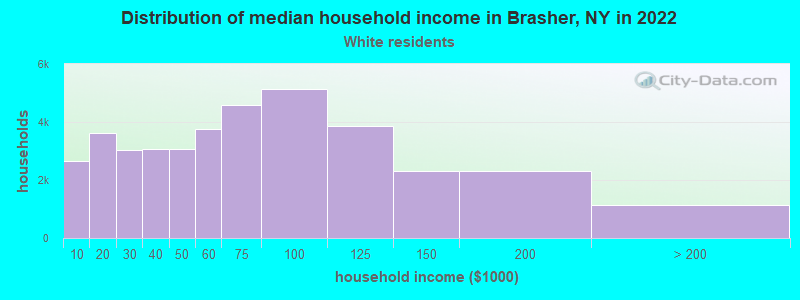
Income and house value in Brasher
- Median household income in 2022
- $57,817White non-Hispanic householders
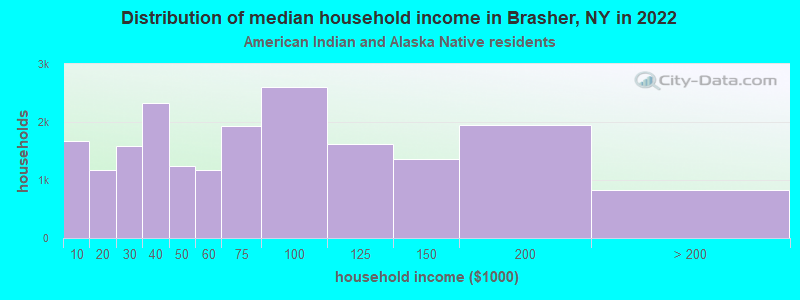
- $2,720American Indian and Alaska Native householders
- $65,830Some other race householders
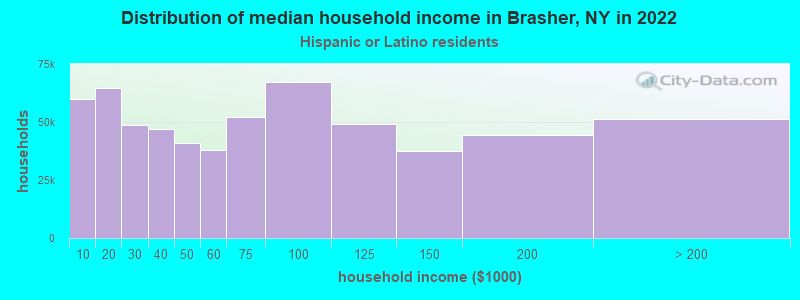
- $59,431Hispanic or Latino race householders
- Median 2022 house value
- $112,091White Non-Hispanic householders
- $36,125American Indian or Alaska Native householders
Household income for White non-Hispanic householders
Household income for American Indian and Alaska Native householders
Household income for Hispanic or Latino race householders
Foreign-born residents in Brasher
39 residents are foreign born
| This city: | 1.7% |
| New York: | 20.4% |
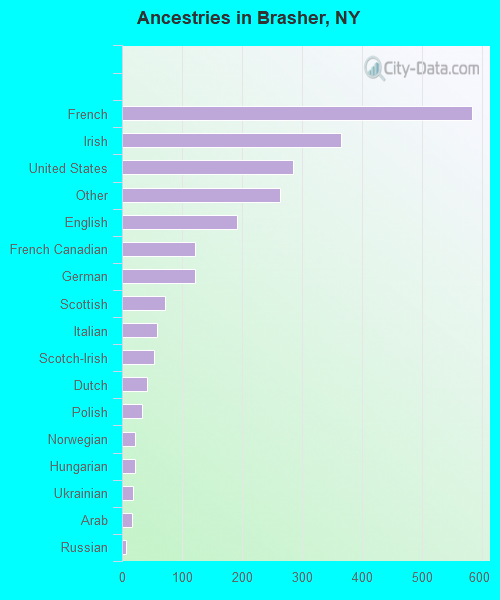
Ancestries in Brasher

- 58325.5%French
- 36616.0%Irish
- 28512.5%United States
- 26311.5%Other
- 1928.4%English
- 1225.3%French Canadian
- 1225.3%German
- 723.2%Scottish
- 582.5%Italian
- 532.3%Scotch-Irish
- 421.8%Dutch
- 331.4%Polish
- 221.0%Norwegian
- 210.9%Hungarian
- 180.8%Ukrainian
- 170.7%Arab
- 60.3%Russian
- 50.2%West Indian
- 30.1%Welsh
- 20.09%Czech
Zip codes: 13613.