Races in Breckenridge, Texas (TX) Detailed Stats
Data:
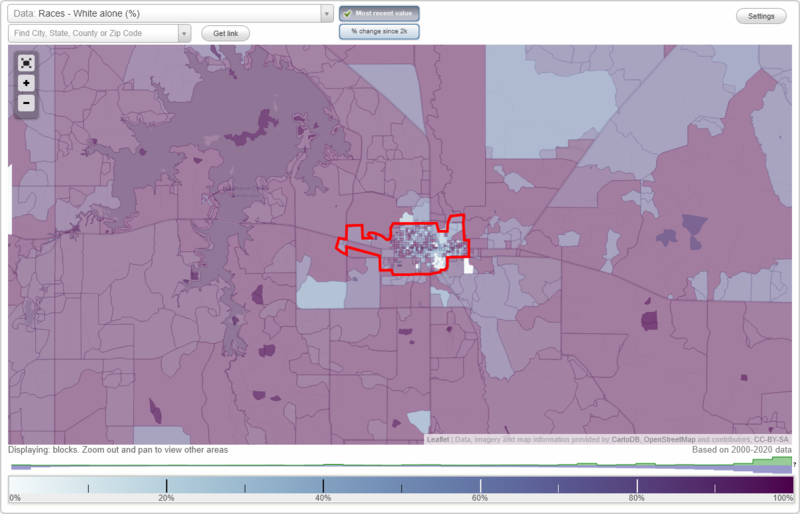
Races - White alone (%)
Races - White alone (% change since 2000)
Races - Black alone (%)
Races - Black alone (% change since 2000)
Races - American Indian alone (%)
Races - American Indian alone (% change since 2000)
Races - Asian alone (%)
Races - Asian alone (% change since 2000)
Races - Hispanic (%)
Races - Hispanic (% change since 2000)
Races - Native Hawaiian and Other Pacific Islander alone (%)
Races - Native Hawaiian and Other Pacific Islander alone (% change since 2000)
Races - Two or more races(%)
Races - Two or more races(% change since 2000)
Races - Other race alone (%)
Races - Other race alone (% change since 2000)
Racial diversity
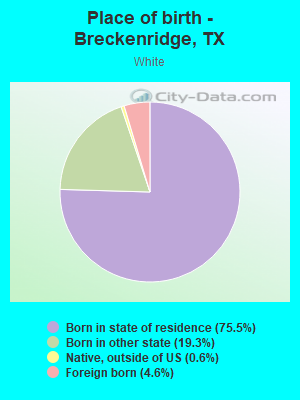
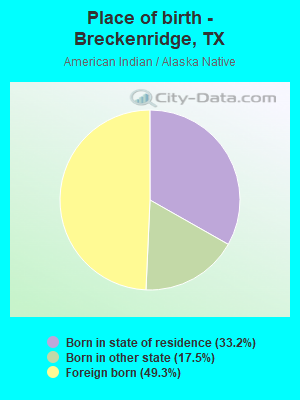
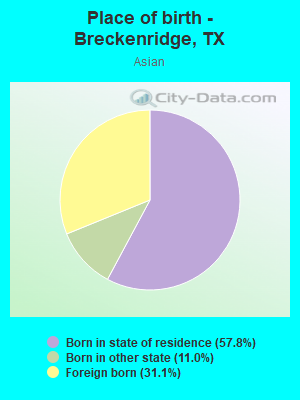
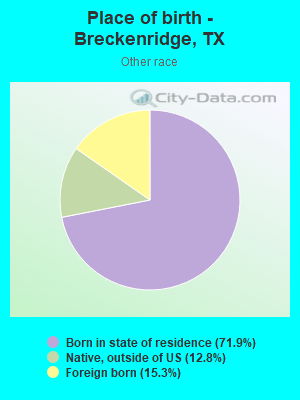
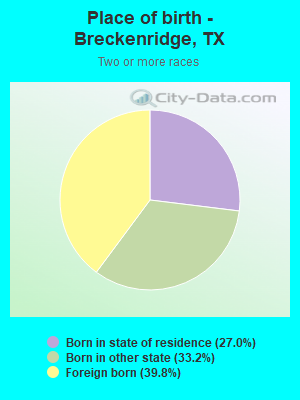
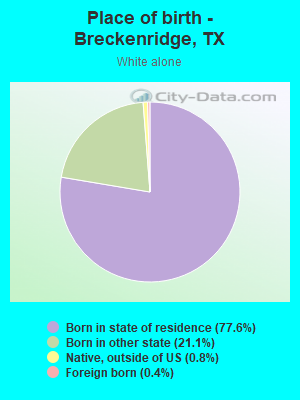
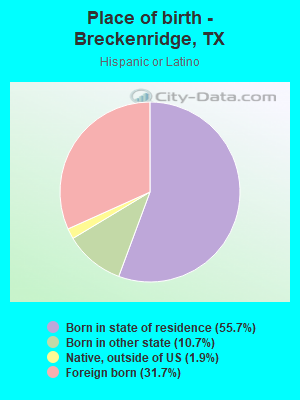
Place of birth - Born in state of residence (%)
Place of birth - Born in state of residence (%) - White
Place of birth - Born in state of residence (%) - Black or African American
Place of birth - Born in state of residence (%) - Asian
Place of birth - Born in state of residence (%) - Hispanic or Latino
Place of birth - Born in state of residence (%) - American Indian and Alaska Native
Place of birth - Born in state of residence (%) - Multirace
Place of birth - Born in state of residence (%) - Other Race
Place of birth - Born in other state (%)
Place of birth - Born in other state (%) - White
Place of birth - Born in other state (%) - Black or African American
Place of birth - Born in other state (%) - Asian
Place of birth - Born in other state (%) - Hispanic or Latino
Place of birth - Born in other state (%) - American Indian and Alaska Native
Place of birth - Born in other state (%) - Multirace
Place of birth - Born in other state (%) - Other Race
Place of birth - Native, outside of US (%)
Place of birth - Native, outside of US (%) - White
Place of birth - Native, outside of US (%) - Black or African American
Place of birth - Native, outside of US (%) - Asian
Place of birth - Native, outside of US (%) - Hispanic or Latino
Place of birth - Native, outside of US (%) - American Indian and Alaska Native
Place of birth - Native, outside of US (%) - Multirace
Place of birth - Native, outside of US (%) - Other Race
Place of birth - Foreign born (%)
Place of birth - Foreign born (%) - White
Place of birth - Foreign born (%) - Black or African American
Place of birth - Foreign born (%) - Asian
Place of birth - Foreign born (%) - Hispanic or Latino
Place of birth - Foreign born (%) - American Indian and Alaska Native
Place of birth - Foreign born (%) - Multirace
Place of birth - Foreign born (%) - Other Race
Residents speaking English at home (%)
Residents speaking English at home - Born in the United States (%)
Residents speaking English at home - Native, born elsewhere (%)
Residents speaking English at home - Foreign born (%)
Residents speaking Spanish at home (%)
Residents speaking Spanish at home - Born in the United States (%)
Residents speaking Spanish at home - Native, born elsewhere (%)
Residents speaking Spanish at home - Foreign born (%)
Residents speaking other language at home (%)
Residents speaking other language at home - Born in the United States (%)
Residents speaking other language at home - Native, born elsewhere (%)
Residents speaking other language at home - Foreign born (%)
Marital status - Never married (%)
Marital status - Now married (%)
Marital status - Separated (%)
Marital status - Widowed (%)
Marital status - Divorced (%)
Ancestries Reported - Arab (%)
Ancestries Reported - Czech (%)
Ancestries Reported - Danish (%)
Ancestries Reported - Dutch (%)
Ancestries Reported - English (%)
Ancestries Reported - French (%)
Ancestries Reported - French Canadian (%)
Ancestries Reported - German (%)
Ancestries Reported - Greek (%)
Ancestries Reported - Hungarian (%)
Ancestries Reported - Irish (%)
Ancestries Reported - Italian (%)
Ancestries Reported - Lithuanian (%)
Ancestries Reported - Norwegian (%)
Ancestries Reported - Polish (%)
Ancestries Reported - Portuguese (%)
Ancestries Reported - Russian (%)
Ancestries Reported - Scotch-Irish (%)
Ancestries Reported - Scottish (%)
Ancestries Reported - Slovak (%)
Ancestries Reported - Subsaharan African (%)
Ancestries Reported - Swedish (%)
Ancestries Reported - Swiss (%)
Ancestries Reported - Ukrainian (%)
Ancestries Reported - United States (%)
Ancestries Reported - Welsh (%)
Ancestries Reported - West Indian (%)
Ancestries Reported - Other (%)
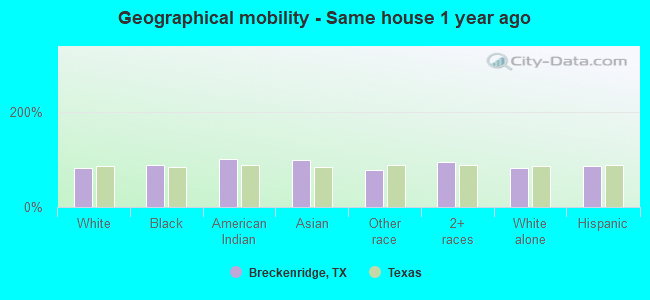
Geographical mobility - Same house 1 year ago (%)
Geographical mobility - Same house 1 year ago (%) - White
Geographical mobility - Same house 1 year ago (%) - Black or African American
Geographical mobility - Same house 1 year ago (%) - Asian
Geographical mobility - Same house 1 year ago (%) - Hispanic or Latino
Geographical mobility - Same house 1 year ago (%) - American Indian and Alaska Native
Geographical mobility - Same house 1 year ago (%) - Multirace
Geographical mobility - Same house 1 year ago (%) - Other Race
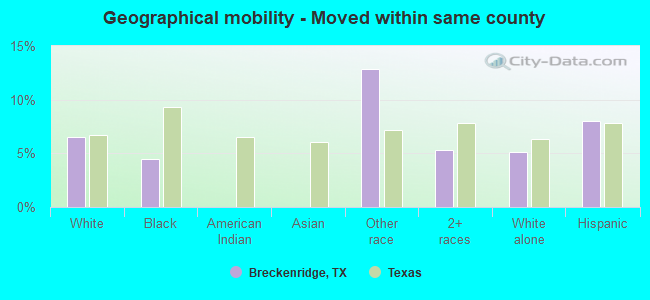
Geographical mobility - Moved within same county (%)
Geographical mobility - Moved within same county (%) - White
Geographical mobility - Moved within same county (%) - Black or African American
Geographical mobility - Moved within same county (%) - Asian
Geographical mobility - Moved within same county (%) - Hispanic or Latino
Geographical mobility - Moved within same county (%) - American Indian and Alaska Native
Geographical mobility - Moved within same county (%) - Multirace
Geographical mobility - Moved within same county (%) - Other Race
Geographical mobility - Moved from different county within same state (%)
Geographical mobility - Moved from different county within same state (%) - White
Geographical mobility - Moved from different county within same state (%) - Black or African American
Geographical mobility - Moved from different county within same state (%) - Asian
Geographical mobility - Moved from different county within same state (%) - Hispanic or Latino
Geographical mobility - Moved from different county within same state (%) - American Indian and Alaska Native
Geographical mobility - Moved from different county within same state (%) - Multirace
Geographical mobility - Moved from different county within same state (%) - Other Race
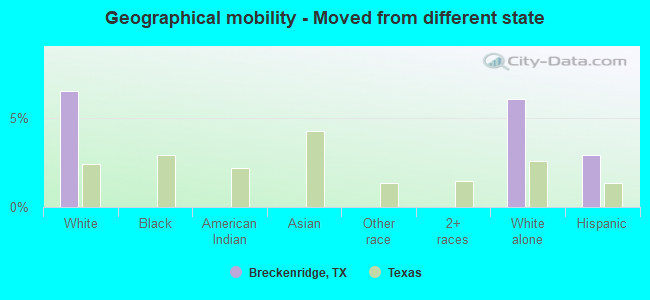
Geographical mobility - Moved from different state (%)
Geographical mobility - Moved from different state (%) - White
Geographical mobility - Moved from different state (%) - Black or African American
Geographical mobility - Moved from different state (%) - Asian
Geographical mobility - Moved from different state (%) - Hispanic or Latino
Geographical mobility - Moved from different state (%) - American Indian and Alaska Native
Geographical mobility - Moved from different state (%) - Multirace
Geographical mobility - Moved from different state (%) - Other Race
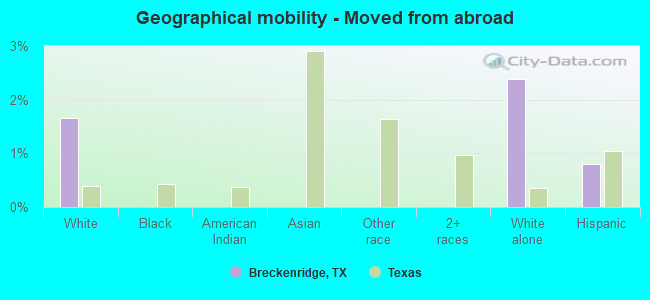
Geographical mobility - Moved from abroad (%)
Geographical mobility - Moved from abroad (%) - White
Geographical mobility - Moved from abroad (%) - Black or African American
Geographical mobility - Moved from abroad (%) - Asian
Geographical mobility - Moved from abroad (%) - Hispanic or Latino
Geographical mobility - Moved from abroad (%) - American Indian and Alaska Native
Geographical mobility - Moved from abroad (%) - Multirace
Geographical mobility - Moved from abroad (%) - Other Race
Place of birth for the foreign-born population - Ireland (%)
Place of birth for the foreign-born population - Denmark (%)
Place of birth for the foreign-born population - Norway (%)
Place of birth for the foreign-born population - Sweden (%)
Place of birth for the foreign-born population - United Kingdom (%)
Place of birth for the foreign-born population - England (%)
Place of birth for the foreign-born population - Scotland (%)
Place of birth for the foreign-born population - Other Northern Europe (%)
Place of birth for the foreign-born population - Austria (%)
Place of birth for the foreign-born population - Belgium (%)
Place of birth for the foreign-born population - France (%)
Place of birth for the foreign-born population - Germany (%)
Place of birth for the foreign-born population - Netherlands (%)
Place of birth for the foreign-born population - Switzerland (%)
Place of birth for the foreign-born population - Other Western Europe (%)
Place of birth for the foreign-born population - Greece (%)
Place of birth for the foreign-born population - Italy (%)
Place of birth for the foreign-born population - Portugal (%)
Place of birth for the foreign-born population - Spain (%)
Place of birth for the foreign-born population - Other Southern Europe (%)
Place of birth for the foreign-born population - Albania (%)
Place of birth for the foreign-born population - Belarus (%)
Place of birth for the foreign-born population - Bosnia and Herzegovina (%)
Place of birth for the foreign-born population - Bulgaria (%)
Place of birth for the foreign-born population - Croatia (%)
Place of birth for the foreign-born population - Czechoslovakia (%)
Place of birth for the foreign-born population - Hungary (%)
Place of birth for the foreign-born population - Latvia (%)
Place of birth for the foreign-born population - Lithuania (%)
Place of birth for the foreign-born population - North Macedonia (Macedonia) (%)
Place of birth for the foreign-born population - Moldova (%)
Place of birth for the foreign-born population - Poland (%)
Place of birth for the foreign-born population - Romania (%)
Place of birth for the foreign-born population - Russia (%)
Place of birth for the foreign-born population - Serbia (%)
Place of birth for the foreign-born population - Ukraine (%)
Place of birth for the foreign-born population - Other Eastern Europe (%)
Place of birth for the foreign-born population - China (%)
Place of birth for the foreign-born population - Hong Kong (%)
Place of birth for the foreign-born population - Taiwan (%)
Place of birth for the foreign-born population - Japan (%)
Place of birth for the foreign-born population - Korea (%)
Place of birth for the foreign-born population - Other Eastern Asia (%)
Place of birth for the foreign-born population - Afghanistan (%)
Place of birth for the foreign-born population - Bangladesh (%)
Place of birth for the foreign-born population - India (%)
Place of birth for the foreign-born population - Iran (%)
Place of birth for the foreign-born population - Kazakhstan (%)
Place of birth for the foreign-born population - Nepal (%)
Place of birth for the foreign-born population - Pakistan (%)
Place of birth for the foreign-born population - Sri Lanka (%)
Place of birth for the foreign-born population - Uzbekistan (%)
Place of birth for the foreign-born population - Other South Central Asia (%)
Place of birth for the foreign-born population - Burma (%)
Place of birth for the foreign-born population - Cambodia (%)
Place of birth for the foreign-born population - Indonesia (%)
Place of birth for the foreign-born population - Laos (%)
Place of birth for the foreign-born population - Malaysia (%)
Place of birth for the foreign-born population - Philippines (%)
Place of birth for the foreign-born population - Singapore (%)
Place of birth for the foreign-born population - Thailand (%)
Place of birth for the foreign-born population - Vietnam (%)
Place of birth for the foreign-born population - Other South Eastern Asia (%)
Place of birth for the foreign-born population - Armenia (%)
Place of birth for the foreign-born population - Iraq (%)
Place of birth for the foreign-born population - Israel (%)
Place of birth for the foreign-born population - Jordan (%)
Place of birth for the foreign-born population - Kuwait (%)
Place of birth for the foreign-born population - Lebanon (%)
Place of birth for the foreign-born population - Saudi Arabia (%)
Place of birth for the foreign-born population - Syria (%)
Place of birth for the foreign-born population - Turkey (%)
Place of birth for the foreign-born population - Yemen (%)
Place of birth for the foreign-born population - Other Western Asia (%)
Place of birth for the foreign-born population - Eritrea (%)
Place of birth for the foreign-born population - Ethiopia (%)
Place of birth for the foreign-born population - Kenya (%)
Place of birth for the foreign-born population - Somalia (%)
Place of birth for the foreign-born population - Uganda (%)
Place of birth for the foreign-born population - Zimbabwe (%)
Place of birth for the foreign-born population - Other Eastern Africa (%)
Place of birth for the foreign-born population - Cameroon (%)
Place of birth for the foreign-born population - Congo (%)
Place of birth for the foreign-born population - Democratic Republic of Congo (Zaire) (%)
Place of birth for the foreign-born population - Other Middle Africa (%)
Place of birth for the foreign-born population - Egypt (%)
Place of birth for the foreign-born population - Morocco (%)
Place of birth for the foreign-born population - Sudan (%)
Place of birth for the foreign-born population - Other Northern Africa (%)
Place of birth for the foreign-born population - South Africa (%)
Place of birth for the foreign-born population - Other Southern Africa (%)
Place of birth for the foreign-born population - Cabo Verde (%)
Place of birth for the foreign-born population - Ghana (%)
Place of birth for the foreign-born population - Liberia (%)
Place of birth for the foreign-born population - Nigeria (%)
Place of birth for the foreign-born population - Senegal (%)
Place of birth for the foreign-born population - Sierra Leone (%)
Place of birth for the foreign-born population - Other Western Africa (%)
Place of birth for the foreign-born population - Australia (%)
Place of birth for the foreign-born population - New Zealand (%)
Place of birth for the foreign-born population - Fiji (%)
Place of birth for the foreign-born population - Micronesia (%)
Place of birth for the foreign-born population - Bahamas (%)
Place of birth for the foreign-born population - Barbados (%)
Place of birth for the foreign-born population - Cuba (%)
Place of birth for the foreign-born population - Dominica (%)
Place of birth for the foreign-born population - Dominican Republic (%)
Place of birth for the foreign-born population - Grenada (%)
Place of birth for the foreign-born population - Haiti (%)
Place of birth for the foreign-born population - Jamaica (%)
Place of birth for the foreign-born population - St. Vincent and the Grenadines (%)
Place of birth for the foreign-born population - Trinidad and Tobago (%)
Place of birth for the foreign-born population - West Indies (%)
Place of birth for the foreign-born population - Other Caribbean (%)
Place of birth for the foreign-born population - Belize (%)
Place of birth for the foreign-born population - Costa Rica (%)
Place of birth for the foreign-born population - El Salvador (%)
Place of birth for the foreign-born population - Guatemala (%)
Place of birth for the foreign-born population - Honduras (%)
Place of birth for the foreign-born population - Mexico (%)
Place of birth for the foreign-born population - Nicaragua (%)
Place of birth for the foreign-born population - Panama (%)
Place of birth for the foreign-born population - Other Central America (%)
Place of birth for the foreign-born population - Argentina (%)
Place of birth for the foreign-born population - Bolivia (%)
Place of birth for the foreign-born population - Brazil (%)
Place of birth for the foreign-born population - Chile (%)
Place of birth for the foreign-born population - Colombia (%)
Place of birth for the foreign-born population - Ecuador (%)
Place of birth for the foreign-born population - Guyana (%)
Place of birth for the foreign-born population - Peru (%)
Place of birth for the foreign-born population - Uruguay (%)
Place of birth for the foreign-born population - Venezuela (%)
Place of birth for the foreign-born population - Other South America (%)
Place of birth for the foreign-born population - Canada (%)
Place of birth for the foreign-born population - Other Northern America (%)
Place of birth for the foreign-born population - Other (%)
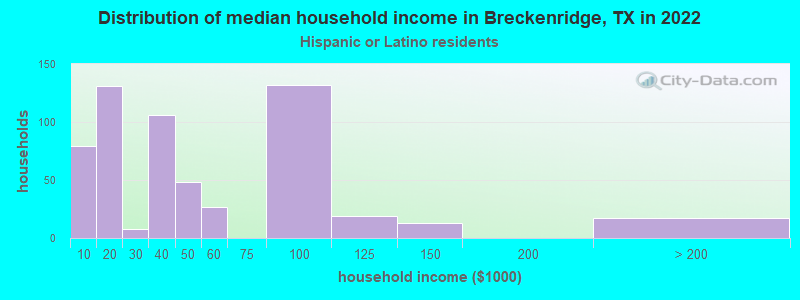
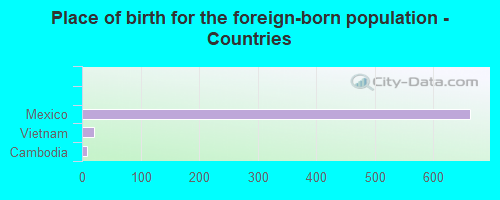
According to 2022 data, the most numerous races in Breckenridge, TX are Hispanic (2,074 residents), White alone (2,813 residents), and Black alone (178 residents). 73.7% of Breckenridge residents speak English at home. 13.1% of Breckenridge, TX residents are foreign-born (12.2% born in Latin America), which is 29.9% less than the foreign-born rate of 17.0% across the entire state of Texas.
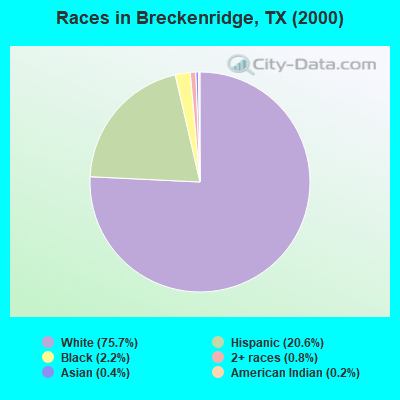
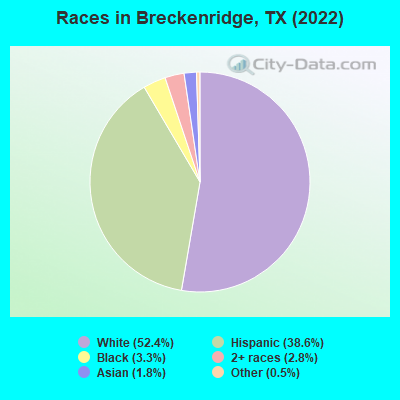
Race distribution in Breckenridge
2000 2022
10,933,313 52.4% White alone 6,669,666 32.0% Hispanic 2,364,255 11.3% Black alone 554,445 2.7% Asian alone 230,567 1.1% Two or more races 68,859 0.3% American Indian alone 19,958 0.10% Other race alone 10,757 0.05% Native Hawaiian and Other
12,070,642 40.2% Hispanic 11,683,430 38.9% White alone 3,508,706 11.7% Black alone 1,608,173 5.4% Asian alone 956,560 3.2% Two or more races 125,763 0.4% Other race alone 47,023 0.2% American Indian alone 29,275 0.10% Native Hawaiian and Other
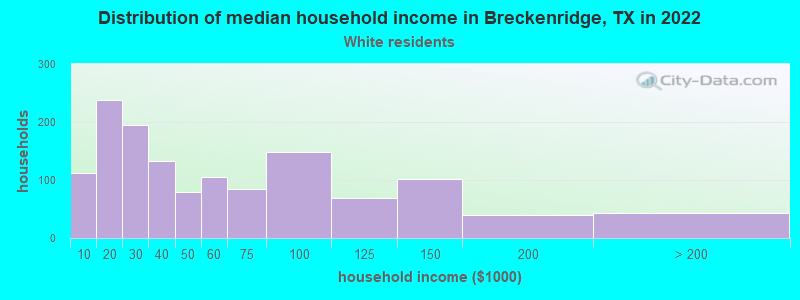
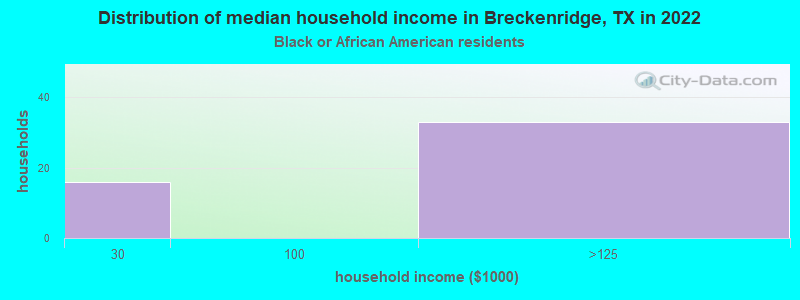
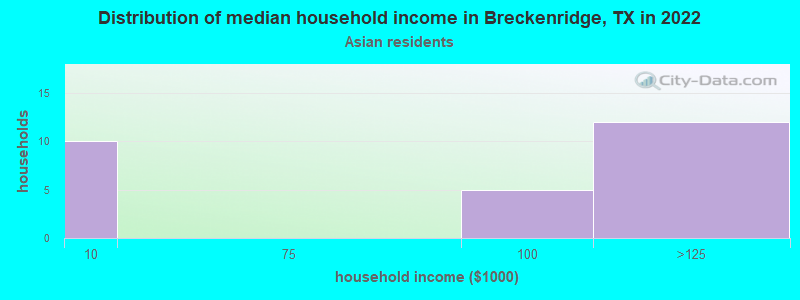
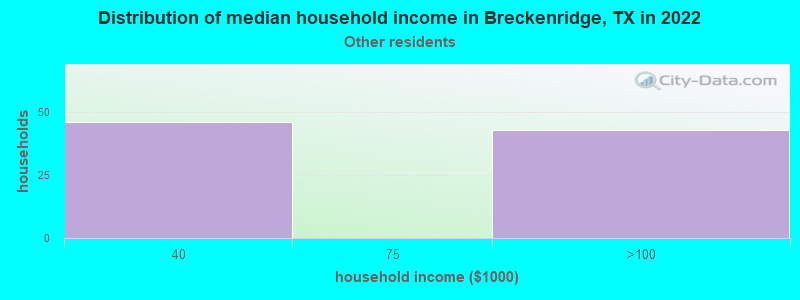
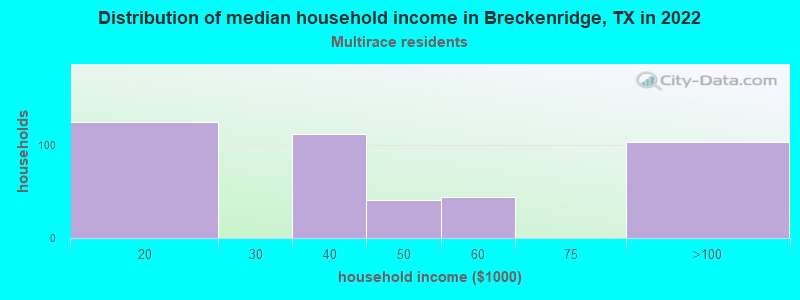
Income and house value in Breckenridge Median household income in 2022 $38,150 White non-Hispanic householders$35,907 Two or more races householders$36,422 Hispanic or Latino race householdersMedian 2022 house value $108,897 White Non-Hispanic householders$25,500 Black or African American householders $257,835 Asian householders$43,610 Some other race householders$98,951 Two or more races householders$49,985 Hispanic or Latino householders
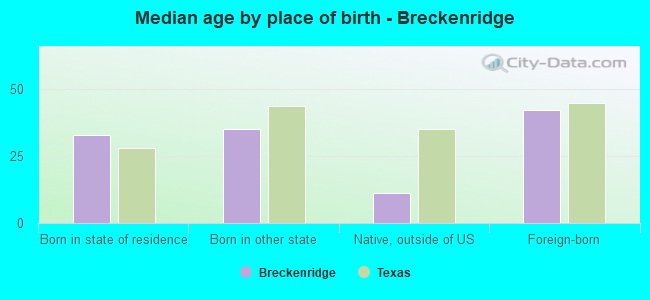
Median age by race in Breckenridge
38.3 Median age for White residents33.8 45.5 39.4 Median age for Black or African American residents30.5 64.0 41.7 Median age for American Indian / Alaska Native residents-682,445,758.7 -684,418,145.3 22.1 Median age for Asian residents4.6 29.9 -581,560,283.1 Median age for Native Hawaiian / Pacific Islander residents-612,729,233.5 -577,777,777.2 24.8 Median age for Other race residents42.5 23.4 31.8 Median age for Two or more races residents32.1 31.6 42.5 Median age for White alone residents36.5 44.9 29.5 Median age for Hispanic or Latino residents30.8 29.0
Owner/renter occupied households by race in Breckenridge
House owners and renters - White residents 934 67.7% Owner occupied446 32.3% Renter occupiedHouse owners and renters - Black or African American residents 51 100.0% Owner occupiedHouse owners and renters - American Indian / Alaska Native residents 44 100.0% Owner occupiedHouse owners and renters - Asian residents 27 100.0% Owner occupiedHouse owners and renters - Other race residents 43 50.1% Owner occupied42 49.9% Renter occupiedHouse owners and renters - Two or more races residents 291 69.0% Owner occupied131 31.0% Renter occupiedHouse owners and renters - White alone residents 824 61.8% Owner occupied510 38.2% Renter occupiedHouse owners and renters - Hispanic or Latino residents 445 76.2% Owner occupied139 23.8% Renter occupied
Language usage in Breckenridge
English speakers - Total 73.7% of residents of Breckenridge speak English at home.
25.1% of residents speak Spanish at home 504 40.7% Speak English very well735 59.3% Speak English less than very well0.9% of residents speak other language at home 15 34.9% Speak English very well28 65.1% Speak English less than very well
English speakers - Born in the United States 80.1% of residents of Breckenridge speak English at home.
19.0% of residents speak Spanish at home 32 17.8% Speak English very well148 82.2% Speak English less than very well
English speakers - Native, born elsewhere 63.2% of residents of Breckenridge speak English at home.
34.2% of residents speak Spanish at home 13 100.0% Speak English less than very well
English speakers - Foreign-born 7.7% of residents of Breckenridge speak English at home.
87.1% of residents speak Spanish at home 112 18.3% Speak English very well500 81.7% Speak English less than very well4.0% of residents speak other language at home 8 28.6% Speak English very well20 71.4% Speak English less than very well
White (Caucasian) - Speak only English Native:
99.5% (2,888)Foreign-born:
18.7% (28)
White (Caucasian) - Speak another language Native:
5.0% (144)Foreign-born:
79.0% (117)
American Indian / Alaska Native - Speak another language Native:
100.0% (57)Foreign-born:
98.9% (54)
Other race - Speak only English Native:
47.4% (110)Foreign-born:
41.6% (25)
Other race - Speak another language Native:
53.4% (124)Foreign-born:
61.4% (37)
Two or more races - Speak another language Native:
51.1% (321)Foreign-born:
100.0% (430)
White alone - Speak only English Native:
97.5% (2,547)Foreign-born:
100.0% (12)
Hispanic or Latino - Speak only English Native:
56.0% (692)Foreign-born:
6.8% (45)
Hispanic or Latino - Speak another language Native:
44.4% (548)Foreign-born:
93.3% (616)
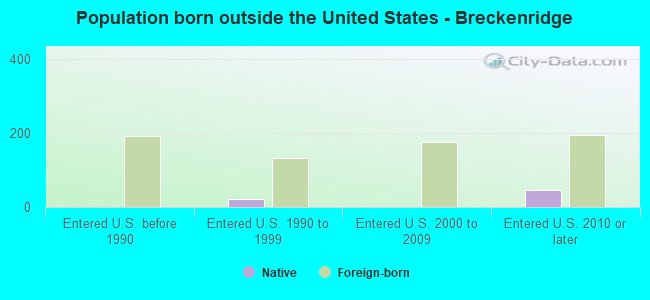
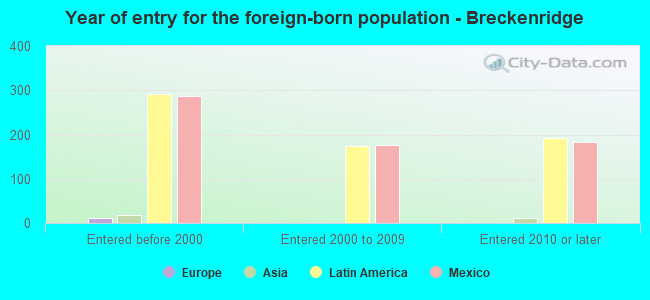
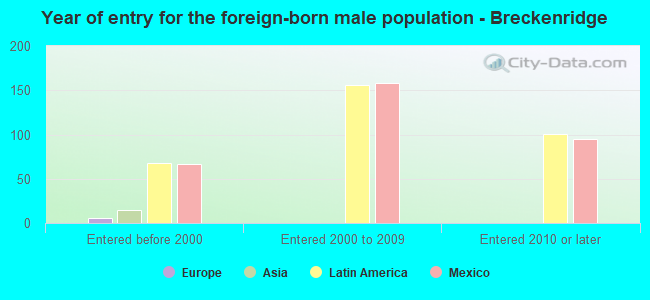
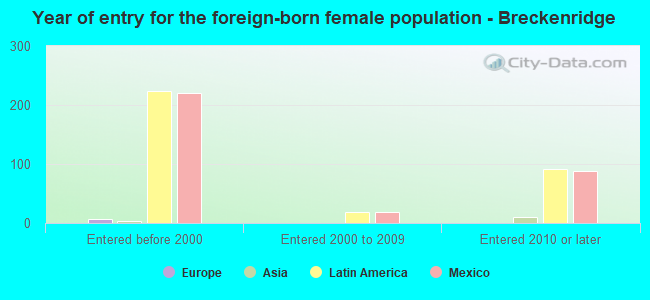
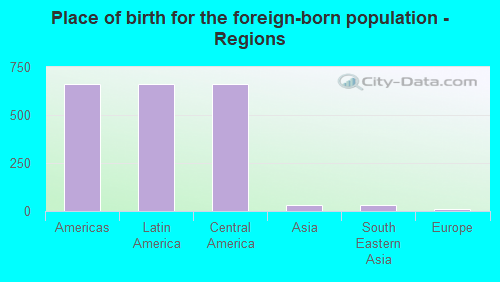
Foreign-born residents in Breckenridge 703 residents are foreign born (12.2% Latin America ).
This city:
13.1%Texas:
17.1%
Marital status for residents in Breckenridge Marital status - White (Caucasian) population 15 years and over
Males 38.0% Never married35.9% Now married5.3% Separated2.5% Widowed18.4% DivorcedFemales 24.8% Never married33.2% Now married7.5% Separated25.9% Widowed8.7% DivorcedWomen who did not give birth in the past 12 months Now married:
44.6% (307)Unmarried:
55.4% (381)
Marital status - Black or African American population 15 years and over
Males 25.0% Never married42.6% Now married25.0% Separated7.4% Widowed0.0% DivorcedFemales 0.0% Never married90.0% Now married0.0% Separated10.0% Widowed0.0% DivorcedWomen who did not give birth in the past 12 months Now married:
100.0% (27)Unmarried:
0.0% (0)
Marital status - American Indian / Alaska Native population 15 years and over
Males 0.0% Never married100.0% Now married0.0% Separated0.0% Widowed0.0% DivorcedFemales 0.0% Never married100.0% Now married0.0% Separated0.0% Widowed0.0% DivorcedWomen who did not give birth in the past 12 months Now married:
100.0% (23)Unmarried:
0.0% (0)
Marital status - Asian population 15 years and over
Males 48.1% Never married51.9% Now married0.0% Separated0.0% Widowed0.0% DivorcedFemales 39.1% Never married60.9% Now married0.0% Separated0.0% Widowed0.0% DivorcedWomen who did not give birth in the past 12 months Now married:
52.6% (11)Unmarried:
47.4% (10)
Marital status - Other race population 15 years and over
Males 25.2% Never married74.8% Now married0.0% Separated0.0% Widowed0.0% DivorcedFemales 23.6% Never married76.4% Now married0.0% Separated0.0% Widowed0.0% DivorcedWomen who gave birth in the past 12 months Now married:
100.0% (25)Unmarried:
0.0% (0)
Women who did not give birth in the past 12 months Now married:
57.1% (38)Unmarried:
42.9% (29)
Marital status - Two or more races population 15 years and over
Males 26.7% Never married63.9% Now married0.0% Separated7.3% Widowed2.1% DivorcedFemales 0.0% Never married63.7% Now married0.0% Separated16.5% Widowed19.8% DivorcedWomen who did not give birth in the past 12 months Now married:
69.8% (158)Unmarried:
30.2% (68)
Marital status - White alone, not Hispanic / Latino population 15 years and over
Males 37.4% Never married39.8% Now married3.6% Separated2.8% Widowed16.5% DivorcedFemales 27.5% Never married33.0% Now married1.8% Separated26.8% Widowed11.0% DivorcedWomen who did not give birth in the past 12 months Now married:
37.4% (222)Unmarried:
62.6% (372)
Marital status - Hispanic or Latino population 15 years and over
Males 33.0% Never married46.5% Now married5.0% Separated3.4% Widowed12.1% DivorcedFemales 11.2% Never married55.2% Now married15.6% Separated18.0% Widowed0.0% DivorcedWomen who gave birth in the past 12 months Now married:
100.0% (19)Unmarried:
0.0% (0)
Women who did not give birth in the past 12 months Now married:
71.6% (309)Unmarried:
28.4% (123)
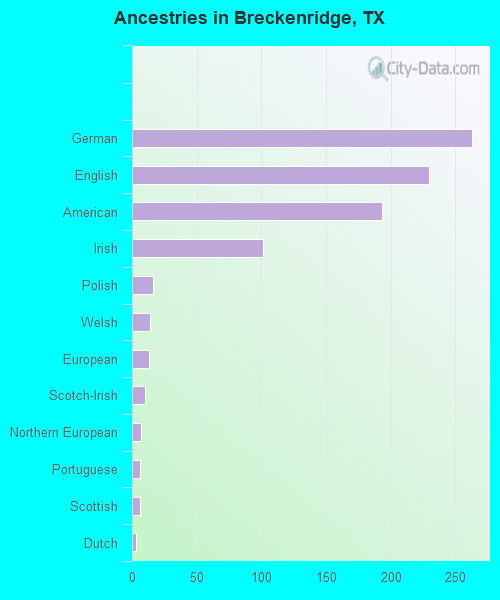
Ancestries in Breckenridge
263 10.8% German230 9.4% English193 7.9% American101 4.1% Irish16 0.7% Polish14 0.6% Welsh13 0.5% European10 0.4% Scotch-Irish7 0.3% Northern European6 0.2% Portuguese6 0.2% Scottish3 0.1% Dutch2 0.08% French
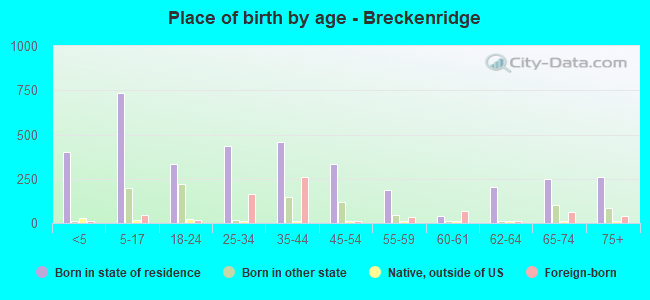
Children Nativity (place of birth) in Breckenridge
Children under 6 years - Living with two parents Both parents native 139 100.0% NativeBoth parents foreign-born 90 100.0% NativeOne native, one foreign-born parent 69 100.0% NativeChildren under 6 years - Living with one parent Native parent 213 100.0% NativeForeign-born parent 15 100.0% NativeChildren 6 to 17 years - Living with two parents Both parents native 195 99.9% Native0 0.1% Foreign-bornBoth parents foreign-born 31 100.0% Foreign-bornOne native, one foreign-born parent 25 100.0% NativeChildren 6 to 17 years - Living with one parent Native parent 335 100.0% NativeForeign-born parent 124 50.5% Native122 49.5% Foreign-born
Grandparents responsible for own grandchildren in Breckenridge
Grandparents (30 to 59 years) White / Caucasian 28 100.0% Responsible for grandchildrenOther race 17 100.0% Responsible for grandchildrenWhite alone, not Hispanic / Latino 12 100.0% Responsible for grandchildrenHispanic or Latino 42 100.0% Responsible for grandchildren
Grandparents (60 years and over) White / Caucasian 12 100.0% Responsible for grandchildrenOther race 14 100.0% Responsible for grandchildrenWhite alone, not Hispanic / Latino 14 100.0% Responsible for grandchildrenHispanic or Latino 10 100.0% Responsible for grandchildren