Races in Bridgeton, Missouri (MO) Detailed Stats
Data:
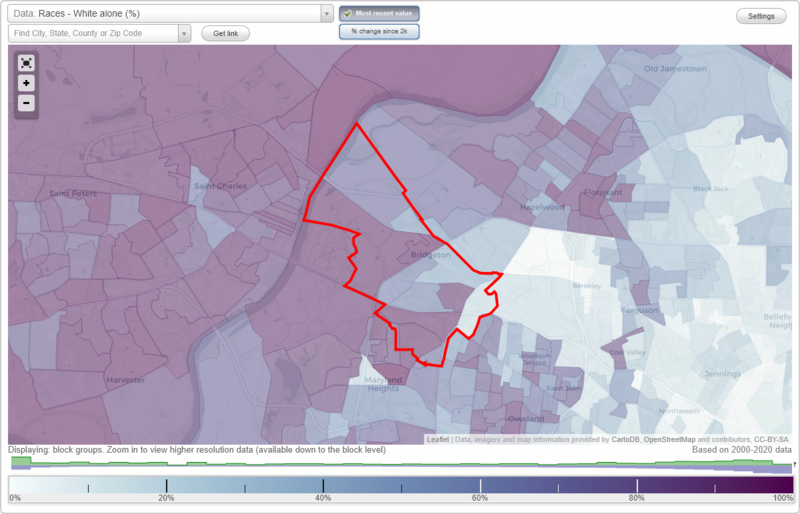
Races - White alone (%)
Races - White alone (% change since 2000)
Races - Black alone (%)
Races - Black alone (% change since 2000)
Races - American Indian alone (%)
Races - American Indian alone (% change since 2000)
Races - Asian alone (%)
Races - Asian alone (% change since 2000)
Races - Hispanic (%)
Races - Hispanic (% change since 2000)
Races - Native Hawaiian and Other Pacific Islander alone (%)
Races - Native Hawaiian and Other Pacific Islander alone (% change since 2000)
Races - Two or more races(%)
Races - Two or more races(% change since 2000)
Races - Other race alone (%)
Races - Other race alone (% change since 2000)
Racial diversity
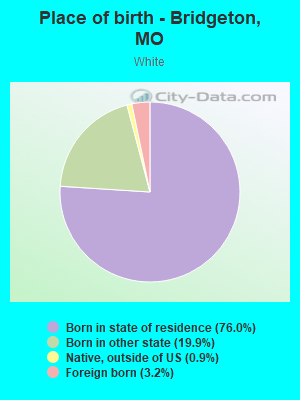
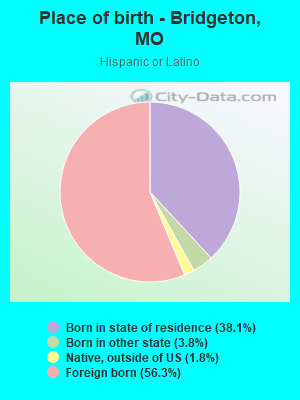
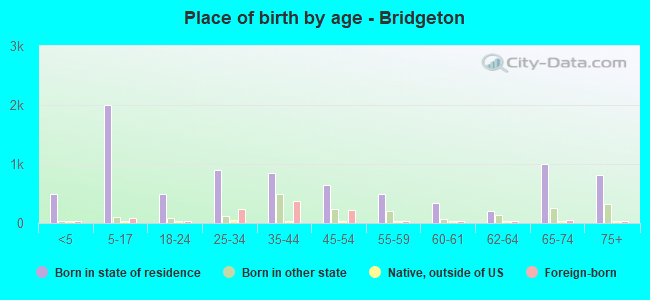
Place of birth - Born in state of residence (%)
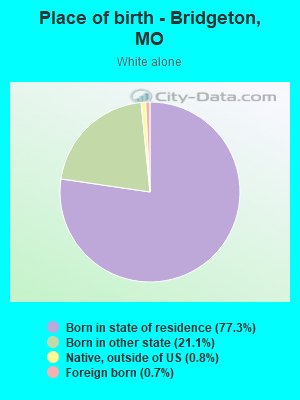
Place of birth - Born in state of residence (%) - White
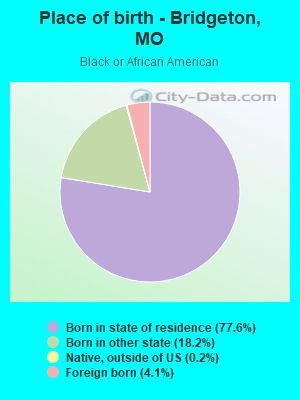
Place of birth - Born in state of residence (%) - Black or African American
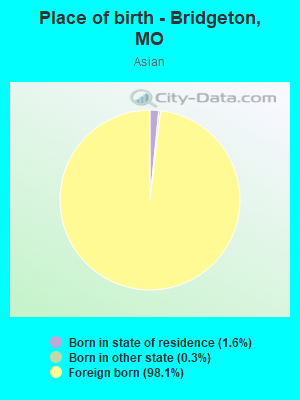
Place of birth - Born in state of residence (%) - Asian
Place of birth - Born in state of residence (%) - Hispanic or Latino
Place of birth - Born in state of residence (%) - American Indian and Alaska Native
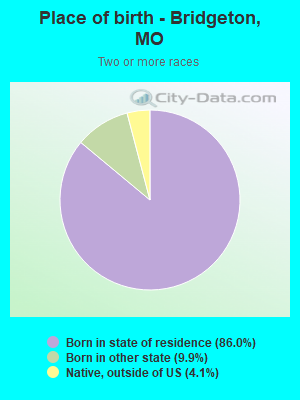
Place of birth - Born in state of residence (%) - Multirace
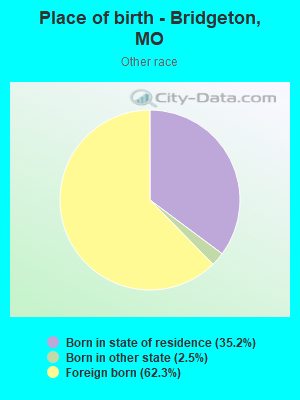
Place of birth - Born in state of residence (%) - Other Race
Place of birth - Born in other state (%)
Place of birth - Born in other state (%) - White
Place of birth - Born in other state (%) - Black or African American
Place of birth - Born in other state (%) - Asian
Place of birth - Born in other state (%) - Hispanic or Latino
Place of birth - Born in other state (%) - American Indian and Alaska Native
Place of birth - Born in other state (%) - Multirace
Place of birth - Born in other state (%) - Other Race
Place of birth - Native, outside of US (%)
Place of birth - Native, outside of US (%) - White
Place of birth - Native, outside of US (%) - Black or African American
Place of birth - Native, outside of US (%) - Asian
Place of birth - Native, outside of US (%) - Hispanic or Latino
Place of birth - Native, outside of US (%) - American Indian and Alaska Native
Place of birth - Native, outside of US (%) - Multirace
Place of birth - Native, outside of US (%) - Other Race
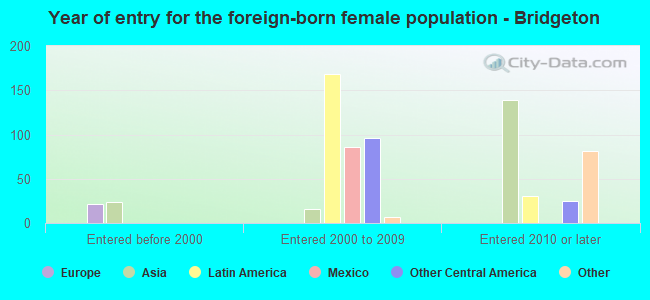
Place of birth - Foreign born (%)
Place of birth - Foreign born (%) - White
Place of birth - Foreign born (%) - Black or African American
Place of birth - Foreign born (%) - Asian
Place of birth - Foreign born (%) - Hispanic or Latino
Place of birth - Foreign born (%) - American Indian and Alaska Native
Place of birth - Foreign born (%) - Multirace
Place of birth - Foreign born (%) - Other Race
Residents speaking English at home (%)
Residents speaking English at home - Born in the United States (%)
Residents speaking English at home - Native, born elsewhere (%)
Residents speaking English at home - Foreign born (%)
Residents speaking Spanish at home (%)
Residents speaking Spanish at home - Born in the United States (%)
Residents speaking Spanish at home - Native, born elsewhere (%)
Residents speaking Spanish at home - Foreign born (%)
Residents speaking other language at home (%)
Residents speaking other language at home - Born in the United States (%)
Residents speaking other language at home - Native, born elsewhere (%)
Residents speaking other language at home - Foreign born (%)
Marital status - Never married (%)
Marital status - Now married (%)
Marital status - Separated (%)
Marital status - Widowed (%)
Marital status - Divorced (%)
Ancestries Reported - Arab (%)
Ancestries Reported - Czech (%)
Ancestries Reported - Danish (%)
Ancestries Reported - Dutch (%)
Ancestries Reported - English (%)
Ancestries Reported - French (%)
Ancestries Reported - French Canadian (%)
Ancestries Reported - German (%)
Ancestries Reported - Greek (%)
Ancestries Reported - Hungarian (%)
Ancestries Reported - Irish (%)
Ancestries Reported - Italian (%)
Ancestries Reported - Lithuanian (%)
Ancestries Reported - Norwegian (%)
Ancestries Reported - Polish (%)
Ancestries Reported - Portuguese (%)
Ancestries Reported - Russian (%)
Ancestries Reported - Scotch-Irish (%)
Ancestries Reported - Scottish (%)
Ancestries Reported - Slovak (%)
Ancestries Reported - Subsaharan African (%)
Ancestries Reported - Swedish (%)
Ancestries Reported - Swiss (%)
Ancestries Reported - Ukrainian (%)
Ancestries Reported - United States (%)
Ancestries Reported - Welsh (%)
Ancestries Reported - West Indian (%)
Ancestries Reported - Other (%)
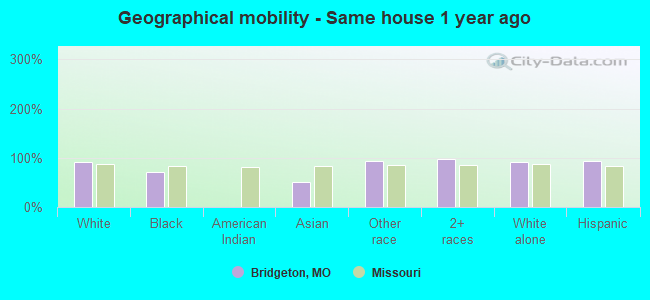
Geographical mobility - Same house 1 year ago (%)
Geographical mobility - Same house 1 year ago (%) - White
Geographical mobility - Same house 1 year ago (%) - Black or African American
Geographical mobility - Same house 1 year ago (%) - Asian
Geographical mobility - Same house 1 year ago (%) - Hispanic or Latino
Geographical mobility - Same house 1 year ago (%) - American Indian and Alaska Native
Geographical mobility - Same house 1 year ago (%) - Multirace
Geographical mobility - Same house 1 year ago (%) - Other Race
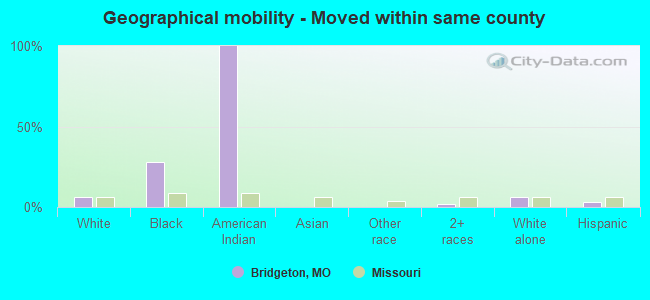
Geographical mobility - Moved within same county (%)
Geographical mobility - Moved within same county (%) - White
Geographical mobility - Moved within same county (%) - Black or African American
Geographical mobility - Moved within same county (%) - Asian
Geographical mobility - Moved within same county (%) - Hispanic or Latino
Geographical mobility - Moved within same county (%) - American Indian and Alaska Native
Geographical mobility - Moved within same county (%) - Multirace
Geographical mobility - Moved within same county (%) - Other Race
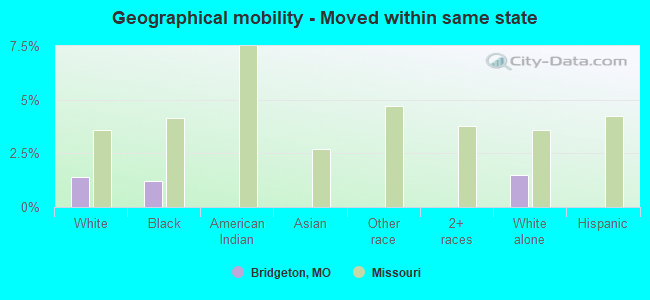
Geographical mobility - Moved from different county within same state (%)
Geographical mobility - Moved from different county within same state (%) - White
Geographical mobility - Moved from different county within same state (%) - Black or African American
Geographical mobility - Moved from different county within same state (%) - Asian
Geographical mobility - Moved from different county within same state (%) - Hispanic or Latino
Geographical mobility - Moved from different county within same state (%) - American Indian and Alaska Native
Geographical mobility - Moved from different county within same state (%) - Multirace
Geographical mobility - Moved from different county within same state (%) - Other Race
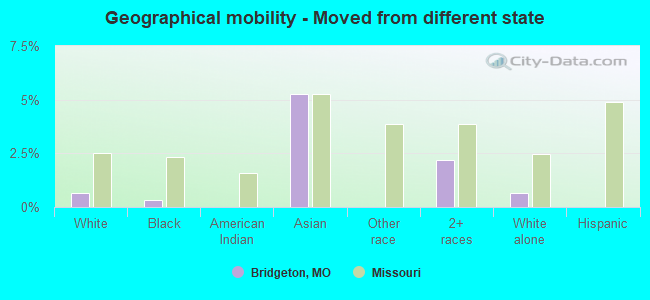
Geographical mobility - Moved from different state (%)
Geographical mobility - Moved from different state (%) - White
Geographical mobility - Moved from different state (%) - Black or African American
Geographical mobility - Moved from different state (%) - Asian
Geographical mobility - Moved from different state (%) - Hispanic or Latino
Geographical mobility - Moved from different state (%) - American Indian and Alaska Native
Geographical mobility - Moved from different state (%) - Multirace
Geographical mobility - Moved from different state (%) - Other Race
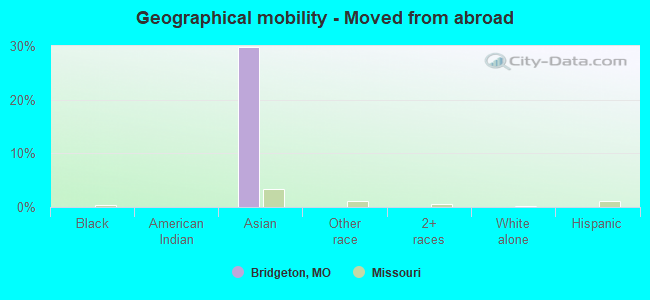
Geographical mobility - Moved from abroad (%)
Geographical mobility - Moved from abroad (%) - White
Geographical mobility - Moved from abroad (%) - Black or African American
Geographical mobility - Moved from abroad (%) - Asian
Geographical mobility - Moved from abroad (%) - Hispanic or Latino
Geographical mobility - Moved from abroad (%) - American Indian and Alaska Native
Geographical mobility - Moved from abroad (%) - Multirace
Geographical mobility - Moved from abroad (%) - Other Race
Place of birth for the foreign-born population - Ireland (%)
Place of birth for the foreign-born population - Denmark (%)
Place of birth for the foreign-born population - Norway (%)
Place of birth for the foreign-born population - Sweden (%)
Place of birth for the foreign-born population - United Kingdom (%)
Place of birth for the foreign-born population - England (%)
Place of birth for the foreign-born population - Scotland (%)
Place of birth for the foreign-born population - Other Northern Europe (%)
Place of birth for the foreign-born population - Austria (%)
Place of birth for the foreign-born population - Belgium (%)
Place of birth for the foreign-born population - France (%)
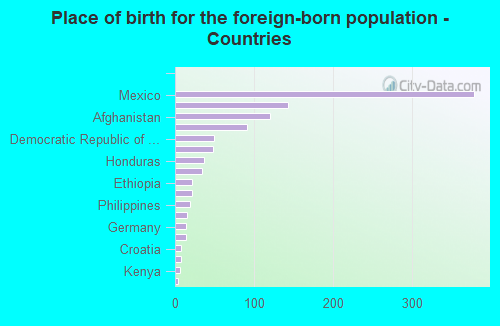
Place of birth for the foreign-born population - Germany (%)
Place of birth for the foreign-born population - Netherlands (%)
Place of birth for the foreign-born population - Switzerland (%)
Place of birth for the foreign-born population - Other Western Europe (%)
Place of birth for the foreign-born population - Greece (%)
Place of birth for the foreign-born population - Italy (%)
Place of birth for the foreign-born population - Portugal (%)
Place of birth for the foreign-born population - Spain (%)
Place of birth for the foreign-born population - Other Southern Europe (%)
Place of birth for the foreign-born population - Albania (%)
Place of birth for the foreign-born population - Belarus (%)
Place of birth for the foreign-born population - Bosnia and Herzegovina (%)
Place of birth for the foreign-born population - Bulgaria (%)
Place of birth for the foreign-born population - Croatia (%)
Place of birth for the foreign-born population - Czechoslovakia (%)
Place of birth for the foreign-born population - Hungary (%)
Place of birth for the foreign-born population - Latvia (%)
Place of birth for the foreign-born population - Lithuania (%)
Place of birth for the foreign-born population - North Macedonia (Macedonia) (%)
Place of birth for the foreign-born population - Moldova (%)
Place of birth for the foreign-born population - Poland (%)
Place of birth for the foreign-born population - Romania (%)
Place of birth for the foreign-born population - Russia (%)
Place of birth for the foreign-born population - Serbia (%)
Place of birth for the foreign-born population - Ukraine (%)
Place of birth for the foreign-born population - Other Eastern Europe (%)
Place of birth for the foreign-born population - China (%)
Place of birth for the foreign-born population - Hong Kong (%)
Place of birth for the foreign-born population - Taiwan (%)
Place of birth for the foreign-born population - Japan (%)
Place of birth for the foreign-born population - Korea (%)
Place of birth for the foreign-born population - Other Eastern Asia (%)
Place of birth for the foreign-born population - Afghanistan (%)
Place of birth for the foreign-born population - Bangladesh (%)
Place of birth for the foreign-born population - India (%)
Place of birth for the foreign-born population - Iran (%)
Place of birth for the foreign-born population - Kazakhstan (%)
Place of birth for the foreign-born population - Nepal (%)
Place of birth for the foreign-born population - Pakistan (%)
Place of birth for the foreign-born population - Sri Lanka (%)
Place of birth for the foreign-born population - Uzbekistan (%)
Place of birth for the foreign-born population - Other South Central Asia (%)
Place of birth for the foreign-born population - Burma (%)
Place of birth for the foreign-born population - Cambodia (%)
Place of birth for the foreign-born population - Indonesia (%)
Place of birth for the foreign-born population - Laos (%)
Place of birth for the foreign-born population - Malaysia (%)
Place of birth for the foreign-born population - Philippines (%)
Place of birth for the foreign-born population - Singapore (%)
Place of birth for the foreign-born population - Thailand (%)
Place of birth for the foreign-born population - Vietnam (%)
Place of birth for the foreign-born population - Other South Eastern Asia (%)
Place of birth for the foreign-born population - Armenia (%)
Place of birth for the foreign-born population - Iraq (%)
Place of birth for the foreign-born population - Israel (%)
Place of birth for the foreign-born population - Jordan (%)
Place of birth for the foreign-born population - Kuwait (%)
Place of birth for the foreign-born population - Lebanon (%)
Place of birth for the foreign-born population - Saudi Arabia (%)
Place of birth for the foreign-born population - Syria (%)
Place of birth for the foreign-born population - Turkey (%)
Place of birth for the foreign-born population - Yemen (%)
Place of birth for the foreign-born population - Other Western Asia (%)
Place of birth for the foreign-born population - Eritrea (%)
Place of birth for the foreign-born population - Ethiopia (%)
Place of birth for the foreign-born population - Kenya (%)
Place of birth for the foreign-born population - Somalia (%)
Place of birth for the foreign-born population - Uganda (%)
Place of birth for the foreign-born population - Zimbabwe (%)
Place of birth for the foreign-born population - Other Eastern Africa (%)
Place of birth for the foreign-born population - Cameroon (%)
Place of birth for the foreign-born population - Congo (%)
Place of birth for the foreign-born population - Democratic Republic of Congo (Zaire) (%)
Place of birth for the foreign-born population - Other Middle Africa (%)
Place of birth for the foreign-born population - Egypt (%)
Place of birth for the foreign-born population - Morocco (%)
Place of birth for the foreign-born population - Sudan (%)
Place of birth for the foreign-born population - Other Northern Africa (%)
Place of birth for the foreign-born population - South Africa (%)
Place of birth for the foreign-born population - Other Southern Africa (%)
Place of birth for the foreign-born population - Cabo Verde (%)
Place of birth for the foreign-born population - Ghana (%)
Place of birth for the foreign-born population - Liberia (%)
Place of birth for the foreign-born population - Nigeria (%)
Place of birth for the foreign-born population - Senegal (%)
Place of birth for the foreign-born population - Sierra Leone (%)
Place of birth for the foreign-born population - Other Western Africa (%)
Place of birth for the foreign-born population - Australia (%)
Place of birth for the foreign-born population - New Zealand (%)
Place of birth for the foreign-born population - Fiji (%)
Place of birth for the foreign-born population - Micronesia (%)
Place of birth for the foreign-born population - Bahamas (%)
Place of birth for the foreign-born population - Barbados (%)
Place of birth for the foreign-born population - Cuba (%)
Place of birth for the foreign-born population - Dominica (%)
Place of birth for the foreign-born population - Dominican Republic (%)
Place of birth for the foreign-born population - Grenada (%)
Place of birth for the foreign-born population - Haiti (%)
Place of birth for the foreign-born population - Jamaica (%)
Place of birth for the foreign-born population - St. Vincent and the Grenadines (%)
Place of birth for the foreign-born population - Trinidad and Tobago (%)
Place of birth for the foreign-born population - West Indies (%)
Place of birth for the foreign-born population - Other Caribbean (%)
Place of birth for the foreign-born population - Belize (%)
Place of birth for the foreign-born population - Costa Rica (%)
Place of birth for the foreign-born population - El Salvador (%)
Place of birth for the foreign-born population - Guatemala (%)
Place of birth for the foreign-born population - Honduras (%)
Place of birth for the foreign-born population - Mexico (%)
Place of birth for the foreign-born population - Nicaragua (%)
Place of birth for the foreign-born population - Panama (%)
Place of birth for the foreign-born population - Other Central America (%)
Place of birth for the foreign-born population - Argentina (%)
Place of birth for the foreign-born population - Bolivia (%)
Place of birth for the foreign-born population - Brazil (%)
Place of birth for the foreign-born population - Chile (%)
Place of birth for the foreign-born population - Colombia (%)
Place of birth for the foreign-born population - Ecuador (%)
Place of birth for the foreign-born population - Guyana (%)
Place of birth for the foreign-born population - Peru (%)
Place of birth for the foreign-born population - Uruguay (%)
Place of birth for the foreign-born population - Venezuela (%)
Place of birth for the foreign-born population - Other South America (%)
Place of birth for the foreign-born population - Canada (%)
Place of birth for the foreign-born population - Other Northern America (%)
Place of birth for the foreign-born population - Other (%)
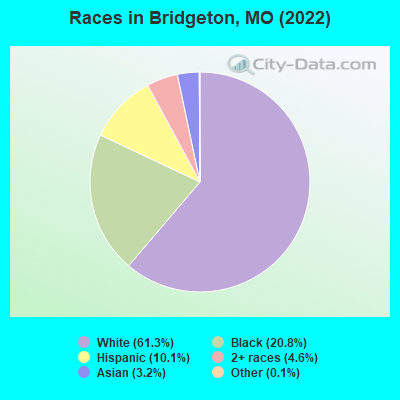
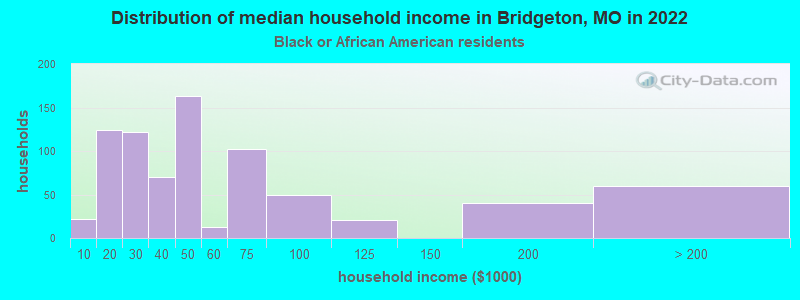
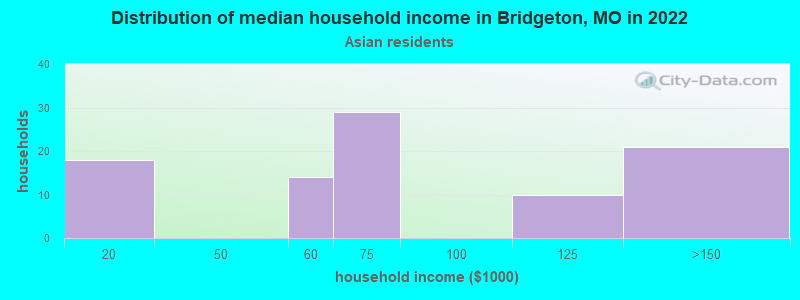
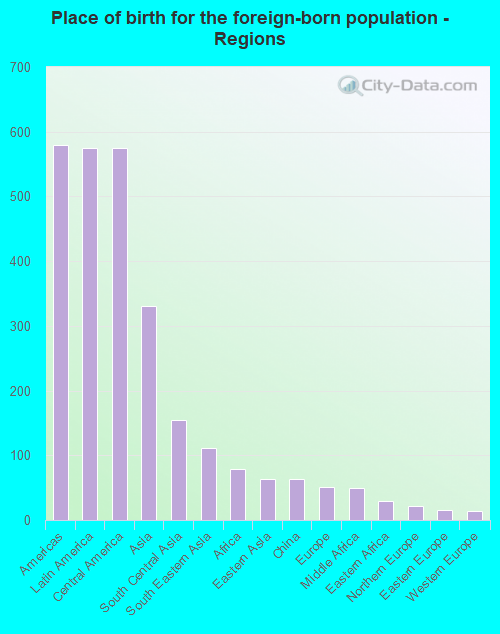
According to 2022 data, the most numerous races in Bridgeton, MO are White alone (6,936 residents), Black alone (2,348 residents), and Two or more races (523 residents). 87.0% of Bridgeton residents speak English at home. 9.2% of Bridgeton, MO residents are foreign-born (5.1% born in Latin America, 3.0% born in Asia), which is 56.5% greater than the foreign-born rate of 4.0% across the entire state of Missouri.
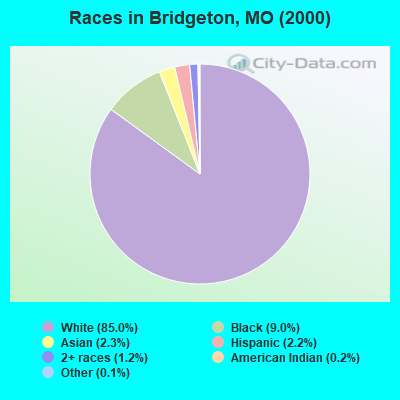
Race distribution in Bridgeton
2000 2022
4,686,474 83.8% White alone 625,667 11.2% Black alone 118,592 2.1% Hispanic 71,905 1.3% Two or more races 61,041 1.1% Asian alone 23,302 0.4% American Indian alone 5,291 0.09% Other race alone 2,939 0.05% Native Hawaiian and Other
4,733,411 76.6% White alone 656,739 10.6% Black alone 316,300 5.1% Two or more races 291,763 4.7% Hispanic 132,436 2.1% Asian alone 27,467 0.4% Other race alone 12,313 0.2% American Indian alone 7,528 0.1% Native Hawaiian and Other
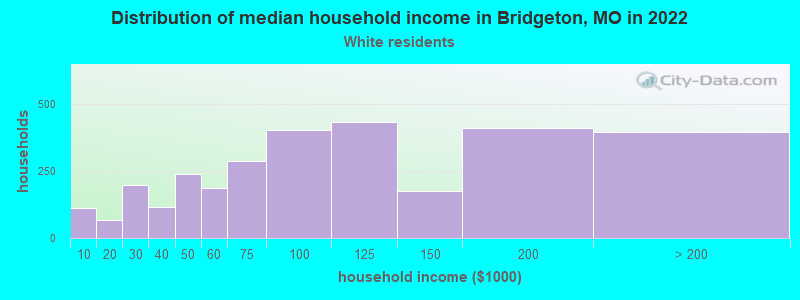
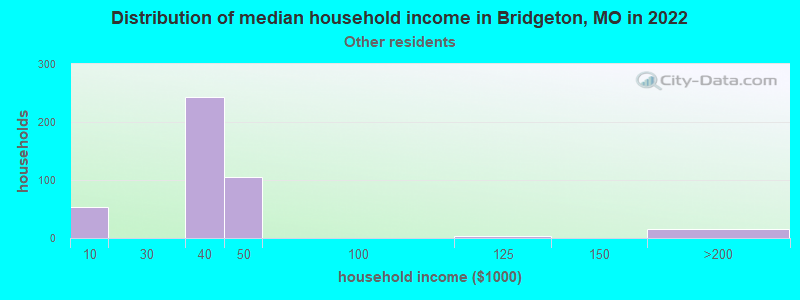
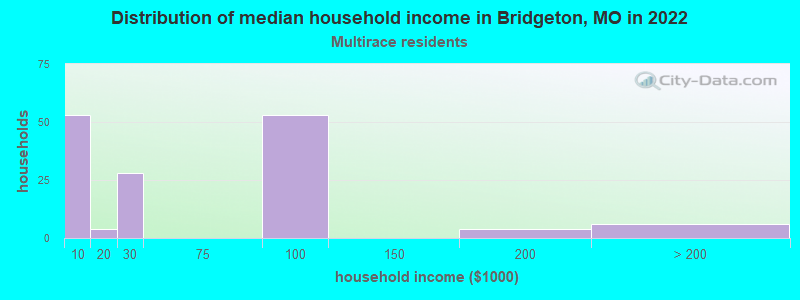
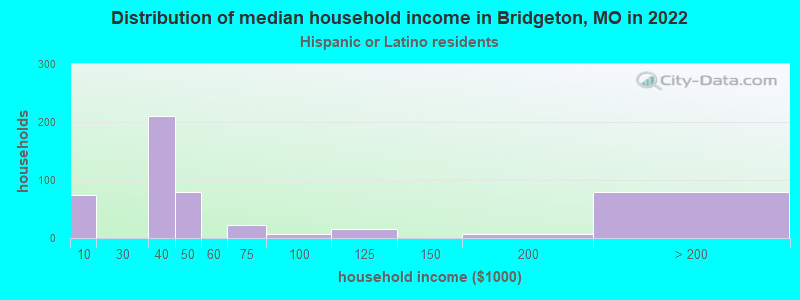
Income and house value in Bridgeton Median household income in 2022 $92,706 White non-Hispanic householders$43,010 Black householders$66,377 Asian householders$53,902 Some other race householders$40,446 Hispanic or Latino race householdersMedian 2022 house value $253,059 White Non-Hispanic householders$344,638 Black or African American householders$176,964 American Indian or Alaska Native householders $149,977 Asian householders$216,118 Two or more races householders$197,757 Hispanic or Latino householders
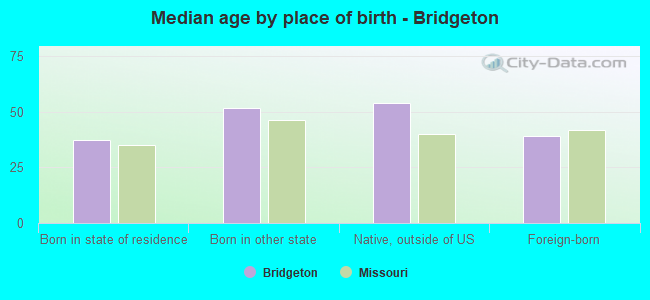
Median age by race in Bridgeton
48.2 Median age for White residents46.9 48.7 34.4 Median age for Black or African American residents25.5 36.4 -520,187,792.9 Median age for American Indian / Alaska Native residents-644,003,776.5 -505,494,505.0 34.0 Median age for Asian residents32.5 43.8 -710,303,029.6 Median age for Native Hawaiian / Pacific Islander residents-1,449,781,657.9 -752,136,751.4 36.2 Median age for Other race residents35.6 50.2 12.1 Median age for Two or more races residents9.9 14.9 50.7 Median age for White alone residents49.6 52.5 35.5 Median age for Hispanic or Latino residents37.0 32.9
Owner/renter occupied households by race in Bridgeton
House owners and renters - White residents 2,321 76.6% Owner occupied707 23.4% Renter occupiedHouse owners and renters - Black or African American residents 274 33.0% Owner occupied556 67.0% Renter occupiedHouse owners and renters - American Indian / Alaska Native residents 3 100.0% Renter occupiedHouse owners and renters - Asian residents 53 58.8% Owner occupied37 41.2% Renter occupiedHouse owners and renters - Other race residents 15 5.2% Owner occupied280 94.8% Renter occupiedHouse owners and renters - Two or more races residents 71 37.7% Owner occupied118 62.3% Renter occupiedHouse owners and renters - White alone residents 2,299 78.9% Owner occupied616 21.1% Renter occupiedHouse owners and renters - Hispanic or Latino residents 44 9.1% Owner occupied445 90.9% Renter occupied
Language usage in Bridgeton
English speakers - Total 87.0% of residents of Bridgeton speak English at home.
9.0% of residents speak Spanish at home 314 32.3% Speak English very well658 67.7% Speak English less than very well4.4% of residents speak other language at home 156 32.9% Speak English very well318 67.1% Speak English less than very well
English speakers - Born in the United States 98.1% of residents of Bridgeton speak English at home.
0.5% of residents speak Spanish at home 11 100.0% Speak English very well1.2% of residents speak other language at home 13 54.2% Speak English very well11 45.8% Speak English less than very well
English speakers - Native, born elsewhere 70.6% of residents of Bridgeton speak English at home.
25.5% of residents speak Spanish at home 26 100.0% Speak English very well
English speakers - Foreign-born 5.8% of residents of Bridgeton speak English at home.
66.0% of residents speak Spanish at home 103 14.9% Speak English very well587 85.1% Speak English less than very well37.6% of residents speak other language at home 107 27.2% Speak English very well286 72.8% Speak English less than very well
White (Caucasian) - Speak only English Native:
97.0% (6,739)Foreign-born:
17.2% (41)
White (Caucasian) - Speak another language Native:
3.0% (208)Foreign-born:
83.9% (202)
Asian - Speak only English Native:
100.0% (1)Foreign-born:
1.6% (5)
Other race - Speak another language Native:
50.9% (97)Foreign-born:
90.6% (342)
White alone - Speak only English Native:
98.9% (6,659)Foreign-born:
80.1% (42)
White alone - Speak another language Native:
1.1% (74)Foreign-born:
7.3% (4)
Hispanic or Latino - Speak another language Native:
55.2% (285)Foreign-born:
100.0% (648)
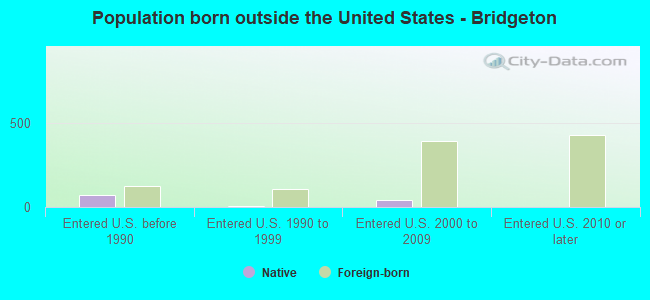
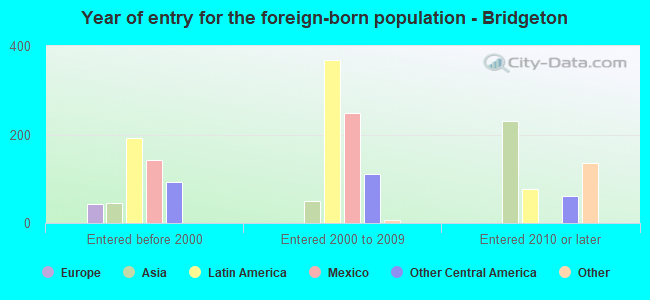
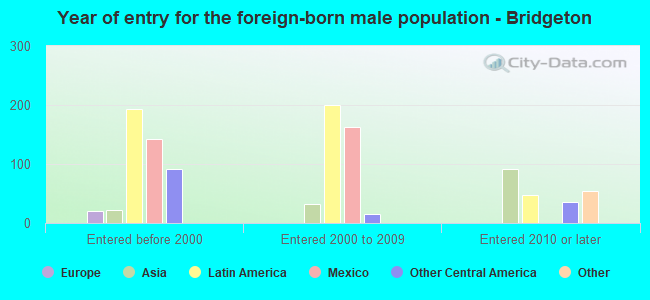
Foreign-born residents in Bridgeton 1,041 residents are foreign born (5.1% Latin America , 3.0% Asia ).
This city:
9.2%Missouri:
4.2%
Marital status for residents in Bridgeton Marital status - White (Caucasian) population 15 years and over
Males 32.2% Never married54.8% Now married0.0% Separated3.8% Widowed9.2% DivorcedFemales 30.4% Never married48.0% Now married0.1% Separated12.1% Widowed9.4% DivorcedWomen who gave birth in the past 12 months Now married:
70.4% (18)Unmarried:
29.6% (8)
Women who did not give birth in the past 12 months Now married:
36.1% (440)Unmarried:
63.9% (780)
Marital status - Black or African American population 15 years and over
Males 67.1% Never married24.7% Now married4.4% Separated1.8% Widowed2.0% DivorcedFemales 54.6% Never married17.2% Now married2.5% Separated5.6% Widowed20.1% DivorcedWomen who gave birth in the past 12 months Now married:
100.0% (25)Unmarried:
0.0% (0)
Women who did not give birth in the past 12 months Now married:
19.9% (130)Unmarried:
80.1% (525)
Marital status - Asian population 15 years and over
Males 33.6% Never married66.4% Now married0.0% Separated0.0% Widowed0.0% DivorcedFemales 0.6% Never married89.3% Now married0.0% Separated10.1% Widowed0.0% DivorcedWomen who did not give birth in the past 12 months Now married:
99.2% (132)Unmarried:
0.8% (1)
Marital status - Other race population 15 years and over
Males 91.3% Never married8.7% Now married0.0% Separated0.0% Widowed0.0% DivorcedFemales 100.0% Never married0.0% Now married0.0% Separated0.0% Widowed0.0% DivorcedWomen who did not give birth in the past 12 months Now married:
0.0% (0)Unmarried:
100.0% (18)
Marital status - Two or more races population 15 years and over
Males 0.0% Never married100.0% Now married0.0% Separated0.0% Widowed0.0% DivorcedFemales 59.3% Never married39.4% Now married0.0% Separated1.4% Widowed0.0% DivorcedWomen who gave birth in the past 12 months Now married:
0.0% (0)Unmarried:
100.0% (51)
Women who did not give birth in the past 12 months Now married:
55.0% (101)Unmarried:
45.0% (83)
Marital status - White alone, not Hispanic / Latino population 15 years and over
Males 30.1% Never married56.7% Now married0.0% Separated4.0% Widowed9.2% DivorcedFemales 28.6% Never married48.9% Now married0.1% Separated12.6% Widowed9.8% DivorcedWomen who gave birth in the past 12 months Now married:
70.4% (18)Unmarried:
29.6% (8)
Women who did not give birth in the past 12 months Now married:
37.5% (420)Unmarried:
62.5% (700)
Marital status - Hispanic or Latino population 15 years and over
Males 86.5% Never married10.5% Now married0.0% Separated0.0% Widowed3.0% DivorcedFemales 79.3% Never married20.7% Now married0.0% Separated0.0% Widowed0.0% DivorcedWomen who did not give birth in the past 12 months Now married:
33.5% (61)Unmarried:
66.5% (121)
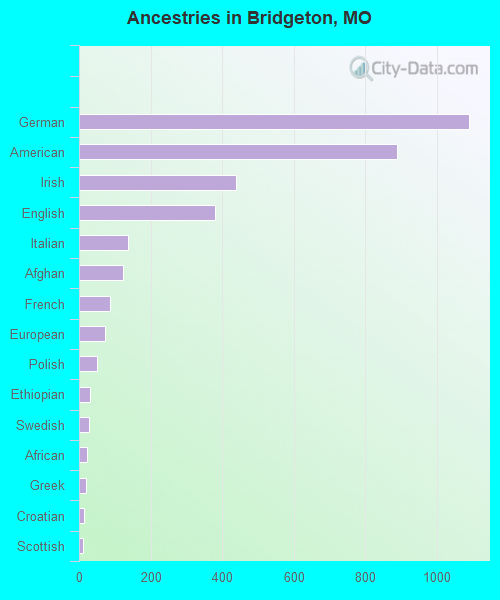
Ancestries in Bridgeton
1,091 19.5% German889 15.9% American438 7.8% Irish380 6.8% English137 2.5% Italian124 2.2% Afghan86 1.5% French73 1.3% European51 0.9% Polish30 0.5% Ethiopian29 0.5% Swedish22 0.4% African20 0.4% Greek14 0.3% Croatian10 0.2% Scottish9 0.2% Canadian8 0.1% Hungarian6 0.1% Dutch3 0.05% Kenyan
Children Nativity (place of birth) in Bridgeton
Children under 6 years - Living with two parents Both parents native 325 98.0% Native7 2.0% Foreign-bornBoth parents foreign-born 70 82.8% Native14 17.2% Foreign-bornOne native, one foreign-born parent 8 100.0% NativeChildren under 6 years - Living with one parent Native parent 270 100.0% NativeForeign-born parent 156 100.0% NativeChildren 6 to 17 years - Living with two parents Both parents native 870 100.0% NativeBoth parents foreign-born 59 100.0% Foreign-bornOne native, one foreign-born parent 23 100.0% NativeChildren 6 to 17 years - Living with one parent Native parent 604 100.0% NativeForeign-born parent 154 48.6% Native163 51.4% Foreign-born
Grandparents responsible for own grandchildren in Bridgeton
Grandparents (30 to 59 years) White / Caucasian 45 100.0% Responsible for grandchildrenAsian 6 100.0% Not responsible for grandchildrenWhite alone, not Hispanic / Latino 48 100.0% Responsible for grandchildrenGrandparents (60 years and over) White / Caucasian 32 26.3% Responsible for grandchildren90 73.7% Not responsible for grandchildrenWhite alone, not Hispanic / Latino 32 25.9% Responsible for grandchildren92 74.1% Not responsible for grandchildren