Races in Broadlands, Virginia (VA) Detailed Stats
Data:
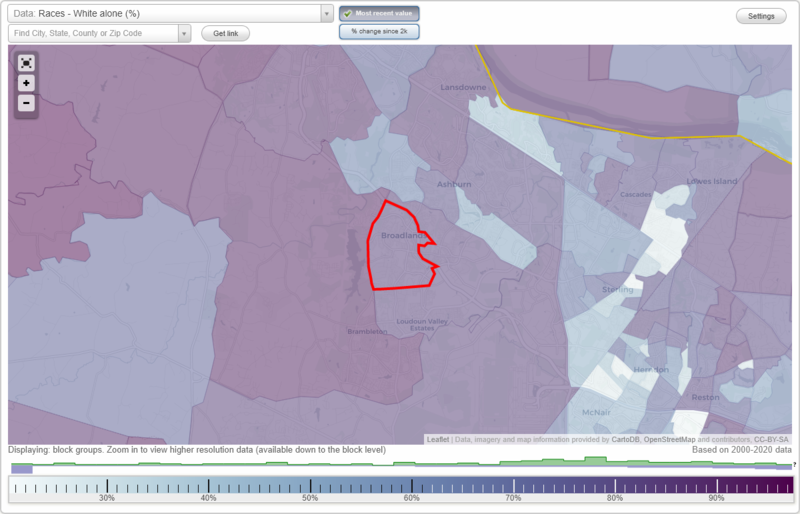
Races - White alone (%)
Races - White alone (% change since 2000)
Races - Black alone (%)
Races - Black alone (% change since 2000)
Races - American Indian alone (%)
Races - American Indian alone (% change since 2000)
Races - Asian alone (%)
Races - Asian alone (% change since 2000)
Races - Hispanic (%)
Races - Hispanic (% change since 2000)
Races - Native Hawaiian and Other Pacific Islander alone (%)
Races - Native Hawaiian and Other Pacific Islander alone (% change since 2000)
Races - Two or more races(%)
Races - Two or more races(% change since 2000)
Races - Other race alone (%)
Races - Other race alone (% change since 2000)
Racial diversity
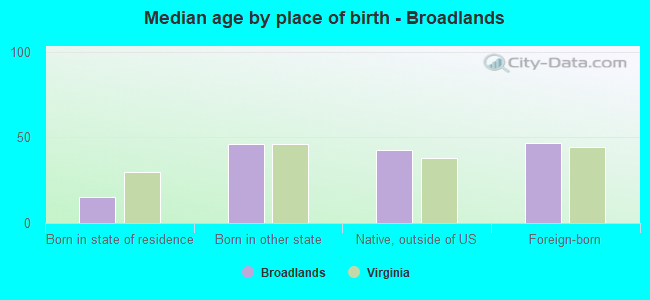
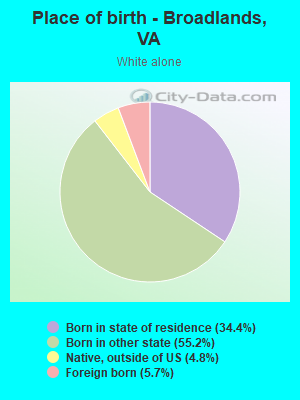
Place of birth - Born in state of residence (%)
Place of birth - Born in state of residence (%) - White
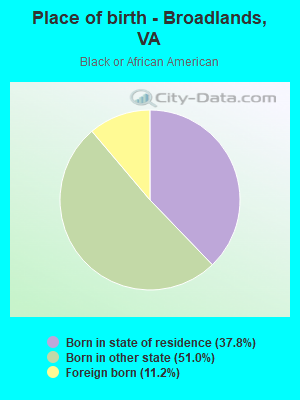
Place of birth - Born in state of residence (%) - Black or African American
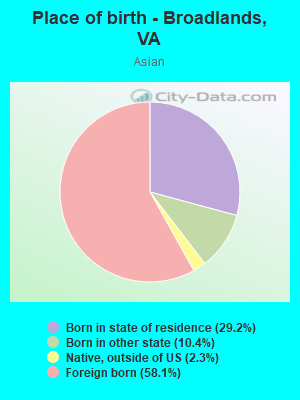
Place of birth - Born in state of residence (%) - Asian
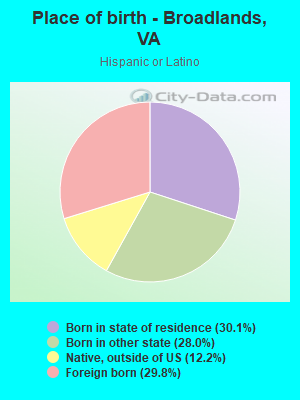
Place of birth - Born in state of residence (%) - Hispanic or Latino
Place of birth - Born in state of residence (%) - American Indian and Alaska Native
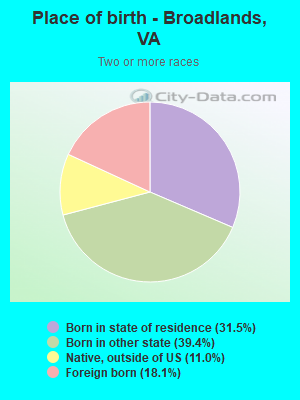
Place of birth - Born in state of residence (%) - Multirace
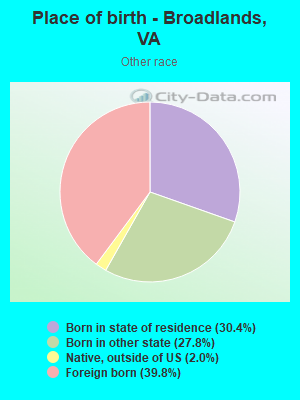
Place of birth - Born in state of residence (%) - Other Race
Place of birth - Born in other state (%)
Place of birth - Born in other state (%) - White
Place of birth - Born in other state (%) - Black or African American
Place of birth - Born in other state (%) - Asian
Place of birth - Born in other state (%) - Hispanic or Latino
Place of birth - Born in other state (%) - American Indian and Alaska Native
Place of birth - Born in other state (%) - Multirace
Place of birth - Born in other state (%) - Other Race
Place of birth - Native, outside of US (%)
Place of birth - Native, outside of US (%) - White
Place of birth - Native, outside of US (%) - Black or African American
Place of birth - Native, outside of US (%) - Asian
Place of birth - Native, outside of US (%) - Hispanic or Latino
Place of birth - Native, outside of US (%) - American Indian and Alaska Native
Place of birth - Native, outside of US (%) - Multirace
Place of birth - Native, outside of US (%) - Other Race
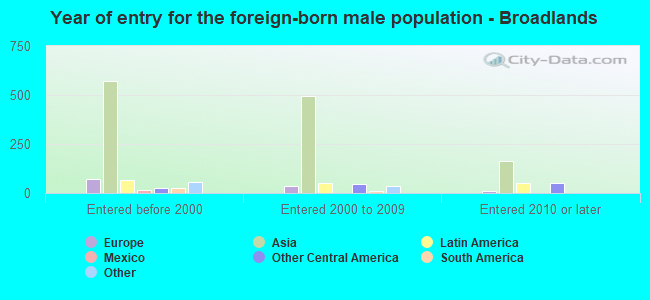
Place of birth - Foreign born (%)
Place of birth - Foreign born (%) - White
Place of birth - Foreign born (%) - Black or African American
Place of birth - Foreign born (%) - Asian
Place of birth - Foreign born (%) - Hispanic or Latino
Place of birth - Foreign born (%) - American Indian and Alaska Native
Place of birth - Foreign born (%) - Multirace
Place of birth - Foreign born (%) - Other Race
Residents speaking English at home (%)
Residents speaking English at home - Born in the United States (%)
Residents speaking English at home - Native, born elsewhere (%)
Residents speaking English at home - Foreign born (%)
Residents speaking Spanish at home (%)
Residents speaking Spanish at home - Born in the United States (%)
Residents speaking Spanish at home - Native, born elsewhere (%)
Residents speaking Spanish at home - Foreign born (%)
Residents speaking other language at home (%)
Residents speaking other language at home - Born in the United States (%)
Residents speaking other language at home - Native, born elsewhere (%)
Residents speaking other language at home - Foreign born (%)
Marital status - Never married (%)
Marital status - Now married (%)
Marital status - Separated (%)
Marital status - Widowed (%)
Marital status - Divorced (%)
Ancestries Reported - Arab (%)
Ancestries Reported - Czech (%)
Ancestries Reported - Danish (%)
Ancestries Reported - Dutch (%)
Ancestries Reported - English (%)
Ancestries Reported - French (%)
Ancestries Reported - French Canadian (%)
Ancestries Reported - German (%)
Ancestries Reported - Greek (%)
Ancestries Reported - Hungarian (%)
Ancestries Reported - Irish (%)
Ancestries Reported - Italian (%)
Ancestries Reported - Lithuanian (%)
Ancestries Reported - Norwegian (%)
Ancestries Reported - Polish (%)
Ancestries Reported - Portuguese (%)
Ancestries Reported - Russian (%)
Ancestries Reported - Scotch-Irish (%)
Ancestries Reported - Scottish (%)
Ancestries Reported - Slovak (%)
Ancestries Reported - Subsaharan African (%)
Ancestries Reported - Swedish (%)
Ancestries Reported - Swiss (%)
Ancestries Reported - Ukrainian (%)
Ancestries Reported - United States (%)
Ancestries Reported - Welsh (%)
Ancestries Reported - West Indian (%)
Ancestries Reported - Other (%)
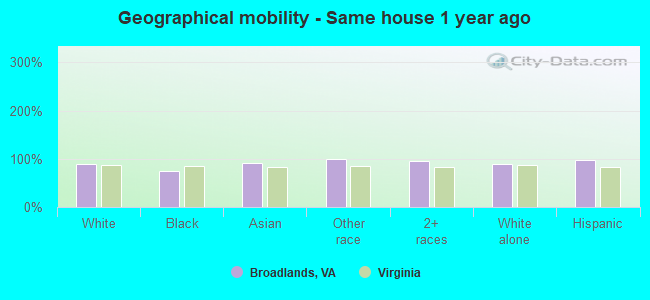
Geographical mobility - Same house 1 year ago (%)
Geographical mobility - Same house 1 year ago (%) - White
Geographical mobility - Same house 1 year ago (%) - Black or African American
Geographical mobility - Same house 1 year ago (%) - Asian
Geographical mobility - Same house 1 year ago (%) - Hispanic or Latino
Geographical mobility - Same house 1 year ago (%) - American Indian and Alaska Native
Geographical mobility - Same house 1 year ago (%) - Multirace
Geographical mobility - Same house 1 year ago (%) - Other Race
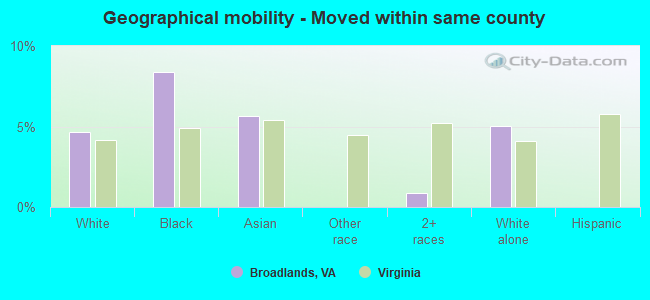
Geographical mobility - Moved within same county (%)
Geographical mobility - Moved within same county (%) - White
Geographical mobility - Moved within same county (%) - Black or African American
Geographical mobility - Moved within same county (%) - Asian
Geographical mobility - Moved within same county (%) - Hispanic or Latino
Geographical mobility - Moved within same county (%) - American Indian and Alaska Native
Geographical mobility - Moved within same county (%) - Multirace
Geographical mobility - Moved within same county (%) - Other Race
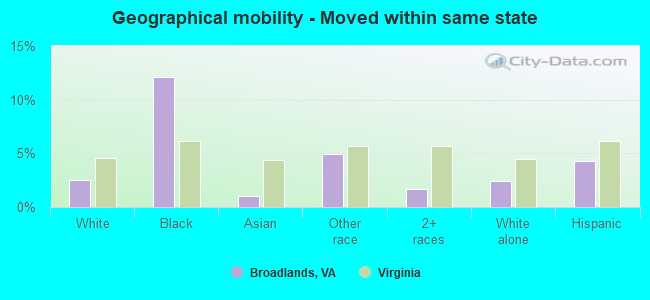
Geographical mobility - Moved from different county within same state (%)
Geographical mobility - Moved from different county within same state (%) - White
Geographical mobility - Moved from different county within same state (%) - Black or African American
Geographical mobility - Moved from different county within same state (%) - Asian
Geographical mobility - Moved from different county within same state (%) - Hispanic or Latino
Geographical mobility - Moved from different county within same state (%) - American Indian and Alaska Native
Geographical mobility - Moved from different county within same state (%) - Multirace
Geographical mobility - Moved from different county within same state (%) - Other Race
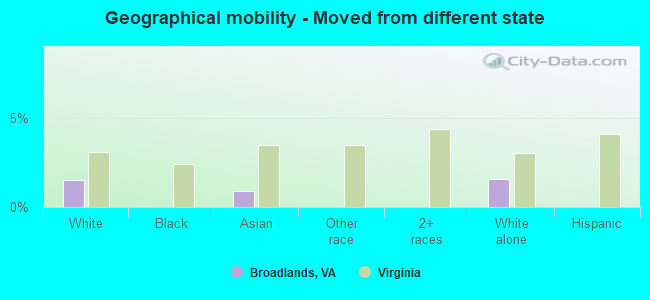
Geographical mobility - Moved from different state (%)
Geographical mobility - Moved from different state (%) - White
Geographical mobility - Moved from different state (%) - Black or African American
Geographical mobility - Moved from different state (%) - Asian
Geographical mobility - Moved from different state (%) - Hispanic or Latino
Geographical mobility - Moved from different state (%) - American Indian and Alaska Native
Geographical mobility - Moved from different state (%) - Multirace
Geographical mobility - Moved from different state (%) - Other Race
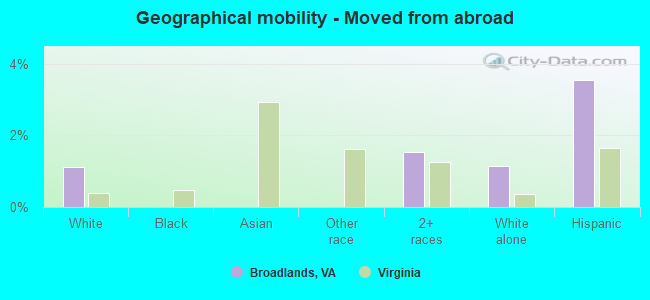
Geographical mobility - Moved from abroad (%)
Geographical mobility - Moved from abroad (%) - White
Geographical mobility - Moved from abroad (%) - Black or African American
Geographical mobility - Moved from abroad (%) - Asian
Geographical mobility - Moved from abroad (%) - Hispanic or Latino
Geographical mobility - Moved from abroad (%) - American Indian and Alaska Native
Geographical mobility - Moved from abroad (%) - Multirace
Geographical mobility - Moved from abroad (%) - Other Race
Place of birth for the foreign-born population - Ireland (%)
Place of birth for the foreign-born population - Denmark (%)
Place of birth for the foreign-born population - Norway (%)
Place of birth for the foreign-born population - Sweden (%)
Place of birth for the foreign-born population - United Kingdom (%)
Place of birth for the foreign-born population - England (%)
Place of birth for the foreign-born population - Scotland (%)
Place of birth for the foreign-born population - Other Northern Europe (%)
Place of birth for the foreign-born population - Austria (%)
Place of birth for the foreign-born population - Belgium (%)
Place of birth for the foreign-born population - France (%)
Place of birth for the foreign-born population - Germany (%)
Place of birth for the foreign-born population - Netherlands (%)
Place of birth for the foreign-born population - Switzerland (%)
Place of birth for the foreign-born population - Other Western Europe (%)
Place of birth for the foreign-born population - Greece (%)
Place of birth for the foreign-born population - Italy (%)
Place of birth for the foreign-born population - Portugal (%)
Place of birth for the foreign-born population - Spain (%)
Place of birth for the foreign-born population - Other Southern Europe (%)
Place of birth for the foreign-born population - Albania (%)
Place of birth for the foreign-born population - Belarus (%)
Place of birth for the foreign-born population - Bosnia and Herzegovina (%)
Place of birth for the foreign-born population - Bulgaria (%)
Place of birth for the foreign-born population - Croatia (%)
Place of birth for the foreign-born population - Czechoslovakia (%)
Place of birth for the foreign-born population - Hungary (%)
Place of birth for the foreign-born population - Latvia (%)
Place of birth for the foreign-born population - Lithuania (%)
Place of birth for the foreign-born population - North Macedonia (Macedonia) (%)
Place of birth for the foreign-born population - Moldova (%)
Place of birth for the foreign-born population - Poland (%)
Place of birth for the foreign-born population - Romania (%)
Place of birth for the foreign-born population - Russia (%)
Place of birth for the foreign-born population - Serbia (%)
Place of birth for the foreign-born population - Ukraine (%)
Place of birth for the foreign-born population - Other Eastern Europe (%)
Place of birth for the foreign-born population - China (%)
Place of birth for the foreign-born population - Hong Kong (%)
Place of birth for the foreign-born population - Taiwan (%)
Place of birth for the foreign-born population - Japan (%)
Place of birth for the foreign-born population - Korea (%)
Place of birth for the foreign-born population - Other Eastern Asia (%)
Place of birth for the foreign-born population - Afghanistan (%)
Place of birth for the foreign-born population - Bangladesh (%)
Place of birth for the foreign-born population - India (%)
Place of birth for the foreign-born population - Iran (%)
Place of birth for the foreign-born population - Kazakhstan (%)
Place of birth for the foreign-born population - Nepal (%)
Place of birth for the foreign-born population - Pakistan (%)
Place of birth for the foreign-born population - Sri Lanka (%)
Place of birth for the foreign-born population - Uzbekistan (%)
Place of birth for the foreign-born population - Other South Central Asia (%)
Place of birth for the foreign-born population - Burma (%)
Place of birth for the foreign-born population - Cambodia (%)
Place of birth for the foreign-born population - Indonesia (%)
Place of birth for the foreign-born population - Laos (%)
Place of birth for the foreign-born population - Malaysia (%)
Place of birth for the foreign-born population - Philippines (%)
Place of birth for the foreign-born population - Singapore (%)
Place of birth for the foreign-born population - Thailand (%)
Place of birth for the foreign-born population - Vietnam (%)
Place of birth for the foreign-born population - Other South Eastern Asia (%)
Place of birth for the foreign-born population - Armenia (%)
Place of birth for the foreign-born population - Iraq (%)
Place of birth for the foreign-born population - Israel (%)
Place of birth for the foreign-born population - Jordan (%)
Place of birth for the foreign-born population - Kuwait (%)
Place of birth for the foreign-born population - Lebanon (%)
Place of birth for the foreign-born population - Saudi Arabia (%)
Place of birth for the foreign-born population - Syria (%)
Place of birth for the foreign-born population - Turkey (%)
Place of birth for the foreign-born population - Yemen (%)
Place of birth for the foreign-born population - Other Western Asia (%)
Place of birth for the foreign-born population - Eritrea (%)
Place of birth for the foreign-born population - Ethiopia (%)
Place of birth for the foreign-born population - Kenya (%)
Place of birth for the foreign-born population - Somalia (%)
Place of birth for the foreign-born population - Uganda (%)
Place of birth for the foreign-born population - Zimbabwe (%)
Place of birth for the foreign-born population - Other Eastern Africa (%)
Place of birth for the foreign-born population - Cameroon (%)
Place of birth for the foreign-born population - Congo (%)
Place of birth for the foreign-born population - Democratic Republic of Congo (Zaire) (%)
Place of birth for the foreign-born population - Other Middle Africa (%)
Place of birth for the foreign-born population - Egypt (%)
Place of birth for the foreign-born population - Morocco (%)
Place of birth for the foreign-born population - Sudan (%)
Place of birth for the foreign-born population - Other Northern Africa (%)
Place of birth for the foreign-born population - South Africa (%)
Place of birth for the foreign-born population - Other Southern Africa (%)
Place of birth for the foreign-born population - Cabo Verde (%)
Place of birth for the foreign-born population - Ghana (%)
Place of birth for the foreign-born population - Liberia (%)
Place of birth for the foreign-born population - Nigeria (%)
Place of birth for the foreign-born population - Senegal (%)
Place of birth for the foreign-born population - Sierra Leone (%)
Place of birth for the foreign-born population - Other Western Africa (%)
Place of birth for the foreign-born population - Australia (%)
Place of birth for the foreign-born population - New Zealand (%)
Place of birth for the foreign-born population - Fiji (%)
Place of birth for the foreign-born population - Micronesia (%)
Place of birth for the foreign-born population - Bahamas (%)
Place of birth for the foreign-born population - Barbados (%)
Place of birth for the foreign-born population - Cuba (%)
Place of birth for the foreign-born population - Dominica (%)
Place of birth for the foreign-born population - Dominican Republic (%)
Place of birth for the foreign-born population - Grenada (%)
Place of birth for the foreign-born population - Haiti (%)
Place of birth for the foreign-born population - Jamaica (%)
Place of birth for the foreign-born population - St. Vincent and the Grenadines (%)
Place of birth for the foreign-born population - Trinidad and Tobago (%)
Place of birth for the foreign-born population - West Indies (%)
Place of birth for the foreign-born population - Other Caribbean (%)
Place of birth for the foreign-born population - Belize (%)
Place of birth for the foreign-born population - Costa Rica (%)
Place of birth for the foreign-born population - El Salvador (%)
Place of birth for the foreign-born population - Guatemala (%)
Place of birth for the foreign-born population - Honduras (%)
Place of birth for the foreign-born population - Mexico (%)
Place of birth for the foreign-born population - Nicaragua (%)
Place of birth for the foreign-born population - Panama (%)
Place of birth for the foreign-born population - Other Central America (%)
Place of birth for the foreign-born population - Argentina (%)
Place of birth for the foreign-born population - Bolivia (%)
Place of birth for the foreign-born population - Brazil (%)
Place of birth for the foreign-born population - Chile (%)
Place of birth for the foreign-born population - Colombia (%)
Place of birth for the foreign-born population - Ecuador (%)
Place of birth for the foreign-born population - Guyana (%)
Place of birth for the foreign-born population - Peru (%)
Place of birth for the foreign-born population - Uruguay (%)
Place of birth for the foreign-born population - Venezuela (%)
Place of birth for the foreign-born population - Other South America (%)
Place of birth for the foreign-born population - Canada (%)
Place of birth for the foreign-born population - Other Northern America (%)
Place of birth for the foreign-born population - Other (%)
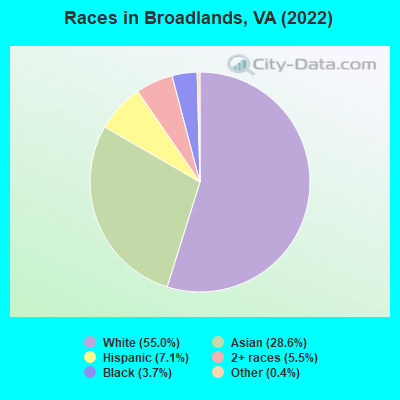
According to 2022 data, the most numerous races in Broadlands, VA are White alone (8,236 residents), Black alone (548 residents), and Hispanic (1,068 residents). 69.6% of Broadlands residents speak English at home.
Race distribution in Broadlands 8,236 55.0% White alone 4,284 28.6% Asian alone 1,068 7.1% Hispanic 820 5.5% Two or more races 548 3.7% Black alone 60 0.4% Other race alone
2000 2022
4,965,637 70.2% White alone 1,376,378 19.4% Black alone 329,540 4.7% Hispanic 259,277 3.7% Asian alone 114,022 1.6% Two or more races 18,596 0.3% American Indian alone 11,685 0.2% Other race alone 3,380 0.05% Native Hawaiian and Other
5,095,130 58.7% White alone 1,594,785 18.4% Black alone 905,750 10.4% Hispanic 602,881 6.9% Asian alone 406,047 4.7% Two or more races 60,419 0.7% Other race alone 11,738 0.1% American Indian alone 6,869 0.08% Native Hawaiian and Other
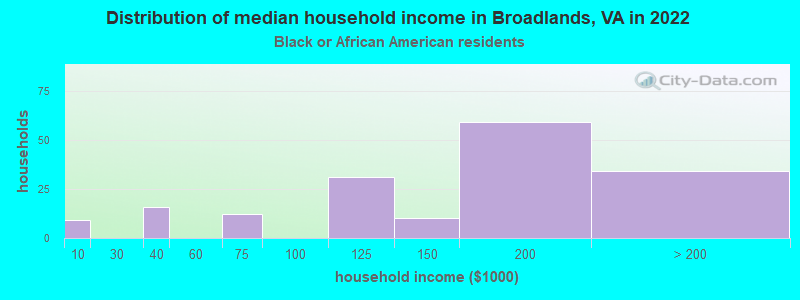
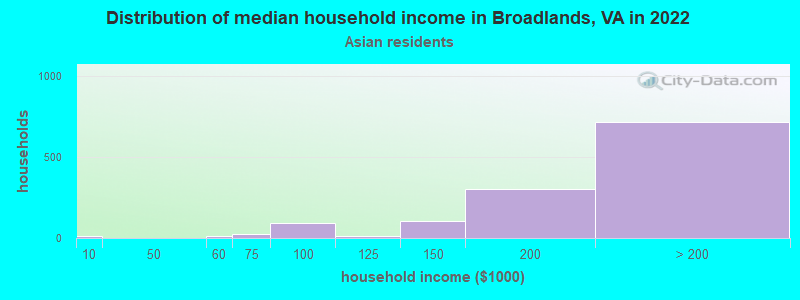
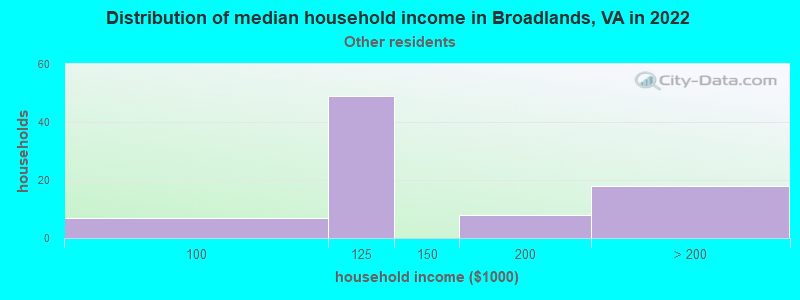
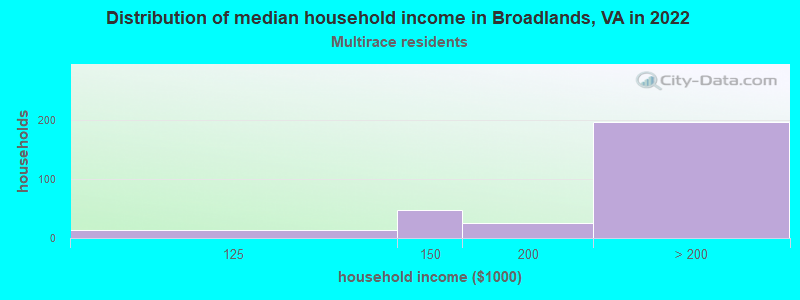
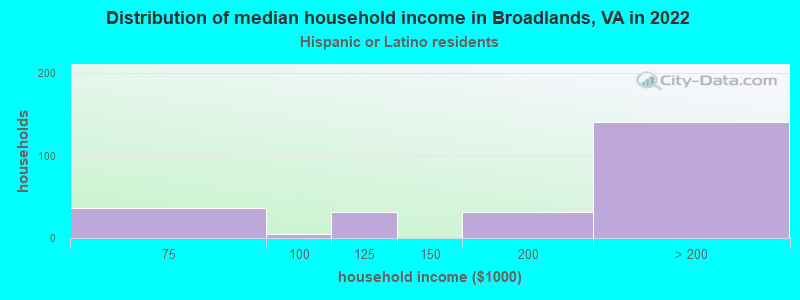
Income and house value in Broadlands Median household income in 2022 over $200,000 White non-Hispanic householdersover $200,000 Asian householders$118,548 Some other race householdersover $200,000 Two or more races householdersover $200,000 Hispanic or Latino race householders
Median age by race in Broadlands
39.9 Median age for White residents37.4 41.7 39.4 Median age for Black or African American residents24.9 41.4 -792,063,491.3 Median age for American Indian / Alaska Native residents-862,921,347.5 -673,154,906.1 38.1 Median age for Asian residents38.7 37.3 -1,157,453,935.2 Median age for Native Hawaiian / Pacific Islander residents-541,531,822.5 -714,150,046.8 23.1 Median age for Other race residents37.5 20.1 38.0 Median age for Two or more races residents37.0 38.6 39.8 Median age for White alone residents37.7 41.4 42.0 Median age for Hispanic or Latino residents39.3 43.0
Owner/renter occupied households by race in Broadlands
House owners and renters - White residents 2,302 86.5% Owner occupied358 13.5% Renter occupiedHouse owners and renters - Black or African American residents 90 47.9% Owner occupied97 52.1% Renter occupiedHouse owners and renters - Asian residents 1,248 94.9% Owner occupied67 5.1% Renter occupiedHouse owners and renters - Other race residents 73 89.0% Owner occupied9 11.0% Renter occupiedHouse owners and renters - Two or more races residents 209 78.8% Owner occupied56 21.2% Renter occupiedHouse owners and renters - White alone residents 2,300 87.3% Owner occupied334 12.7% Renter occupiedHouse owners and renters - Hispanic or Latino residents 180 74.3% Owner occupied62 25.7% Renter occupied
Language usage in Broadlands
English speakers - Total 69.6% of residents of Broadlands speak English at home.
4.4% of residents speak Spanish at home 451 71.7% Speak English very well178 28.3% Speak English less than very well25.8% of residents speak other language at home 2,757 74.3% Speak English very well952 25.7% Speak English less than very well
English speakers - Born in the United States 92.5% of residents of Broadlands speak English at home.
2.1% of residents speak Spanish at home 104 80.6% Speak English very well25 19.4% Speak English less than very well5.1% of residents speak other language at home 309 100.0% Speak English very well
English speakers - Native, born elsewhere 36.7% of residents of Broadlands speak English at home.
26.0% of residents speak Spanish at home 171 100.0% Speak English very well49.8% of residents speak other language at home 327 100.0% Speak English very well
English speakers - Foreign-born 11.2% of residents of Broadlands speak English at home.
9.3% of residents speak Spanish at home 152 48.6% Speak English very well161 51.4% Speak English less than very well81.1% of residents speak other language at home 1,885 69.4% Speak English very well832 30.6% Speak English less than very well
White (Caucasian) - Speak only English Native:
94.5% (7,146)Foreign-born:
15.0% (59)
White (Caucasian) - Speak another language Native:
5.5% (418)Foreign-born:
85.8% (338)
Black or African American - Speak another language Native:
4.2% (21)Foreign-born:
100.0% (59)
Asian - Speak only English Native:
63.5% (998)Foreign-born:
13.8% (345)
Asian - Speak another language Native:
33.9% (533)Foreign-born:
86.2% (2,150)
Other race - Speak only English Native:
50.1% (85)Foreign-born:
5.3% (7)
Other race - Speak another language Native:
49.7% (85)Foreign-born:
95.7% (122)
Two or more races - Speak another language Native:
16.9% (203)Foreign-born:
99.1% (293)
White alone - Speak only English Native:
93.6% (6,984)Foreign-born:
12.7% (59)
White alone - Speak another language Native:
6.6% (489)Foreign-born:
91.7% (430)
Hispanic or Latino - Speak only English Native:
61.3% (438)Foreign-born:
2.0% (7)
Hispanic or Latino - Speak another language Native:
39.5% (282)Foreign-born:
97.3% (314)
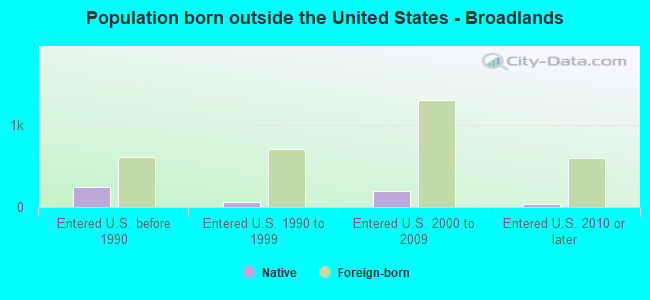
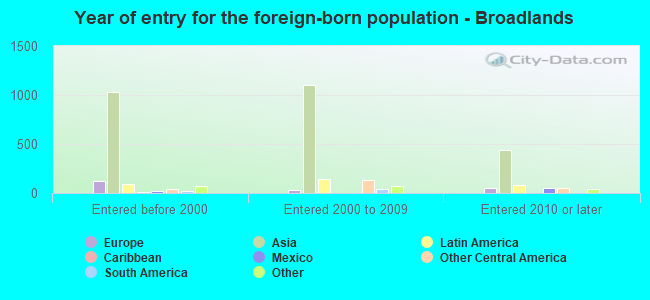
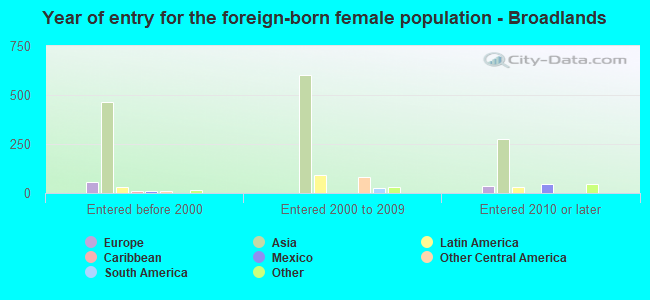
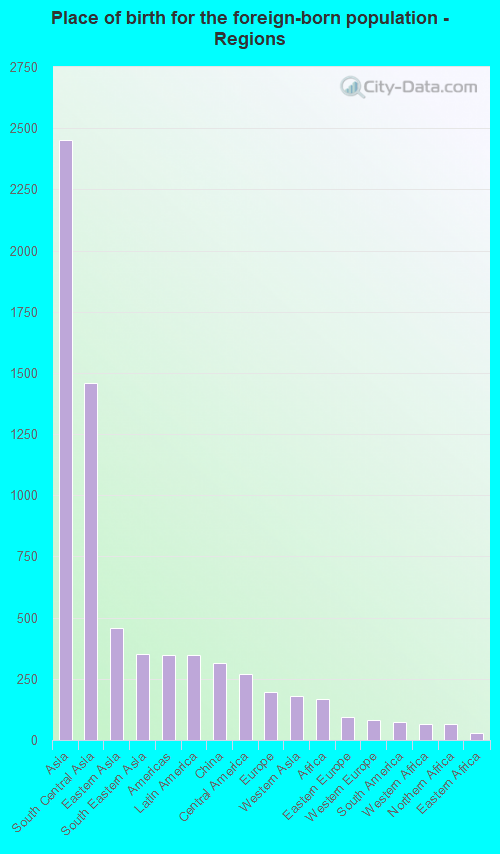
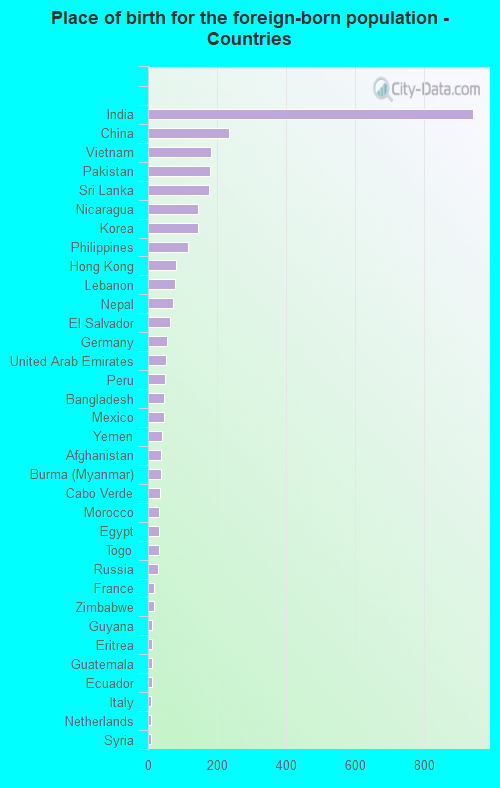
Foreign-born residents in Broadlands
Marital status for residents in Broadlands Marital status - White (Caucasian) population 15 years and over
Males 29.8% Never married62.7% Now married0.6% Separated2.3% Widowed4.6% DivorcedFemales 30.6% Never married56.8% Now married0.5% Separated5.7% Widowed6.3% DivorcedWomen who gave birth in the past 12 months Now married:
82.6% (52)Unmarried:
17.4% (11)
Women who did not give birth in the past 12 months Now married:
48.7% (922)Unmarried:
51.3% (973)
Marital status - Black or African American population 15 years and over
Males 51.6% Never married48.4% Now married0.0% Separated0.0% Widowed0.0% DivorcedFemales 19.2% Never married57.0% Now married0.0% Separated0.0% Widowed23.8% DivorcedWomen who did not give birth in the past 12 months Now married:
68.3% (81)Unmarried:
31.7% (38)
Marital status - Asian population 15 years and over
Males 19.3% Never married76.7% Now married0.0% Separated3.9% Widowed0.0% DivorcedFemales 23.7% Never married64.3% Now married0.9% Separated6.7% Widowed4.4% DivorcedWomen who gave birth in the past 12 months Now married:
100.0% (20)Unmarried:
0.0% (0)
Women who did not give birth in the past 12 months Now married:
68.5% (912)Unmarried:
31.5% (419)
Marital status - Other race population 15 years and over
Males 41.1% Never married58.9% Now married0.0% Separated0.0% Widowed0.0% DivorcedFemales 29.9% Never married59.7% Now married0.0% Separated0.0% Widowed10.4% DivorcedWomen who did not give birth in the past 12 months Now married:
56.3% (49)Unmarried:
43.7% (38)
Marital status - Two or more races population 15 years and over
Males 26.8% Never married73.2% Now married0.0% Separated0.0% Widowed0.0% DivorcedFemales 4.0% Never married96.0% Now married0.0% Separated0.0% Widowed0.0% DivorcedWomen who gave birth in the past 12 months Now married:
100.0% (11)Unmarried:
0.0% (0)
Women who did not give birth in the past 12 months Now married:
90.6% (208)Unmarried:
9.4% (22)
Marital status - White alone, not Hispanic / Latino population 15 years and over
Males 30.0% Never married63.4% Now married0.6% Separated1.3% Widowed4.7% DivorcedFemales 30.5% Never married56.8% Now married0.5% Separated5.9% Widowed6.2% DivorcedWomen who gave birth in the past 12 months Now married:
100.0% (55)Unmarried:
0.0% (0)
Women who did not give birth in the past 12 months Now married:
48.8% (944)Unmarried:
51.2% (991)
Marital status - Hispanic or Latino population 15 years and over
Males 27.2% Never married64.0% Now married0.0% Separated8.9% Widowed0.0% DivorcedFemales 13.9% Never married80.8% Now married0.0% Separated0.0% Widowed5.3% DivorcedWomen who gave birth in the past 12 months Now married:
0.0% (0)Unmarried:
100.0% (12)
Women who did not give birth in the past 12 months Now married:
70.0% (145)Unmarried:
30.0% (62)
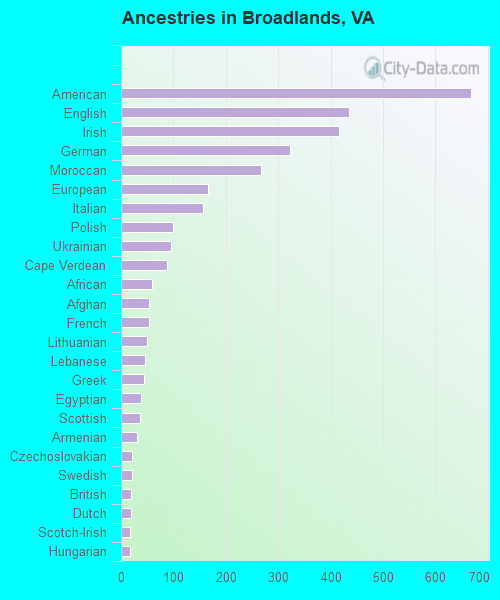
Ancestries in Broadlands
669 9.3% American435 6.0% English416 5.8% Irish322 4.5% German268 3.7% Moroccan166 2.3% European156 2.2% Italian99 1.4% Polish95 1.3% Ukrainian88 1.2% Cape Verdean60 0.8% African54 0.8% Afghan53 0.7% French49 0.7% Lithuanian45 0.6% Lebanese44 0.6% Greek39 0.5% Egyptian36 0.5% Scottish31 0.4% Armenian21 0.3% Czechoslovakian21 0.3% Swedish20 0.3% British19 0.3% Dutch18 0.3% Scotch-Irish17 0.2% Hungarian16 0.2% Danish14 0.2% Norwegian11 0.2% Austrian10 0.1% Ethiopian9 0.1% Canadian7 0.10% Czech7 0.10% Russian6 0.08% French Canadian6 0.08% Slavic
Geographical mobility in Broadlands Same house 1 year ago 7,259 89.5% White (Caucasian)401 74.2% Black or African American3,898 90.7% Asian323 99.6% Other race1,478 95.8% Two or more races7,286 89.2% White alone, not Hispanic / Latino1,035 98.0% Hispanic or LatinoMoved within same county 379 4.7% White / Caucasian45 8.4% Black or African American242 5.6% Asian14 0.9% Two or more races410 5.0% White alone, not Hispanic / LatinoMoved within same state 208 2.6% White / Caucasian65 12.1% Black or African American44 1.0% Asian16 4.9% Other race26 1.7% Two or more races194 2.4% White alone, not Hispanic / Latino45 4.3% Hispanic or LatinoMoved from different state 122 1.5% White / Caucasian38 0.9% Asian126 1.5% White alone, not Hispanic / LatinoMoved from abroad 90 1.1% White24 1.5% Two or more races92 1.1% White alone, not Hispanic / Latino38 3.6% Hispanic or Latino
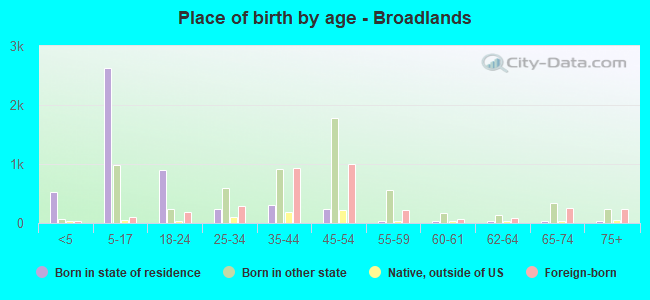
Children Nativity (place of birth) in Broadlands
Children under 6 years - Living with two parents Both parents native 393 100.0% NativeBoth parents foreign-born 198 100.0% NativeOne native, one foreign-born parent 153 100.0% NativeChildren under 6 years - Living with one parent Native parent 47 100.0% NativeForeign-born parent 13 100.0% NativeChildren 6 to 17 years - Living with two parents Both parents native 2,000 99.7% Native6 0.3% Foreign-bornBoth parents foreign-born 725 90.2% Native79 9.8% Foreign-bornOne native, one foreign-born parent 445 100.0% NativeChildren 6 to 17 years - Living with one parent Native parent 243 100.0% NativeForeign-born parent 118 52.8% Native105 47.2% Foreign-born
Grandparents responsible for own grandchildren in Broadlands
Grandparents (30 to 59 years) White / Caucasian 7 100.0% Responsible for grandchildrenAsian 25 100.0% Responsible for grandchildrenWhite alone, not Hispanic / Latino 7 100.0% Responsible for grandchildrenGrandparents (60 years and over) White / Caucasian 9 9.2% Responsible for grandchildren84 90.8% Not responsible for grandchildrenAsian 107 100.0% Not responsible for grandchildrenWhite alone, not Hispanic / Latino 9 8.9% Responsible for grandchildren89 91.1% Not responsible for grandchildren