Races in Brookfield, Vermont (VT) Detailed Stats
Ancestries, Foreign-born residents, place of birth

Recent posts about races in Brookfield, Vermont on our local forum with over 2,400,000 registered users:
 | Deciding on if I should move to Vermont... (11 replies) |
| Questions About White River Junction Area (49 replies) |
| Vermont Seen as Worst Tax State for Retirees (74 replies) |
| What's the deal with Roxbury? (12 replies) |
| Vermont sustainablilty (130 replies) |
| Cat safety, fisher cats, bears (115 replies) |
0.8% of Brookfield, VT residents are foreign-born , which is 388.8% less than the foreign-born rate of 4.0% across the entire state of Vermont.
Race distribution in Brookfield

- 1,19297.5%White alone
- 131.1%Two or more races
- 121.0%Asian alone
- 20.2%Black alone
- 20.2%American Indian alone
- 10.08%Hispanic
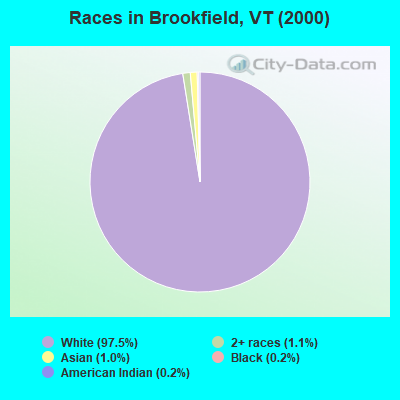
2000
2022
-
- 585,43196.2%White alone
- 6,8091.1%Two or more races
- 5,5040.9%Hispanic
- 5,1600.8%Asian alone
- 2,9210.5%Black alone
- 2,3250.4%American Indian alone
- 5570.09%Other race alone
- 1200.02%Native Hawaiian and Other
Pacific Islander alone

-
- 583,54690.2%White alone
- 27,3404.2%Two or more races
- 14,7702.3%Hispanic
- 11,5121.8%Asian alone
- 6,2641.0%Black alone
- 2,5210.4%Other race alone
- 1,0520.2%American Indian alone
- 590.01%Native Hawaiian and Other
Pacific Islander alone

Income and house value in Brookfield
- Median household income in 2022
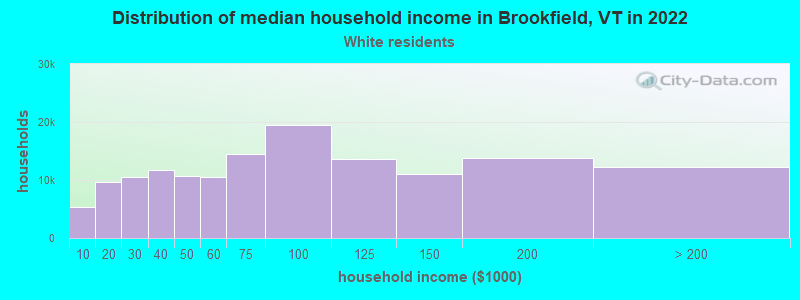
- $81,858White non-Hispanic householders
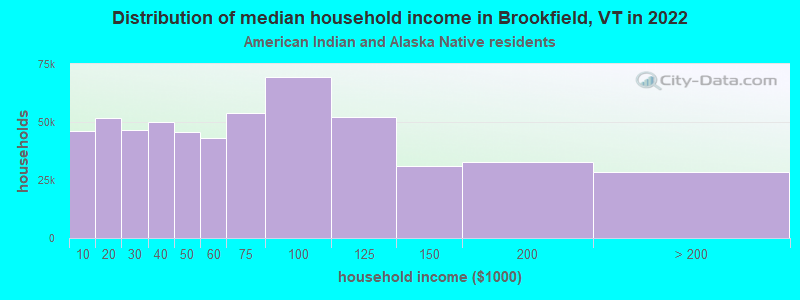
- $48,290American Indian and Alaska Native householders
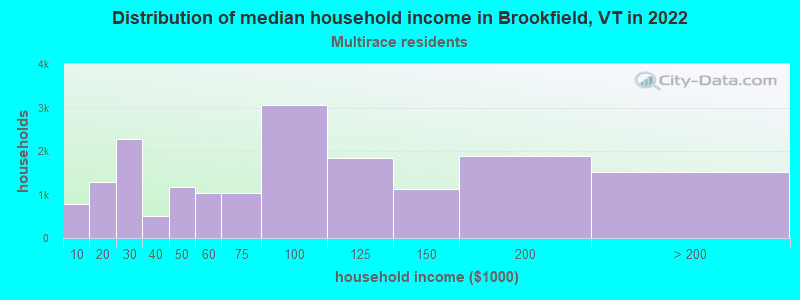
- $84,374Two or more races householders
- Median 2022 house value
- $253,411White Non-Hispanic householders
- $425,847Two or more races householders
Household income for White non-Hispanic householders
Household income for American Indian and Alaska Native householders
Household income for Two or more races householders
Foreign-born residents in Brookfield
10 residents are foreign born
| This city: | 0.8% |
| Vermont: | 3.8% |
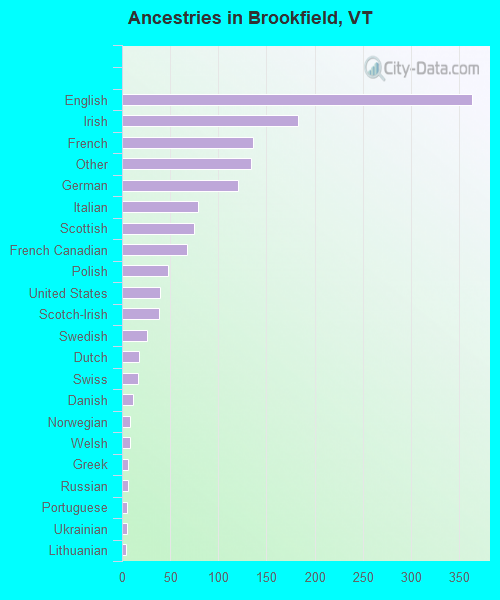
Ancestries in Brookfield

- 36325.8%English
- 18313.0%Irish
- 1369.7%French
- 1349.5%Other
- 1208.5%German
- 795.6%Italian
- 755.3%Scottish
- 684.8%French Canadian
- 483.4%Polish
- 392.8%United States
- 382.7%Scotch-Irish
- 261.9%Swedish
- 181.3%Dutch
- 171.2%Swiss
- 110.8%Danish
- 80.6%Norwegian
- 80.6%Welsh
- 60.4%Greek
- 60.4%Russian
- 50.4%Portuguese
- 50.4%Ukrainian
- 40.3%Lithuanian
- 30.2%Arab
- 30.2%Hungarian
- 20.1%Subsaharan African
Zip codes: 05036.