Races in Brownsville-Bawcomville, Louisiana (LA) Detailed Stats
Ancestries, Foreign-born residents, place of birth

Discuss Brownsville-Bawcomville, Louisiana races on our local forum with over 2,400,000 registered users
1.2% of Brownsville-Bawcomville, LA residents are foreign-born , which is 227.6% less than the foreign-born rate of 4.0% across the entire state of Louisiana.
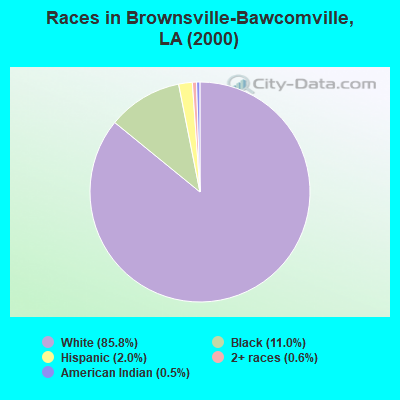
Race distribution in Brownsville-Bawcomville

- 6,53485.8%White alone
- 83611.0%Black alone
- 1502.0%Hispanic
- 480.6%Two or more races
- 390.5%American Indian alone
- 50.07%Asian alone
- 40.05%Other race alone
2000
2022
-
- 2,794,39162.5%White alone
- 1,443,39032.3%Black alone
- 107,7382.4%Hispanic
- 54,2561.2%Asian alone
- 39,2600.9%Two or more races
- 24,1290.5%American Indian alone
- 4,7360.1%Other race alone
- 1,0760.02%Native Hawaiian and Other
Pacific Islander alone

-
- 2,603,22156.7%White alone
- 1,420,05530.9%Black alone
- 262,2135.7%Hispanic
- 183,2704.0%Two or more races
- 81,1691.8%Asian alone
- 19,9910.4%American Indian alone
- 18,0430.4%Other race alone
- 2,2790.05%Native Hawaiian and Other
Pacific Islander alone

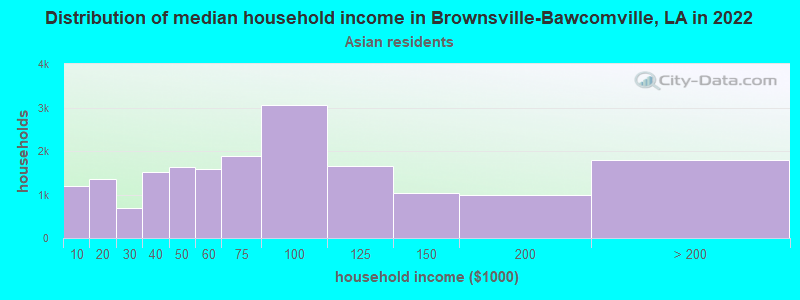
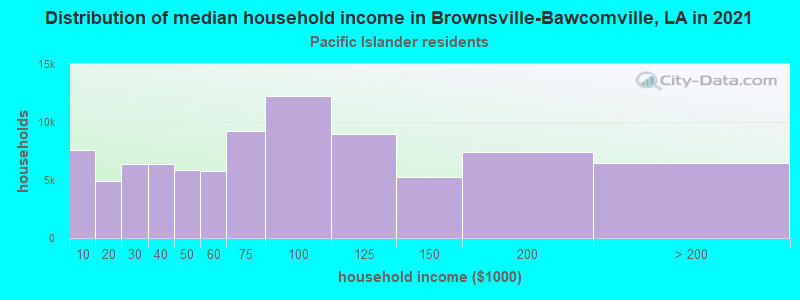
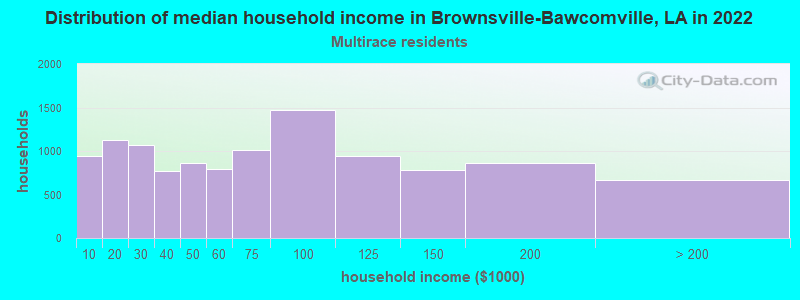
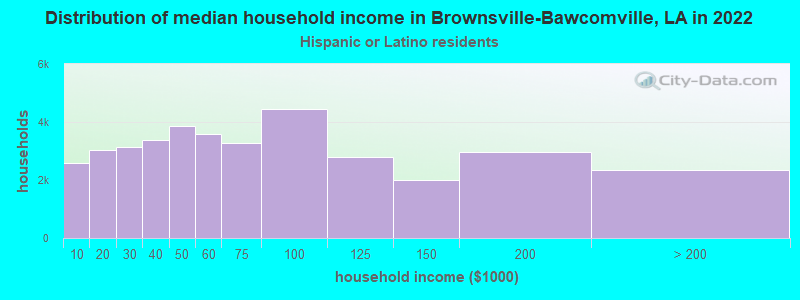
Income and house value in Brownsville-Bawcomville
- Median household income in 2022
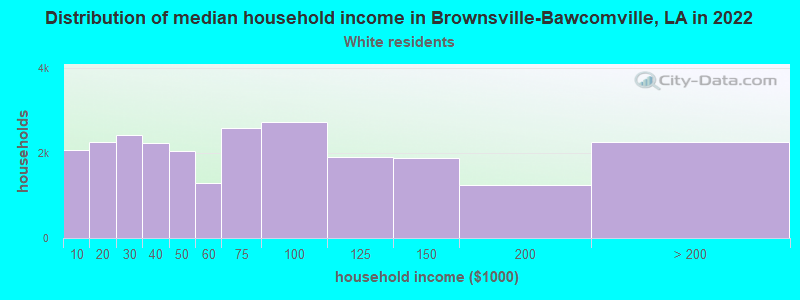
- $40,072White non-Hispanic householders
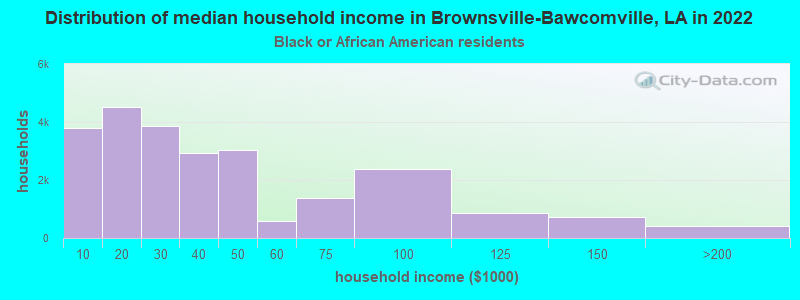
- $33,073Black householders
- $51,900Asian householders
- $82,461Some other race householders
- $15,374Two or more races householders
- $70,865Hispanic or Latino race householders
- Median 2022 house value
- $123,776White Non-Hispanic householders
- $107,160Black or African American householders
- $148,580Asian householders
- $156,527Native Hawaiian and other Pacific Islander householders
- $228,770Some other race householders
Household income for White non-Hispanic householders
Household income for Black householders
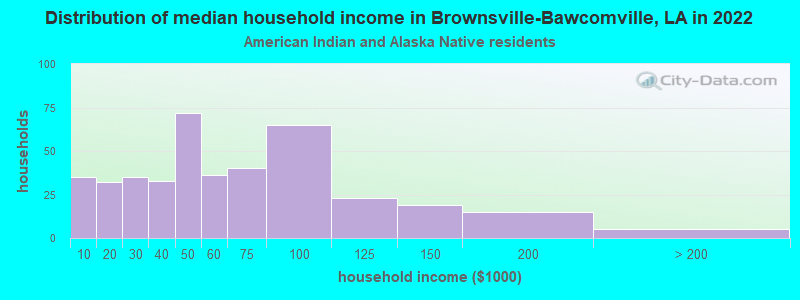
Household income for American Indian and Alaska Native householders
Household income for Asian householders
Household income for Native Hawaiian and other Pacific Islander householders
Household income for Two or more races householders
Household income for Hispanic or Latino race householders
Foreign-born residents in Brownsville-Bawcomville
93 residents are foreign born
| This city: | 1.2% |
| Louisiana: | 2.6% |
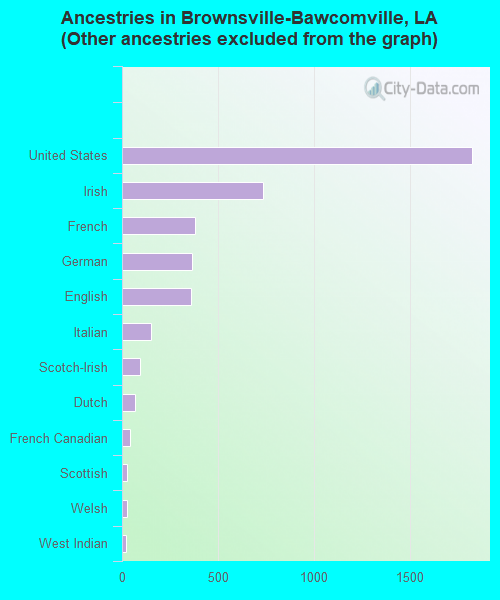
Ancestries in Brownsville-Bawcomville

- 2,34336.3%Other
- 1,82128.2%United States
- 73311.3%Irish
- 3825.9%French
- 3645.6%German
- 3605.6%English
- 1502.3%Italian
- 931.4%Scotch-Irish
- 701.1%Dutch
- 440.7%French Canadian
- 260.4%Scottish
- 250.4%Welsh
- 200.3%West Indian
- 110.2%Swedish
- 100.2%Russian
- 90.1%Polish
Zip codes: 71292.