Races in Brownsville, Florida (FL) Detailed Stats
Data:
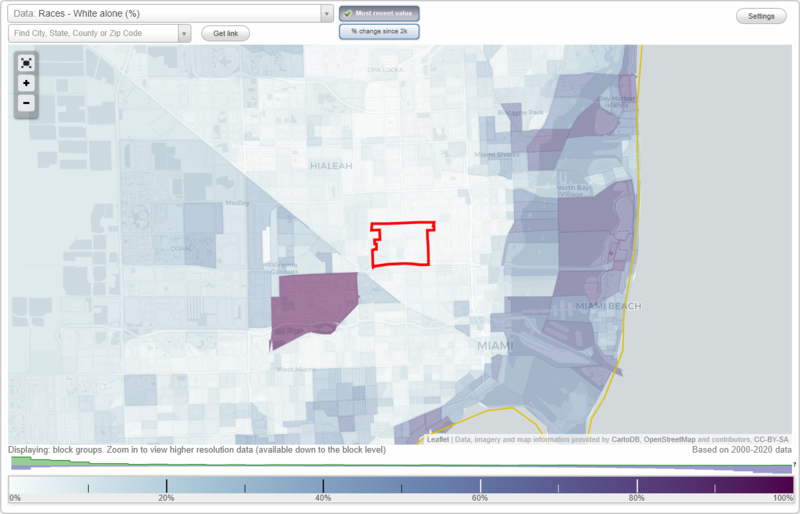
Races - White alone (%)
Races - White alone (% change since 2000)
Races - Black alone (%)
Races - Black alone (% change since 2000)
Races - American Indian alone (%)
Races - American Indian alone (% change since 2000)
Races - Asian alone (%)
Races - Asian alone (% change since 2000)
Races - Hispanic (%)
Races - Hispanic (% change since 2000)
Races - Native Hawaiian and Other Pacific Islander alone (%)
Races - Native Hawaiian and Other Pacific Islander alone (% change since 2000)
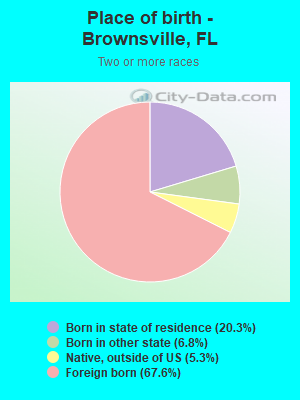
Races - Two or more races(%)
Races - Two or more races(% change since 2000)
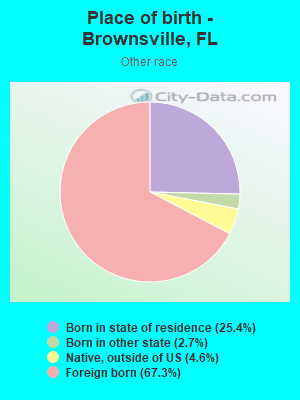
Races - Other race alone (%)
Races - Other race alone (% change since 2000)
Racial diversity
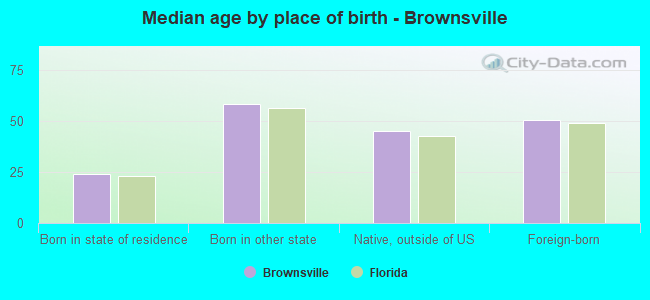
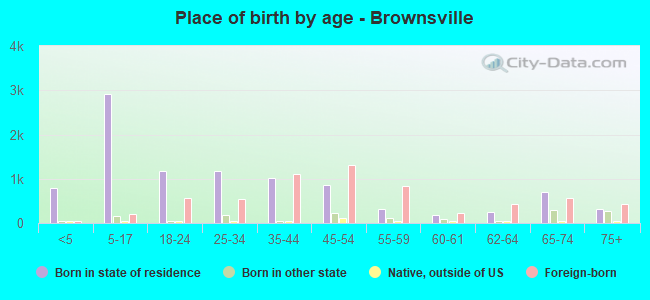
Place of birth - Born in state of residence (%)
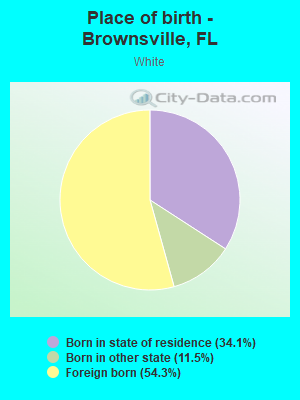
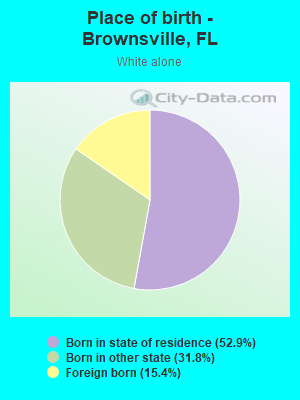
Place of birth - Born in state of residence (%) - White
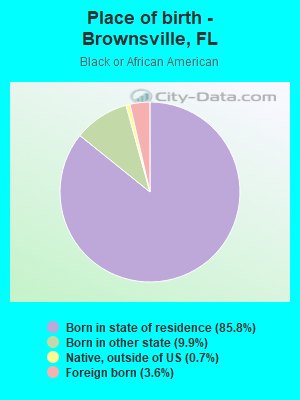
Place of birth - Born in state of residence (%) - Black or African American
Place of birth - Born in state of residence (%) - Asian
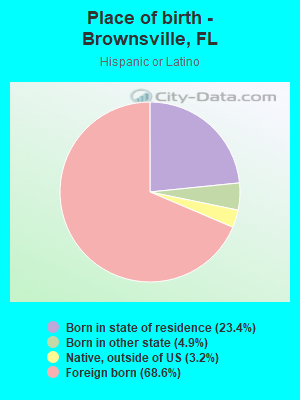
Place of birth - Born in state of residence (%) - Hispanic or Latino
Place of birth - Born in state of residence (%) - American Indian and Alaska Native
Place of birth - Born in state of residence (%) - Multirace
Place of birth - Born in state of residence (%) - Other Race
Place of birth - Born in other state (%)
Place of birth - Born in other state (%) - White
Place of birth - Born in other state (%) - Black or African American
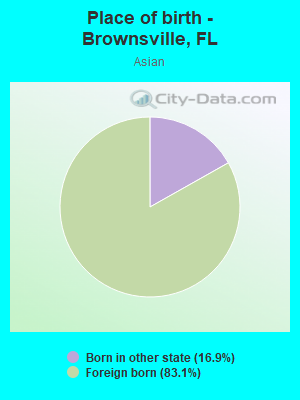
Place of birth - Born in other state (%) - Asian
Place of birth - Born in other state (%) - Hispanic or Latino
Place of birth - Born in other state (%) - American Indian and Alaska Native
Place of birth - Born in other state (%) - Multirace
Place of birth - Born in other state (%) - Other Race
Place of birth - Native, outside of US (%)
Place of birth - Native, outside of US (%) - White
Place of birth - Native, outside of US (%) - Black or African American
Place of birth - Native, outside of US (%) - Asian
Place of birth - Native, outside of US (%) - Hispanic or Latino
Place of birth - Native, outside of US (%) - American Indian and Alaska Native
Place of birth - Native, outside of US (%) - Multirace
Place of birth - Native, outside of US (%) - Other Race
Place of birth - Foreign born (%)
Place of birth - Foreign born (%) - White
Place of birth - Foreign born (%) - Black or African American
Place of birth - Foreign born (%) - Asian
Place of birth - Foreign born (%) - Hispanic or Latino
Place of birth - Foreign born (%) - American Indian and Alaska Native
Place of birth - Foreign born (%) - Multirace
Place of birth - Foreign born (%) - Other Race
Residents speaking English at home (%)
Residents speaking English at home - Born in the United States (%)
Residents speaking English at home - Native, born elsewhere (%)
Residents speaking English at home - Foreign born (%)
Residents speaking Spanish at home (%)
Residents speaking Spanish at home - Born in the United States (%)
Residents speaking Spanish at home - Native, born elsewhere (%)
Residents speaking Spanish at home - Foreign born (%)
Residents speaking other language at home (%)
Residents speaking other language at home - Born in the United States (%)
Residents speaking other language at home - Native, born elsewhere (%)
Residents speaking other language at home - Foreign born (%)
Marital status - Never married (%)
Marital status - Now married (%)
Marital status - Separated (%)
Marital status - Widowed (%)
Marital status - Divorced (%)
Ancestries Reported - Arab (%)
Ancestries Reported - Czech (%)
Ancestries Reported - Danish (%)
Ancestries Reported - Dutch (%)
Ancestries Reported - English (%)
Ancestries Reported - French (%)
Ancestries Reported - French Canadian (%)
Ancestries Reported - German (%)
Ancestries Reported - Greek (%)
Ancestries Reported - Hungarian (%)
Ancestries Reported - Irish (%)
Ancestries Reported - Italian (%)
Ancestries Reported - Lithuanian (%)
Ancestries Reported - Norwegian (%)
Ancestries Reported - Polish (%)
Ancestries Reported - Portuguese (%)
Ancestries Reported - Russian (%)
Ancestries Reported - Scotch-Irish (%)
Ancestries Reported - Scottish (%)
Ancestries Reported - Slovak (%)
Ancestries Reported - Subsaharan African (%)
Ancestries Reported - Swedish (%)
Ancestries Reported - Swiss (%)
Ancestries Reported - Ukrainian (%)
Ancestries Reported - United States (%)
Ancestries Reported - Welsh (%)
Ancestries Reported - West Indian (%)
Ancestries Reported - Other (%)
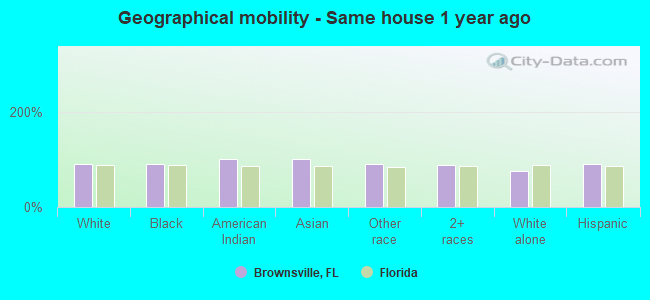
Geographical mobility - Same house 1 year ago (%)
Geographical mobility - Same house 1 year ago (%) - White
Geographical mobility - Same house 1 year ago (%) - Black or African American
Geographical mobility - Same house 1 year ago (%) - Asian
Geographical mobility - Same house 1 year ago (%) - Hispanic or Latino
Geographical mobility - Same house 1 year ago (%) - American Indian and Alaska Native
Geographical mobility - Same house 1 year ago (%) - Multirace
Geographical mobility - Same house 1 year ago (%) - Other Race
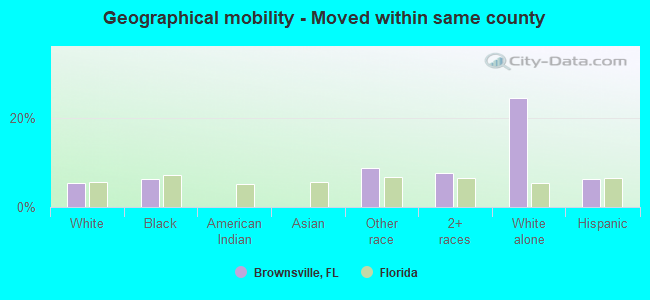
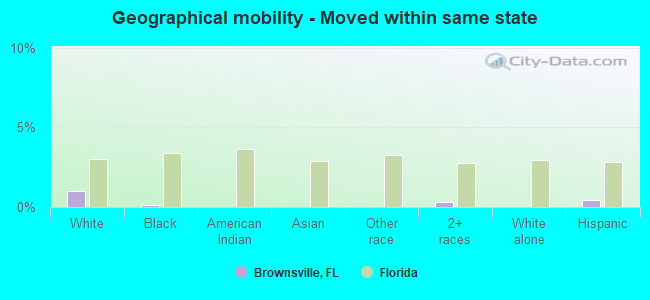
Geographical mobility - Moved within same county (%)
Geographical mobility - Moved within same county (%) - White
Geographical mobility - Moved within same county (%) - Black or African American
Geographical mobility - Moved within same county (%) - Asian
Geographical mobility - Moved within same county (%) - Hispanic or Latino
Geographical mobility - Moved within same county (%) - American Indian and Alaska Native
Geographical mobility - Moved within same county (%) - Multirace
Geographical mobility - Moved within same county (%) - Other Race
Geographical mobility - Moved from different county within same state (%)
Geographical mobility - Moved from different county within same state (%) - White
Geographical mobility - Moved from different county within same state (%) - Black or African American
Geographical mobility - Moved from different county within same state (%) - Asian
Geographical mobility - Moved from different county within same state (%) - Hispanic or Latino
Geographical mobility - Moved from different county within same state (%) - American Indian and Alaska Native
Geographical mobility - Moved from different county within same state (%) - Multirace
Geographical mobility - Moved from different county within same state (%) - Other Race
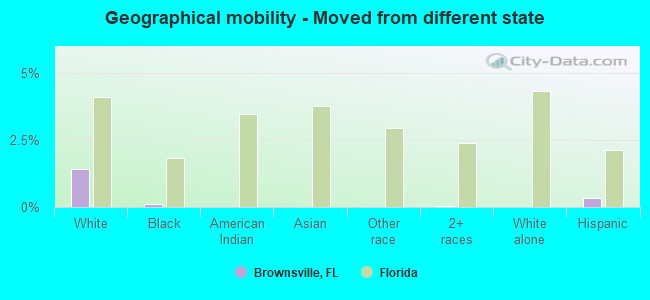
Geographical mobility - Moved from different state (%)
Geographical mobility - Moved from different state (%) - White
Geographical mobility - Moved from different state (%) - Black or African American
Geographical mobility - Moved from different state (%) - Asian
Geographical mobility - Moved from different state (%) - Hispanic or Latino
Geographical mobility - Moved from different state (%) - American Indian and Alaska Native
Geographical mobility - Moved from different state (%) - Multirace
Geographical mobility - Moved from different state (%) - Other Race
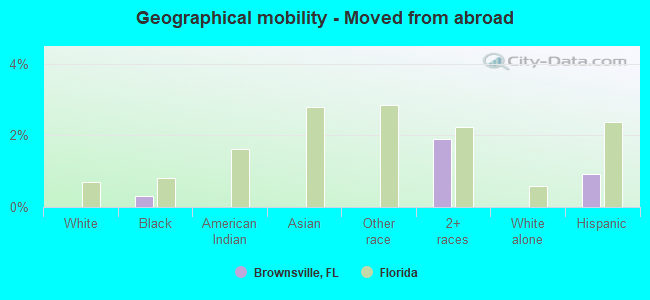
Geographical mobility - Moved from abroad (%)
Geographical mobility - Moved from abroad (%) - White
Geographical mobility - Moved from abroad (%) - Black or African American
Geographical mobility - Moved from abroad (%) - Asian
Geographical mobility - Moved from abroad (%) - Hispanic or Latino
Geographical mobility - Moved from abroad (%) - American Indian and Alaska Native
Geographical mobility - Moved from abroad (%) - Multirace
Geographical mobility - Moved from abroad (%) - Other Race
Place of birth for the foreign-born population - Ireland (%)
Place of birth for the foreign-born population - Denmark (%)
Place of birth for the foreign-born population - Norway (%)
Place of birth for the foreign-born population - Sweden (%)
Place of birth for the foreign-born population - United Kingdom (%)
Place of birth for the foreign-born population - England (%)
Place of birth for the foreign-born population - Scotland (%)
Place of birth for the foreign-born population - Other Northern Europe (%)
Place of birth for the foreign-born population - Austria (%)
Place of birth for the foreign-born population - Belgium (%)
Place of birth for the foreign-born population - France (%)
Place of birth for the foreign-born population - Germany (%)
Place of birth for the foreign-born population - Netherlands (%)
Place of birth for the foreign-born population - Switzerland (%)
Place of birth for the foreign-born population - Other Western Europe (%)
Place of birth for the foreign-born population - Greece (%)
Place of birth for the foreign-born population - Italy (%)
Place of birth for the foreign-born population - Portugal (%)
Place of birth for the foreign-born population - Spain (%)
Place of birth for the foreign-born population - Other Southern Europe (%)
Place of birth for the foreign-born population - Albania (%)
Place of birth for the foreign-born population - Belarus (%)
Place of birth for the foreign-born population - Bosnia and Herzegovina (%)
Place of birth for the foreign-born population - Bulgaria (%)
Place of birth for the foreign-born population - Croatia (%)
Place of birth for the foreign-born population - Czechoslovakia (%)
Place of birth for the foreign-born population - Hungary (%)
Place of birth for the foreign-born population - Latvia (%)
Place of birth for the foreign-born population - Lithuania (%)
Place of birth for the foreign-born population - North Macedonia (Macedonia) (%)
Place of birth for the foreign-born population - Moldova (%)
Place of birth for the foreign-born population - Poland (%)
Place of birth for the foreign-born population - Romania (%)
Place of birth for the foreign-born population - Russia (%)
Place of birth for the foreign-born population - Serbia (%)
Place of birth for the foreign-born population - Ukraine (%)
Place of birth for the foreign-born population - Other Eastern Europe (%)
Place of birth for the foreign-born population - China (%)
Place of birth for the foreign-born population - Hong Kong (%)
Place of birth for the foreign-born population - Taiwan (%)
Place of birth for the foreign-born population - Japan (%)
Place of birth for the foreign-born population - Korea (%)
Place of birth for the foreign-born population - Other Eastern Asia (%)
Place of birth for the foreign-born population - Afghanistan (%)
Place of birth for the foreign-born population - Bangladesh (%)
Place of birth for the foreign-born population - India (%)
Place of birth for the foreign-born population - Iran (%)
Place of birth for the foreign-born population - Kazakhstan (%)
Place of birth for the foreign-born population - Nepal (%)
Place of birth for the foreign-born population - Pakistan (%)
Place of birth for the foreign-born population - Sri Lanka (%)
Place of birth for the foreign-born population - Uzbekistan (%)
Place of birth for the foreign-born population - Other South Central Asia (%)
Place of birth for the foreign-born population - Burma (%)
Place of birth for the foreign-born population - Cambodia (%)
Place of birth for the foreign-born population - Indonesia (%)
Place of birth for the foreign-born population - Laos (%)
Place of birth for the foreign-born population - Malaysia (%)
Place of birth for the foreign-born population - Philippines (%)
Place of birth for the foreign-born population - Singapore (%)
Place of birth for the foreign-born population - Thailand (%)
Place of birth for the foreign-born population - Vietnam (%)
Place of birth for the foreign-born population - Other South Eastern Asia (%)
Place of birth for the foreign-born population - Armenia (%)
Place of birth for the foreign-born population - Iraq (%)
Place of birth for the foreign-born population - Israel (%)
Place of birth for the foreign-born population - Jordan (%)
Place of birth for the foreign-born population - Kuwait (%)
Place of birth for the foreign-born population - Lebanon (%)
Place of birth for the foreign-born population - Saudi Arabia (%)
Place of birth for the foreign-born population - Syria (%)
Place of birth for the foreign-born population - Turkey (%)
Place of birth for the foreign-born population - Yemen (%)
Place of birth for the foreign-born population - Other Western Asia (%)
Place of birth for the foreign-born population - Eritrea (%)
Place of birth for the foreign-born population - Ethiopia (%)
Place of birth for the foreign-born population - Kenya (%)
Place of birth for the foreign-born population - Somalia (%)
Place of birth for the foreign-born population - Uganda (%)
Place of birth for the foreign-born population - Zimbabwe (%)
Place of birth for the foreign-born population - Other Eastern Africa (%)
Place of birth for the foreign-born population - Cameroon (%)
Place of birth for the foreign-born population - Congo (%)
Place of birth for the foreign-born population - Democratic Republic of Congo (Zaire) (%)
Place of birth for the foreign-born population - Other Middle Africa (%)
Place of birth for the foreign-born population - Egypt (%)
Place of birth for the foreign-born population - Morocco (%)
Place of birth for the foreign-born population - Sudan (%)
Place of birth for the foreign-born population - Other Northern Africa (%)
Place of birth for the foreign-born population - South Africa (%)
Place of birth for the foreign-born population - Other Southern Africa (%)
Place of birth for the foreign-born population - Cabo Verde (%)
Place of birth for the foreign-born population - Ghana (%)
Place of birth for the foreign-born population - Liberia (%)
Place of birth for the foreign-born population - Nigeria (%)
Place of birth for the foreign-born population - Senegal (%)
Place of birth for the foreign-born population - Sierra Leone (%)
Place of birth for the foreign-born population - Other Western Africa (%)
Place of birth for the foreign-born population - Australia (%)
Place of birth for the foreign-born population - New Zealand (%)
Place of birth for the foreign-born population - Fiji (%)
Place of birth for the foreign-born population - Micronesia (%)
Place of birth for the foreign-born population - Bahamas (%)
Place of birth for the foreign-born population - Barbados (%)
Place of birth for the foreign-born population - Cuba (%)
Place of birth for the foreign-born population - Dominica (%)
Place of birth for the foreign-born population - Dominican Republic (%)
Place of birth for the foreign-born population - Grenada (%)
Place of birth for the foreign-born population - Haiti (%)
Place of birth for the foreign-born population - Jamaica (%)
Place of birth for the foreign-born population - St. Vincent and the Grenadines (%)
Place of birth for the foreign-born population - Trinidad and Tobago (%)
Place of birth for the foreign-born population - West Indies (%)
Place of birth for the foreign-born population - Other Caribbean (%)
Place of birth for the foreign-born population - Belize (%)
Place of birth for the foreign-born population - Costa Rica (%)
Place of birth for the foreign-born population - El Salvador (%)
Place of birth for the foreign-born population - Guatemala (%)
Place of birth for the foreign-born population - Honduras (%)
Place of birth for the foreign-born population - Mexico (%)
Place of birth for the foreign-born population - Nicaragua (%)
Place of birth for the foreign-born population - Panama (%)
Place of birth for the foreign-born population - Other Central America (%)
Place of birth for the foreign-born population - Argentina (%)
Place of birth for the foreign-born population - Bolivia (%)
Place of birth for the foreign-born population - Brazil (%)
Place of birth for the foreign-born population - Chile (%)
Place of birth for the foreign-born population - Colombia (%)
Place of birth for the foreign-born population - Ecuador (%)
Place of birth for the foreign-born population - Guyana (%)
Place of birth for the foreign-born population - Peru (%)
Place of birth for the foreign-born population - Uruguay (%)
Place of birth for the foreign-born population - Venezuela (%)
Place of birth for the foreign-born population - Other South America (%)
Place of birth for the foreign-born population - Canada (%)
Place of birth for the foreign-born population - Other Northern America (%)
Place of birth for the foreign-born population - Other (%)
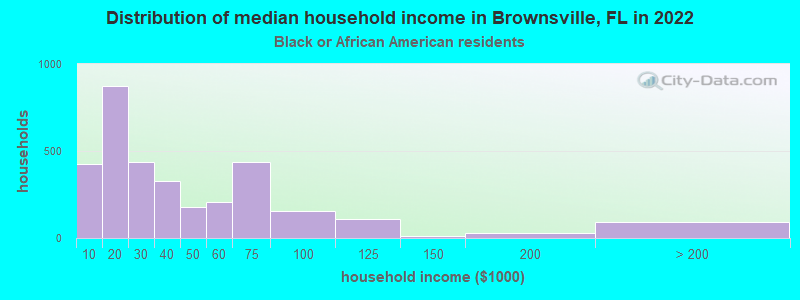
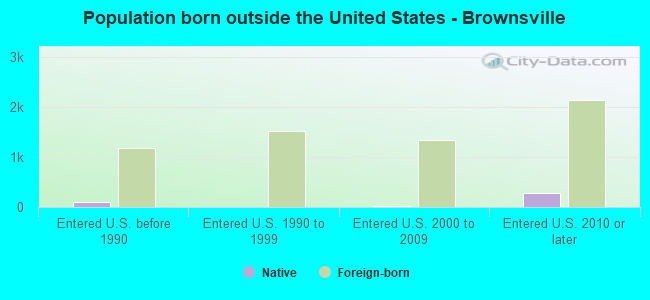
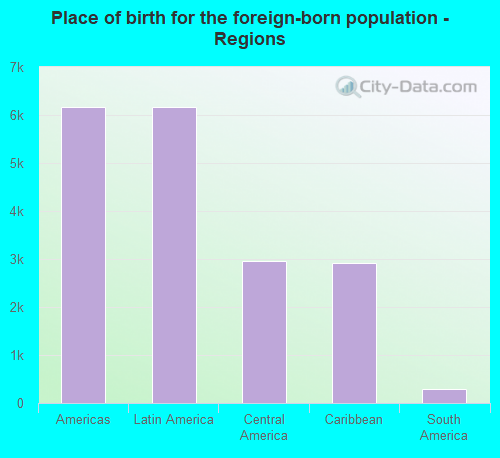
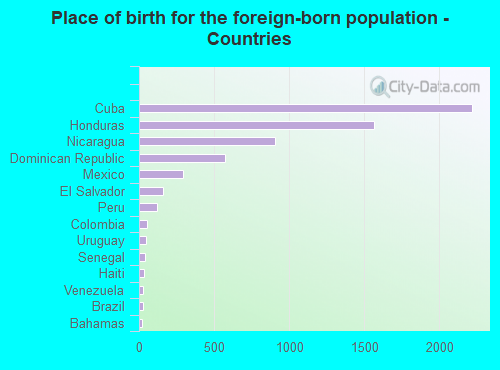
According to 2022 data, the most numerous races in Brownsville, FL are White alone (197 residents), Hispanic (8,765 residents), and Black alone (8,336 residents). 50.0% of Brownsville residents speak English at home. 35.2% of Brownsville, FL residents are foreign-born (34.6% born in Latin America), which is 40.4% greater than the foreign-born rate of 21.0% across the entire state of Florida.
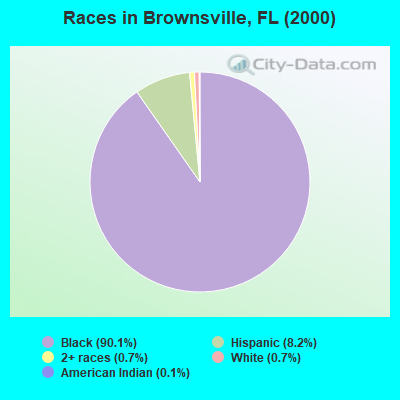
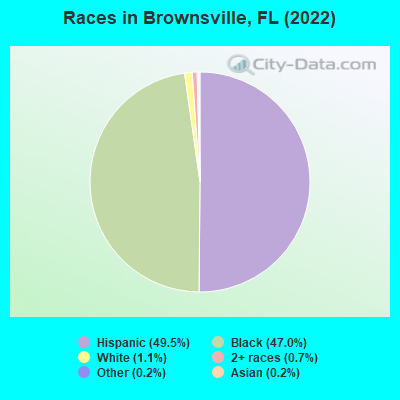
Race distribution in Brownsville
2000 2022
10,458,509 65.4% White alone 2,682,715 16.8% Hispanic 2,264,268 14.2% Black alone 261,693 1.6% Asian alone 236,954 1.5% Two or more races 42,358 0.3% American Indian alone 28,994 0.2% Other race alone 6,887 0.04% Native Hawaiian and Other
11,309,403 50.8% White alone 6,025,039 27.1% Hispanic 3,241,015 14.6% Black alone 861,630 3.9% Two or more races 623,692 2.8% Asian alone 152,054 0.7% Other race alone 22,504 0.1% American Indian alone 9,486 0.04% Native Hawaiian and Other
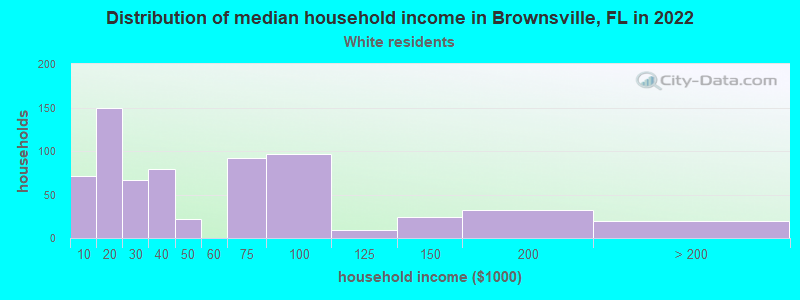
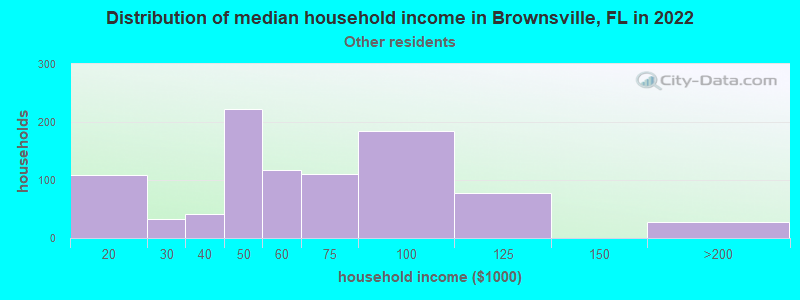
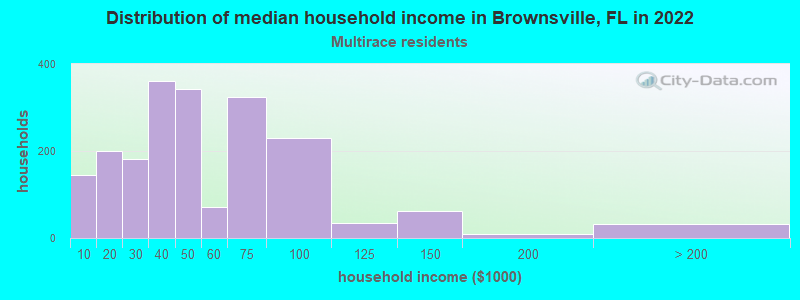
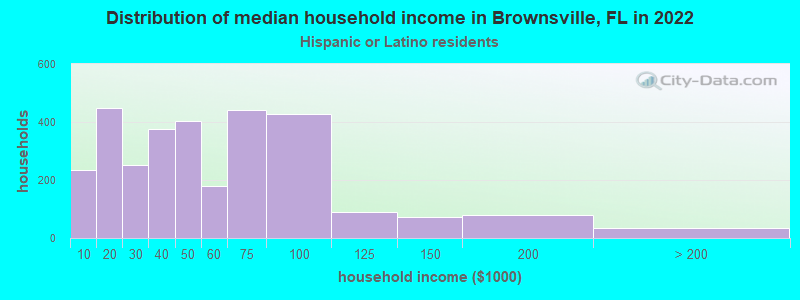
Income and house value in Brownsville Median household income in 2022 $30,067 Black householders$58,154 Some other race householders$41,361 Two or more races householders$43,427 Hispanic or Latino race householdersMedian 2022 house value $625,558 White Non-Hispanic householders$287,293 Black or African American householders $486,545 Asian householders$347,532 Some other race householders$252,540 Two or more races householders$352,166 Hispanic or Latino householders
Median age by race in Brownsville
37.1 Median age for White residents34.7 37.3 35.3 Median age for Black or African American residents32.4 36.1 -653,446,647.1 Median age for American Indian / Alaska Native residents-543,352,600.6 -762,696,213.5 28.1 Median age for Asian residents-697,674,417.9 27.3 -679,849,340.2 Median age for Native Hawaiian / Pacific Islander residents-858,307,848.3 -443,298,968.6 43.6 Median age for Other race residents44.4 41.6 41.1 Median age for Two or more races residents42.7 39.2 33.6 Median age for White alone residents37.0 30.2 41.7 Median age for Hispanic or Latino residents42.6 40.6
Owner/renter occupied households by race in Brownsville
House owners and renters - White residents 299 42.4% Owner occupied406 57.6% Renter occupiedHouse owners and renters - Black or African American residents 955 27.6% Owner occupied2,508 72.4% Renter occupiedHouse owners and renters - American Indian / Alaska Native residents 2 100.0% Owner occupiedHouse owners and renters - Asian residents 4 100.0% Renter occupiedHouse owners and renters - Other race residents 263 29.9% Owner occupied618 70.1% Renter occupiedHouse owners and renters - Two or more races residents 866 44.1% Owner occupied1,099 55.9% Renter occupiedHouse owners and renters - White alone residents 24 70.9% Owner occupied10 29.1% Renter occupiedHouse owners and renters - Hispanic or Latino residents 1,184 38.6% Owner occupied1,883 61.4% Renter occupied
Language usage in Brownsville
English speakers - Total 50.0% of residents of Brownsville speak English at home.
48.5% of residents speak Spanish at home 3,675 45.0% Speak English very well4,495 55.0% Speak English less than very well1.8% of residents speak other language at home 257 83.2% Speak English very well52 16.8% Speak English less than very well
English speakers - Born in the United States 72.6% of residents of Brownsville speak English at home.
26.6% of residents speak Spanish at home 318 83.7% Speak English very well62 16.3% Speak English less than very well0.3% of residents speak other language at home 4 100.0% Speak English very well
English speakers - Native, born elsewhere 25.1% of residents of Brownsville speak English at home.
76.0% of residents speak Spanish at home 117 46.1% Speak English very well137 53.9% Speak English less than very well
English speakers - Foreign-born 8.0% of residents of Brownsville speak English at home.
90.9% of residents speak Spanish at home 1,432 25.3% Speak English very well4,234 74.7% Speak English less than very well1.6% of residents speak other language at home 52 51.0% Speak English very well50 49.0% Speak English less than very well
White (Caucasian) - Speak only English Native:
14.5% (125)Foreign-born:
14.1% (143)
White (Caucasian) - Speak another language Native:
71.3% (617)Foreign-born:
87.5% (893)
Black or African American - Speak only English Native:
96.8% (7,181)Foreign-born:
43.5% (127)
Black or African American - Speak another language Native:
3.2% (238)Foreign-born:
58.1% (170)
Asian - Speak another language Native:
97.1% (4)Foreign-born:
100.0% (25)
Other race - Speak only English Native:
7.5% (59)Foreign-born:
1.3% (24)
Other race - Speak another language Native:
92.4% (735)Foreign-born:
98.8% (1,847)
Two or more races - Speak only English Native:
9.6% (152)Foreign-born:
5.8% (201)
Two or more races - Speak another language Native:
90.6% (1,428)Foreign-born:
94.4% (3,279)
White alone - Speak only English Native:
58.2% (87)Foreign-born:
32.0% (9)
White alone - Speak another language Native:
40.7% (61)Foreign-born:
69.4% (21)
Hispanic or Latino - Speak only English Native:
3.7% (95)Foreign-born:
6.2% (372)
Hispanic or Latino - Speak another language Native:
95.7% (2,432)Foreign-born:
93.9% (5,640)
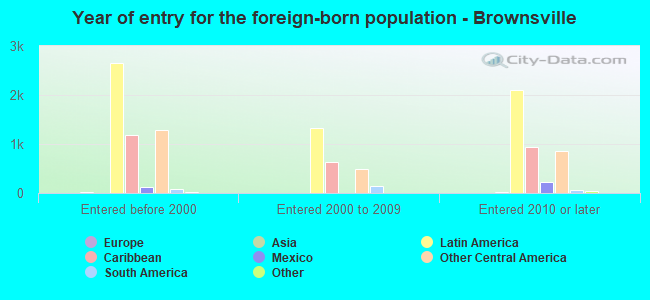
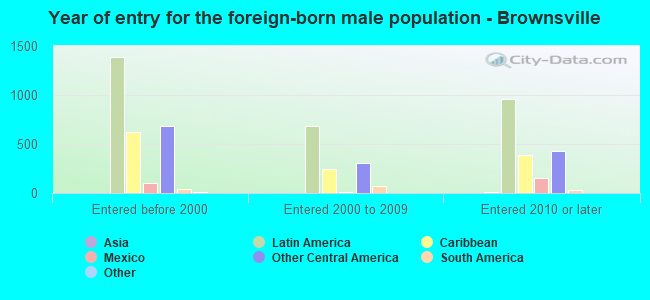
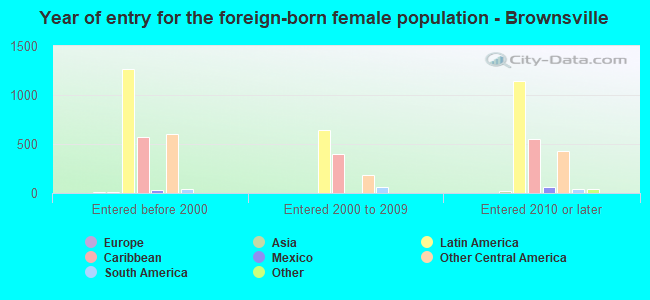
Foreign-born residents in Brownsville 6,245 residents are foreign born (34.6% Latin America ).
This city:
35.2%Florida:
21.1%
Marital status for residents in Brownsville Marital status - White (Caucasian) population 15 years and over
Males 44.7% Never married45.6% Now married1.1% Separated0.6% Widowed8.0% DivorcedFemales 44.9% Never married26.7% Now married4.8% Separated5.2% Widowed18.3% DivorcedWomen who gave birth in the past 12 months Now married:
0.0% (0)Unmarried:
100.0% (13)
Women who did not give birth in the past 12 months Now married:
23.4% (132)Unmarried:
76.6% (433)
Marital status - Black or African American population 15 years and over
Males 48.8% Never married23.5% Now married0.7% Separated4.5% Widowed22.4% DivorcedFemales 62.0% Never married18.5% Now married4.5% Separated5.8% Widowed9.3% DivorcedWomen who gave birth in the past 12 months Now married:
16.3% (19)Unmarried:
83.7% (100)
Women who did not give birth in the past 12 months Now married:
20.0% (376)Unmarried:
80.0% (1,509)
Marital status - Other race population 15 years and over
Males 36.6% Never married39.3% Now married11.3% Separated4.9% Widowed8.0% DivorcedFemales 47.7% Never married23.3% Now married2.5% Separated0.0% Widowed26.4% DivorcedWomen who did not give birth in the past 12 months Now married:
22.5% (139)Unmarried:
77.5% (481)
Marital status - Two or more races population 15 years and over
Males 36.0% Never married47.3% Now married9.7% Separated4.3% Widowed2.7% DivorcedFemales 40.1% Never married28.1% Now married0.0% Separated9.8% Widowed22.0% DivorcedWomen who did not give birth in the past 12 months Now married:
14.1% (197)Unmarried:
85.9% (1,199)
Marital status - White alone, not Hispanic / Latino population 15 years and over
Males 0.0% Never married93.9% Now married0.0% Separated0.0% Widowed6.1% DivorcedFemales 44.7% Never married26.3% Now married7.9% Separated15.8% Widowed5.3% DivorcedWomen who did not give birth in the past 12 months Now married:
19.0% (12)Unmarried:
81.0% (49)
Marital status - Hispanic or Latino population 15 years and over
Males 39.1% Never married44.1% Now married6.7% Separated3.9% Widowed6.1% DivorcedFemales 43.9% Never married26.9% Now married2.5% Separated5.7% Widowed21.1% DivorcedWomen who gave birth in the past 12 months Now married:
0.0% (0)Unmarried:
100.0% (22)
Women who did not give birth in the past 12 months Now married:
19.9% (447)Unmarried:
80.1% (1,793)
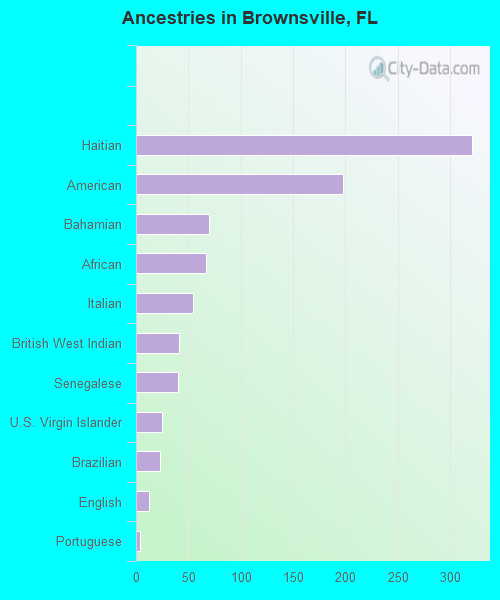
Ancestries in Brownsville
321 2.3% Haitian198 1.4% American70 0.5% Bahamian67 0.5% African54 0.4% Italian41 0.3% British West Indian40 0.3% Senegalese25 0.2% U.S. Virgin Islander23 0.2% Brazilian12 0.08% English4 0.03% Portuguese1 0.01% Irish
Children Nativity (place of birth) in Brownsville
Children under 6 years - Living with two parents Both parents native 62 100.0% NativeBoth parents foreign-born 72 100.0% NativeOne native, one foreign-born parent 18 100.0% NativeChildren under 6 years - Living with one parent Native parent 759 100.0% NativeForeign-born parent 91 100.0% NativeChildren 6 to 17 years - Living with two parents Both parents native 176 100.0% NativeBoth parents foreign-born 314 93.8% Native21 6.2% Foreign-bornOne native, one foreign-born parent 139 68.3% Native64 31.7% Foreign-bornChildren 6 to 17 years - Living with one parent Native parent 1,228 100.0% NativeForeign-born parent 890 54.4% Native748 45.6% Foreign-born
Grandparents responsible for own grandchildren in Brownsville
Grandparents (30 to 59 years) White / Caucasian 31 100.0% Not responsible for grandchildrenBlack or African American 52 66.7% Responsible for grandchildren26 33.3% Not responsible for grandchildrenOther race 89 100.0% Not responsible for grandchildrenTwo or more races 329 100.0% Not responsible for grandchildrenHispanic or Latino 287 100.0% Not responsible for grandchildrenGrandparents (60 years and over) White / Caucasian 36 69.3% Responsible for grandchildren16 30.7% Not responsible for grandchildrenBlack or African American 18 13.5% Responsible for grandchildren113 86.5% Not responsible for grandchildrenOther race 31 100.0% Not responsible for grandchildrenTwo or more races 114 100.0% Not responsible for grandchildrenHispanic or Latino 72 38.7% Responsible for grandchildren115 61.3% Not responsible for grandchildren