Races in Brushy Creek, Texas (TX) Detailed Stats
Data:
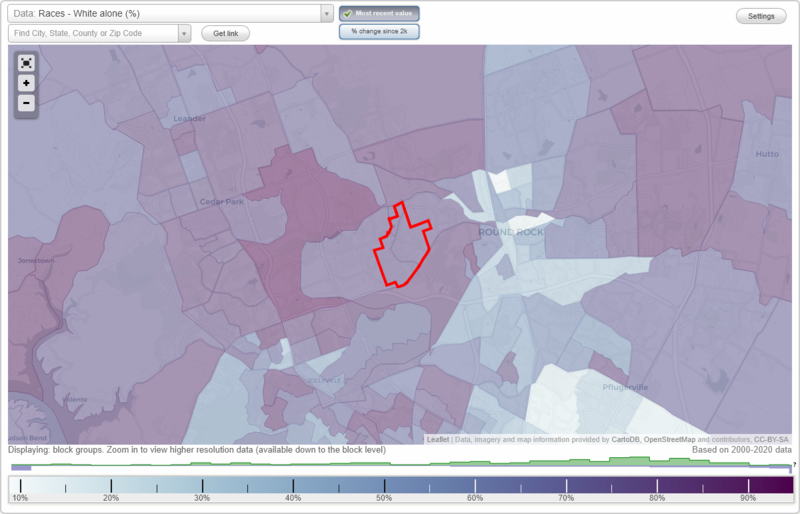
Races - White alone (%)
Races - White alone (% change since 2000)
Races - Black alone (%)
Races - Black alone (% change since 2000)
Races - American Indian alone (%)
Races - American Indian alone (% change since 2000)
Races - Asian alone (%)
Races - Asian alone (% change since 2000)
Races - Hispanic (%)
Races - Hispanic (% change since 2000)
Races - Native Hawaiian and Other Pacific Islander alone (%)
Races - Native Hawaiian and Other Pacific Islander alone (% change since 2000)
Races - Two or more races(%)
Races - Two or more races(% change since 2000)
Races - Other race alone (%)
Races - Other race alone (% change since 2000)
Racial diversity
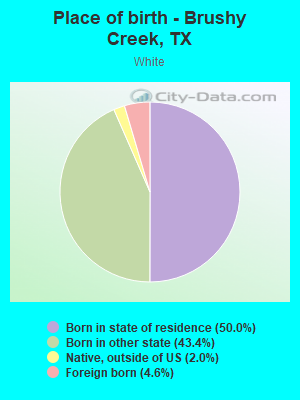
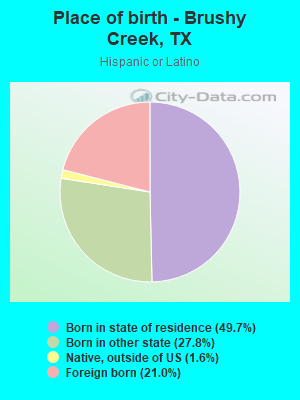
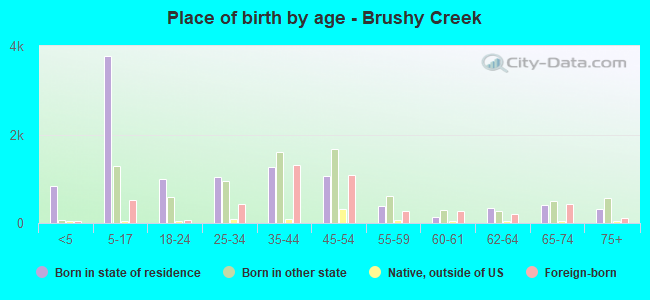
Place of birth - Born in state of residence (%)
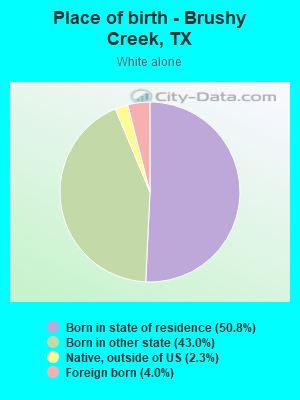
Place of birth - Born in state of residence (%) - White
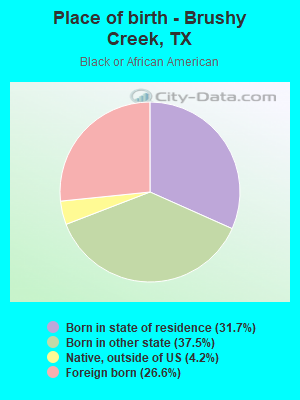
Place of birth - Born in state of residence (%) - Black or African American
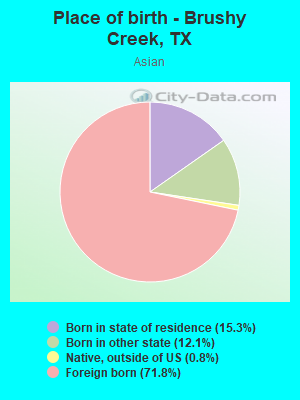
Place of birth - Born in state of residence (%) - Asian
Place of birth - Born in state of residence (%) - Hispanic or Latino
Place of birth - Born in state of residence (%) - American Indian and Alaska Native
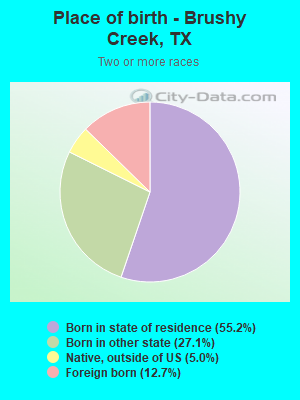
Place of birth - Born in state of residence (%) - Multirace
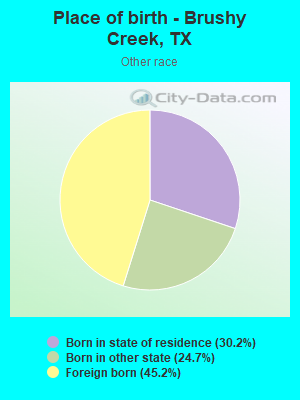
Place of birth - Born in state of residence (%) - Other Race
Place of birth - Born in other state (%)
Place of birth - Born in other state (%) - White
Place of birth - Born in other state (%) - Black or African American
Place of birth - Born in other state (%) - Asian
Place of birth - Born in other state (%) - Hispanic or Latino
Place of birth - Born in other state (%) - American Indian and Alaska Native
Place of birth - Born in other state (%) - Multirace
Place of birth - Born in other state (%) - Other Race
Place of birth - Native, outside of US (%)
Place of birth - Native, outside of US (%) - White
Place of birth - Native, outside of US (%) - Black or African American
Place of birth - Native, outside of US (%) - Asian
Place of birth - Native, outside of US (%) - Hispanic or Latino
Place of birth - Native, outside of US (%) - American Indian and Alaska Native
Place of birth - Native, outside of US (%) - Multirace
Place of birth - Native, outside of US (%) - Other Race
Place of birth - Foreign born (%)
Place of birth - Foreign born (%) - White
Place of birth - Foreign born (%) - Black or African American
Place of birth - Foreign born (%) - Asian
Place of birth - Foreign born (%) - Hispanic or Latino
Place of birth - Foreign born (%) - American Indian and Alaska Native
Place of birth - Foreign born (%) - Multirace
Place of birth - Foreign born (%) - Other Race
Residents speaking English at home (%)
Residents speaking English at home - Born in the United States (%)
Residents speaking English at home - Native, born elsewhere (%)
Residents speaking English at home - Foreign born (%)
Residents speaking Spanish at home (%)
Residents speaking Spanish at home - Born in the United States (%)
Residents speaking Spanish at home - Native, born elsewhere (%)
Residents speaking Spanish at home - Foreign born (%)
Residents speaking other language at home (%)
Residents speaking other language at home - Born in the United States (%)
Residents speaking other language at home - Native, born elsewhere (%)
Residents speaking other language at home - Foreign born (%)
Marital status - Never married (%)
Marital status - Now married (%)
Marital status - Separated (%)
Marital status - Widowed (%)
Marital status - Divorced (%)
Ancestries Reported - Arab (%)
Ancestries Reported - Czech (%)
Ancestries Reported - Danish (%)
Ancestries Reported - Dutch (%)
Ancestries Reported - English (%)
Ancestries Reported - French (%)
Ancestries Reported - French Canadian (%)
Ancestries Reported - German (%)
Ancestries Reported - Greek (%)
Ancestries Reported - Hungarian (%)
Ancestries Reported - Irish (%)
Ancestries Reported - Italian (%)
Ancestries Reported - Lithuanian (%)
Ancestries Reported - Norwegian (%)
Ancestries Reported - Polish (%)
Ancestries Reported - Portuguese (%)
Ancestries Reported - Russian (%)
Ancestries Reported - Scotch-Irish (%)
Ancestries Reported - Scottish (%)
Ancestries Reported - Slovak (%)
Ancestries Reported - Subsaharan African (%)
Ancestries Reported - Swedish (%)
Ancestries Reported - Swiss (%)
Ancestries Reported - Ukrainian (%)
Ancestries Reported - United States (%)
Ancestries Reported - Welsh (%)
Ancestries Reported - West Indian (%)
Ancestries Reported - Other (%)
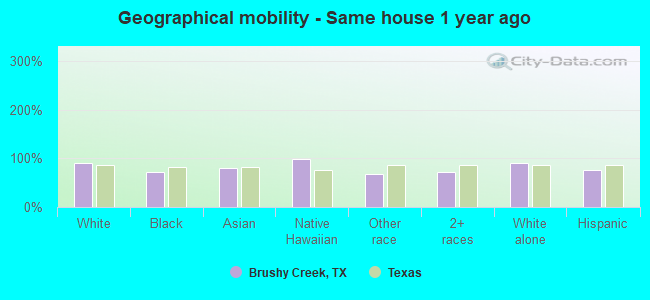
Geographical mobility - Same house 1 year ago (%)
Geographical mobility - Same house 1 year ago (%) - White
Geographical mobility - Same house 1 year ago (%) - Black or African American
Geographical mobility - Same house 1 year ago (%) - Asian
Geographical mobility - Same house 1 year ago (%) - Hispanic or Latino
Geographical mobility - Same house 1 year ago (%) - American Indian and Alaska Native
Geographical mobility - Same house 1 year ago (%) - Multirace
Geographical mobility - Same house 1 year ago (%) - Other Race
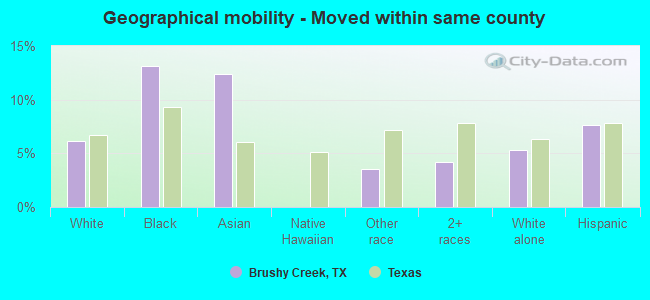
Geographical mobility - Moved within same county (%)
Geographical mobility - Moved within same county (%) - White
Geographical mobility - Moved within same county (%) - Black or African American
Geographical mobility - Moved within same county (%) - Asian
Geographical mobility - Moved within same county (%) - Hispanic or Latino
Geographical mobility - Moved within same county (%) - American Indian and Alaska Native
Geographical mobility - Moved within same county (%) - Multirace
Geographical mobility - Moved within same county (%) - Other Race
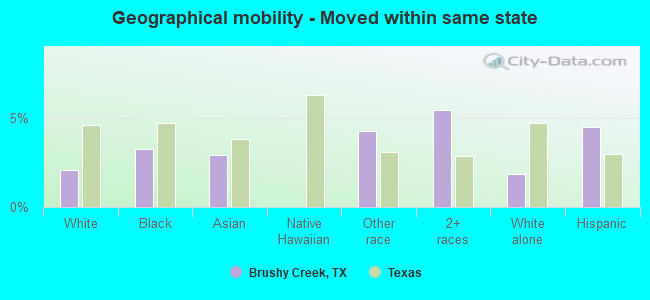
Geographical mobility - Moved from different county within same state (%)
Geographical mobility - Moved from different county within same state (%) - White
Geographical mobility - Moved from different county within same state (%) - Black or African American
Geographical mobility - Moved from different county within same state (%) - Asian
Geographical mobility - Moved from different county within same state (%) - Hispanic or Latino
Geographical mobility - Moved from different county within same state (%) - American Indian and Alaska Native
Geographical mobility - Moved from different county within same state (%) - Multirace
Geographical mobility - Moved from different county within same state (%) - Other Race
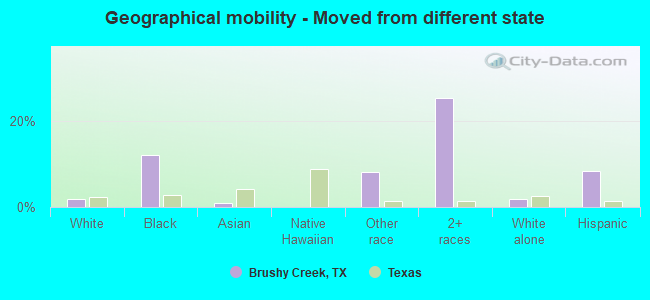
Geographical mobility - Moved from different state (%)
Geographical mobility - Moved from different state (%) - White
Geographical mobility - Moved from different state (%) - Black or African American
Geographical mobility - Moved from different state (%) - Asian
Geographical mobility - Moved from different state (%) - Hispanic or Latino
Geographical mobility - Moved from different state (%) - American Indian and Alaska Native
Geographical mobility - Moved from different state (%) - Multirace
Geographical mobility - Moved from different state (%) - Other Race
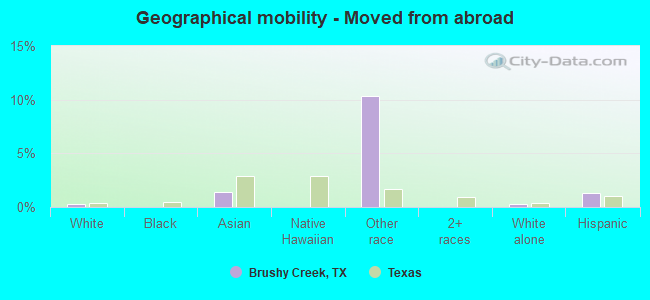
Geographical mobility - Moved from abroad (%)
Geographical mobility - Moved from abroad (%) - White
Geographical mobility - Moved from abroad (%) - Black or African American
Geographical mobility - Moved from abroad (%) - Asian
Geographical mobility - Moved from abroad (%) - Hispanic or Latino
Geographical mobility - Moved from abroad (%) - American Indian and Alaska Native
Geographical mobility - Moved from abroad (%) - Multirace
Geographical mobility - Moved from abroad (%) - Other Race
Place of birth for the foreign-born population - Ireland (%)
Place of birth for the foreign-born population - Denmark (%)
Place of birth for the foreign-born population - Norway (%)
Place of birth for the foreign-born population - Sweden (%)
Place of birth for the foreign-born population - United Kingdom (%)
Place of birth for the foreign-born population - England (%)
Place of birth for the foreign-born population - Scotland (%)
Place of birth for the foreign-born population - Other Northern Europe (%)
Place of birth for the foreign-born population - Austria (%)
Place of birth for the foreign-born population - Belgium (%)
Place of birth for the foreign-born population - France (%)
Place of birth for the foreign-born population - Germany (%)
Place of birth for the foreign-born population - Netherlands (%)
Place of birth for the foreign-born population - Switzerland (%)
Place of birth for the foreign-born population - Other Western Europe (%)
Place of birth for the foreign-born population - Greece (%)
Place of birth for the foreign-born population - Italy (%)
Place of birth for the foreign-born population - Portugal (%)
Place of birth for the foreign-born population - Spain (%)
Place of birth for the foreign-born population - Other Southern Europe (%)
Place of birth for the foreign-born population - Albania (%)
Place of birth for the foreign-born population - Belarus (%)
Place of birth for the foreign-born population - Bosnia and Herzegovina (%)
Place of birth for the foreign-born population - Bulgaria (%)
Place of birth for the foreign-born population - Croatia (%)
Place of birth for the foreign-born population - Czechoslovakia (%)
Place of birth for the foreign-born population - Hungary (%)
Place of birth for the foreign-born population - Latvia (%)
Place of birth for the foreign-born population - Lithuania (%)
Place of birth for the foreign-born population - North Macedonia (Macedonia) (%)
Place of birth for the foreign-born population - Moldova (%)
Place of birth for the foreign-born population - Poland (%)
Place of birth for the foreign-born population - Romania (%)
Place of birth for the foreign-born population - Russia (%)
Place of birth for the foreign-born population - Serbia (%)
Place of birth for the foreign-born population - Ukraine (%)
Place of birth for the foreign-born population - Other Eastern Europe (%)
Place of birth for the foreign-born population - China (%)
Place of birth for the foreign-born population - Hong Kong (%)
Place of birth for the foreign-born population - Taiwan (%)
Place of birth for the foreign-born population - Japan (%)
Place of birth for the foreign-born population - Korea (%)
Place of birth for the foreign-born population - Other Eastern Asia (%)
Place of birth for the foreign-born population - Afghanistan (%)
Place of birth for the foreign-born population - Bangladesh (%)
Place of birth for the foreign-born population - India (%)
Place of birth for the foreign-born population - Iran (%)
Place of birth for the foreign-born population - Kazakhstan (%)
Place of birth for the foreign-born population - Nepal (%)
Place of birth for the foreign-born population - Pakistan (%)
Place of birth for the foreign-born population - Sri Lanka (%)
Place of birth for the foreign-born population - Uzbekistan (%)
Place of birth for the foreign-born population - Other South Central Asia (%)
Place of birth for the foreign-born population - Burma (%)
Place of birth for the foreign-born population - Cambodia (%)
Place of birth for the foreign-born population - Indonesia (%)
Place of birth for the foreign-born population - Laos (%)
Place of birth for the foreign-born population - Malaysia (%)
Place of birth for the foreign-born population - Philippines (%)
Place of birth for the foreign-born population - Singapore (%)
Place of birth for the foreign-born population - Thailand (%)
Place of birth for the foreign-born population - Vietnam (%)
Place of birth for the foreign-born population - Other South Eastern Asia (%)
Place of birth for the foreign-born population - Armenia (%)
Place of birth for the foreign-born population - Iraq (%)
Place of birth for the foreign-born population - Israel (%)
Place of birth for the foreign-born population - Jordan (%)
Place of birth for the foreign-born population - Kuwait (%)
Place of birth for the foreign-born population - Lebanon (%)
Place of birth for the foreign-born population - Saudi Arabia (%)
Place of birth for the foreign-born population - Syria (%)
Place of birth for the foreign-born population - Turkey (%)
Place of birth for the foreign-born population - Yemen (%)
Place of birth for the foreign-born population - Other Western Asia (%)
Place of birth for the foreign-born population - Eritrea (%)
Place of birth for the foreign-born population - Ethiopia (%)
Place of birth for the foreign-born population - Kenya (%)
Place of birth for the foreign-born population - Somalia (%)
Place of birth for the foreign-born population - Uganda (%)
Place of birth for the foreign-born population - Zimbabwe (%)
Place of birth for the foreign-born population - Other Eastern Africa (%)
Place of birth for the foreign-born population - Cameroon (%)
Place of birth for the foreign-born population - Congo (%)
Place of birth for the foreign-born population - Democratic Republic of Congo (Zaire) (%)
Place of birth for the foreign-born population - Other Middle Africa (%)
Place of birth for the foreign-born population - Egypt (%)
Place of birth for the foreign-born population - Morocco (%)
Place of birth for the foreign-born population - Sudan (%)
Place of birth for the foreign-born population - Other Northern Africa (%)
Place of birth for the foreign-born population - South Africa (%)
Place of birth for the foreign-born population - Other Southern Africa (%)
Place of birth for the foreign-born population - Cabo Verde (%)
Place of birth for the foreign-born population - Ghana (%)
Place of birth for the foreign-born population - Liberia (%)
Place of birth for the foreign-born population - Nigeria (%)
Place of birth for the foreign-born population - Senegal (%)
Place of birth for the foreign-born population - Sierra Leone (%)
Place of birth for the foreign-born population - Other Western Africa (%)
Place of birth for the foreign-born population - Australia (%)
Place of birth for the foreign-born population - New Zealand (%)
Place of birth for the foreign-born population - Fiji (%)
Place of birth for the foreign-born population - Micronesia (%)
Place of birth for the foreign-born population - Bahamas (%)
Place of birth for the foreign-born population - Barbados (%)
Place of birth for the foreign-born population - Cuba (%)
Place of birth for the foreign-born population - Dominica (%)
Place of birth for the foreign-born population - Dominican Republic (%)
Place of birth for the foreign-born population - Grenada (%)
Place of birth for the foreign-born population - Haiti (%)
Place of birth for the foreign-born population - Jamaica (%)
Place of birth for the foreign-born population - St. Vincent and the Grenadines (%)
Place of birth for the foreign-born population - Trinidad and Tobago (%)
Place of birth for the foreign-born population - West Indies (%)
Place of birth for the foreign-born population - Other Caribbean (%)
Place of birth for the foreign-born population - Belize (%)
Place of birth for the foreign-born population - Costa Rica (%)
Place of birth for the foreign-born population - El Salvador (%)
Place of birth for the foreign-born population - Guatemala (%)
Place of birth for the foreign-born population - Honduras (%)
Place of birth for the foreign-born population - Mexico (%)
Place of birth for the foreign-born population - Nicaragua (%)
Place of birth for the foreign-born population - Panama (%)
Place of birth for the foreign-born population - Other Central America (%)
Place of birth for the foreign-born population - Argentina (%)
Place of birth for the foreign-born population - Bolivia (%)
Place of birth for the foreign-born population - Brazil (%)
Place of birth for the foreign-born population - Chile (%)
Place of birth for the foreign-born population - Colombia (%)
Place of birth for the foreign-born population - Ecuador (%)
Place of birth for the foreign-born population - Guyana (%)
Place of birth for the foreign-born population - Peru (%)
Place of birth for the foreign-born population - Uruguay (%)
Place of birth for the foreign-born population - Venezuela (%)
Place of birth for the foreign-born population - Other South America (%)
Place of birth for the foreign-born population - Canada (%)
Place of birth for the foreign-born population - Other Northern America (%)
Place of birth for the foreign-born population - Other (%)
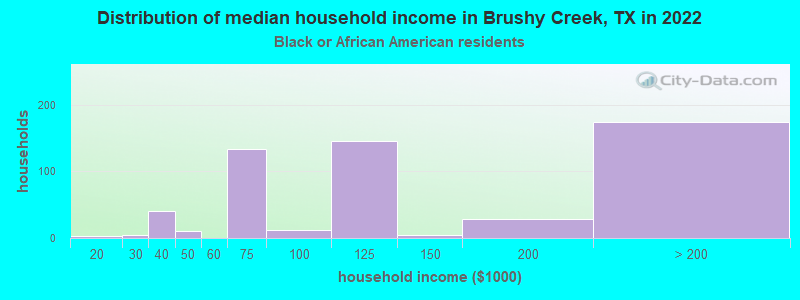
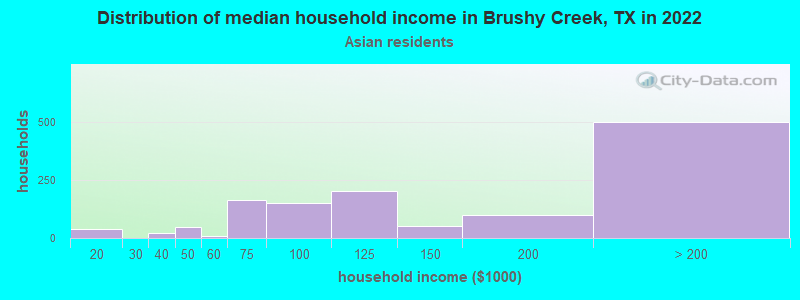
According to 2022 data, the most numerous races in Brushy Creek, TX are Hispanic (4,778 residents), White alone (13,322 residents), and Black alone (1,472 residents). 73.5% of Brushy Creek residents speak English at home. 15.6% of Brushy Creek, TX residents are foreign-born (9.5% born in Asia, 4.7% born in Latin America), which is 8.8% less than the foreign-born rate of 17.0% across the entire state of Texas.
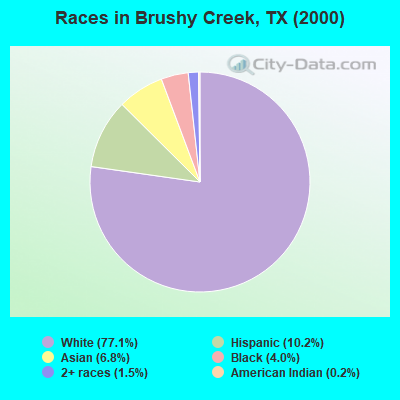
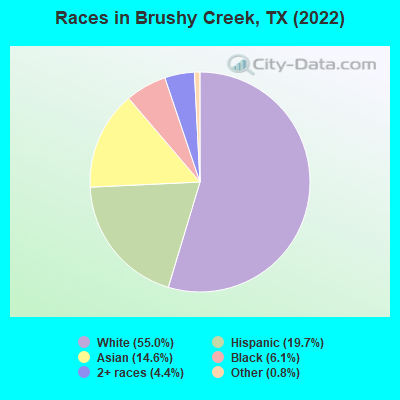
Race distribution in Brushy Creek
2000 2022
10,933,313 52.4% White alone 6,669,666 32.0% Hispanic 2,364,255 11.3% Black alone 554,445 2.7% Asian alone 230,567 1.1% Two or more races 68,859 0.3% American Indian alone 19,958 0.10% Other race alone 10,757 0.05% Native Hawaiian and Other
12,070,642 40.2% Hispanic 11,683,430 38.9% White alone 3,508,706 11.7% Black alone 1,608,173 5.4% Asian alone 956,560 3.2% Two or more races 125,763 0.4% Other race alone 47,023 0.2% American Indian alone 29,275 0.10% Native Hawaiian and Other
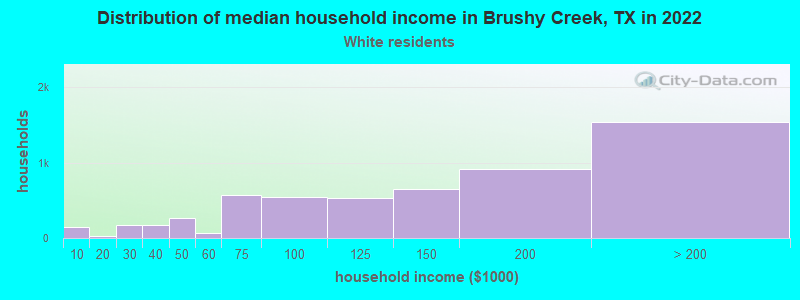
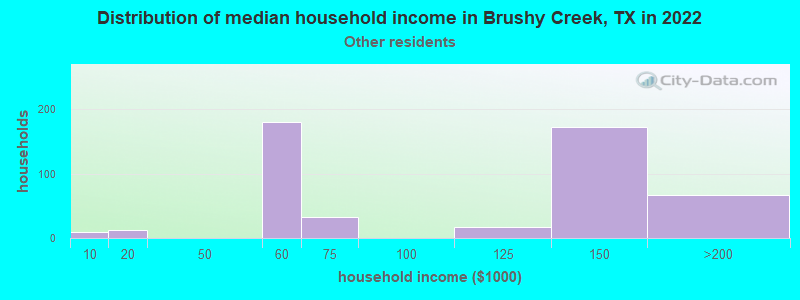
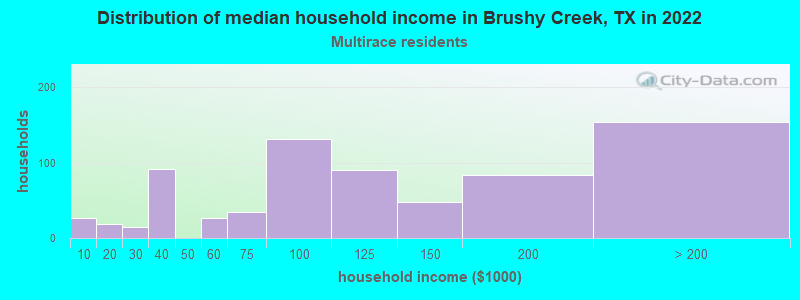
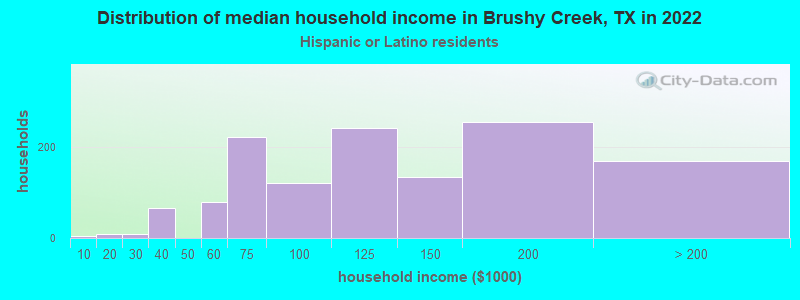
Income and house value in Brushy Creek Median household income in 2022 $133,466 White non-Hispanic householders$115,907 Black householders$135,729 Asian householders$114,075 Two or more races householders$112,617 Hispanic or Latino race householdersMedian 2022 house value $520,547 White Non-Hispanic householders$560,112 Black or African American householders$310,628 American Indian or Alaska Native householders $575,807 Asian householders$494,062 Some other race householders$396,950 Two or more races householders$533,954 Hispanic or Latino householders
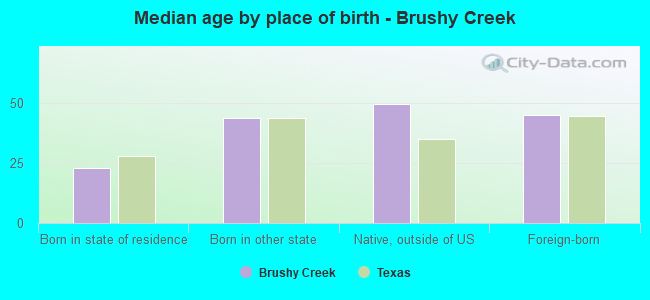
Median age by race in Brushy Creek
42.4 Median age for White residents41.4 43.1 30.7 Median age for Black or African American residents31.1 31.8 -786,008,229.7 Median age for American Indian / Alaska Native residents-897,347,173.3 -635,991,819.4 39.0 Median age for Asian residents41.7 36.7 -682,125,603.2 Median age for Native Hawaiian / Pacific Islander residents-612,729,233.5 -577,777,777.2 35.9 Median age for Other race residents35.4 44.6 23.9 Median age for Two or more races residents17.3 41.3 43.4 Median age for White alone residents43.3 43.5 31.7 Median age for Hispanic or Latino residents27.0 35.0
Owner/renter occupied households by race in Brushy Creek
House owners and renters - White residents 4,428 80.3% Owner occupied1,085 19.7% Renter occupiedHouse owners and renters - Black or African American residents 173 35.4% Owner occupied316 64.6% Renter occupiedHouse owners and renters - Asian residents 1,053 83.7% Owner occupied206 16.3% Renter occupiedHouse owners and renters - Native Hawaiian / Pacific Islander residents 31 100.0% Renter occupiedHouse owners and renters - Other race residents 214 37.6% Owner occupied355 62.4% Renter occupiedHouse owners and renters - Two or more races residents 332 46.7% Owner occupied379 53.3% Renter occupiedHouse owners and renters - White alone residents 4,192 81.6% Owner occupied943 18.4% Renter occupiedHouse owners and renters - Hispanic or Latino residents 697 52.6% Owner occupied628 47.4% Renter occupied
Language usage in Brushy Creek
English speakers - Total 73.5% of residents of Brushy Creek speak English at home.
10.8% of residents speak Spanish at home 2,008 79.8% Speak English very well508 20.2% Speak English less than very well16.3% of residents speak other language at home 2,755 72.8% Speak English very well1,029 27.2% Speak English less than very well
English speakers - Born in the United States 87.5% of residents of Brushy Creek speak English at home.
9.2% of residents speak Spanish at home 639 82.7% Speak English very well134 17.3% Speak English less than very well3.6% of residents speak other language at home 252 82.9% Speak English very well52 17.1% Speak English less than very well
English speakers - Native, born elsewhere 79.7% of residents of Brushy Creek speak English at home.
11.5% of residents speak Spanish at home 61 89.7% Speak English very well7 10.3% Speak English less than very well3.2% of residents speak other language at home 19 100.0% Speak English very well
English speakers - Foreign-born 13.7% of residents of Brushy Creek speak English at home.
20.6% of residents speak Spanish at home 580 61.4% Speak English very well364 38.6% Speak English less than very well67.2% of residents speak other language at home 2,108 68.6% Speak English very well967 31.4% Speak English less than very well
White (Caucasian) - Speak only English Native:
95.7% (12,700)Foreign-born:
25.5% (166)
White (Caucasian) - Speak another language Native:
4.7% (626)Foreign-born:
74.5% (486)
Black or African American - Speak only English Native:
97.7% (1,045)Foreign-born:
77.3% (333)
Asian - Speak only English Native:
37.6% (347)Foreign-born:
5.4% (137)
Asian - Speak another language Native:
59.7% (552)Foreign-born:
94.8% (2,419)
Other race - Speak only English Native:
38.5% (322)Foreign-born:
9.7% (69)
Other race - Speak another language Native:
63.7% (533)Foreign-born:
88.6% (634)
Two or more races - Speak only English Native:
80.0% (1,858)Foreign-born:
5.9% (21)
Two or more races - Speak another language Native:
19.3% (447)Foreign-born:
94.0% (334)
White alone - Speak only English Native:
97.1% (11,920)Foreign-born:
38.0% (192)
White alone - Speak another language Native:
2.9% (360)Foreign-born:
60.5% (306)
Hispanic or Latino - Speak only English Native:
63.1% (2,224)Foreign-born:
4.4% (45)
Hispanic or Latino - Speak another language Native:
36.2% (1,278)Foreign-born:
95.5% (976)
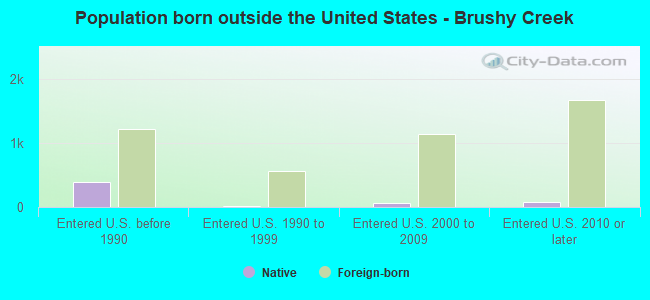
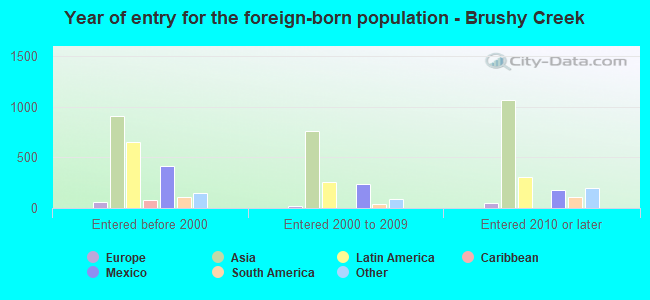
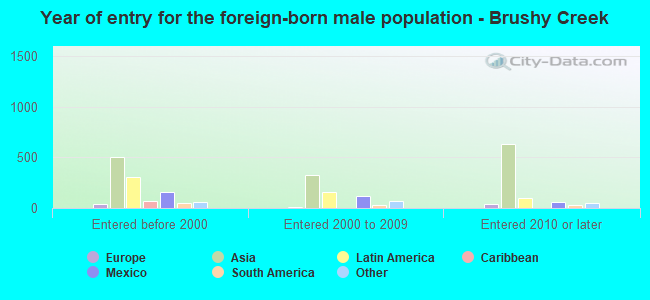
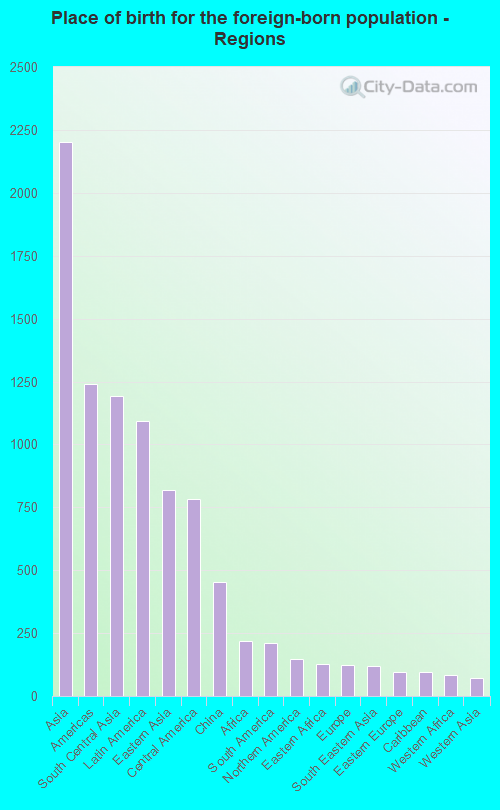
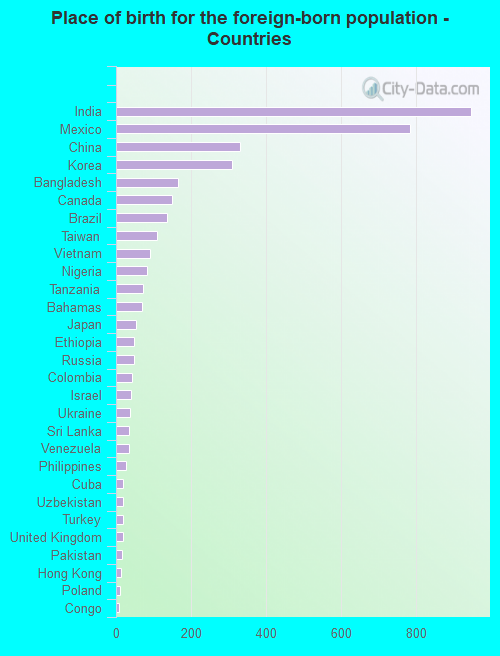
Foreign-born residents in Brushy Creek 3,787 residents are foreign born (9.5% Asia , 4.7% Latin America ).
This city:
15.6%Texas:
17.1%
Marital status for residents in Brushy Creek Marital status - White (Caucasian) population 15 years and over
Males 28.3% Never married60.1% Now married1.9% Separated1.7% Widowed7.9% DivorcedFemales 20.3% Never married68.6% Now married2.0% Separated2.2% Widowed6.8% DivorcedWomen who gave birth in the past 12 months Now married:
93.1% (111)Unmarried:
6.9% (8)
Women who did not give birth in the past 12 months Now married:
66.9% (1,979)Unmarried:
33.1% (981)
Marital status - Black or African American population 15 years and over
Males 35.2% Never married57.5% Now married4.3% Separated1.5% Widowed1.5% DivorcedFemales 37.6% Never married35.5% Now married0.0% Separated4.7% Widowed22.2% DivorcedWomen who did not give birth in the past 12 months Now married:
33.2% (131)Unmarried:
66.8% (264)
Marital status - Asian population 15 years and over
Males 25.0% Never married74.0% Now married0.0% Separated0.0% Widowed1.0% DivorcedFemales 14.8% Never married70.3% Now married12.7% Separated2.0% Widowed0.3% DivorcedWomen who gave birth in the past 12 months Now married:
100.0% (8)Unmarried:
0.0% (0)
Women who did not give birth in the past 12 months Now married:
78.1% (777)Unmarried:
21.9% (217)
Marital status - Other race population 15 years and over
Males 24.9% Never married68.8% Now married6.2% Separated0.0% Widowed0.0% DivorcedFemales 13.2% Never married74.3% Now married0.0% Separated1.5% Widowed11.1% DivorcedWomen who did not give birth in the past 12 months Now married:
67.0% (206)Unmarried:
33.0% (101)
Marital status - Two or more races population 15 years and over
Males 38.7% Never married53.1% Now married0.0% Separated0.0% Widowed8.2% DivorcedFemales 24.1% Never married60.3% Now married6.7% Separated3.6% Widowed5.2% DivorcedWomen who did not give birth in the past 12 months Now married:
65.5% (403)Unmarried:
34.5% (212)
Marital status - White alone, not Hispanic / Latino population 15 years and over
Males 27.6% Never married60.6% Now married2.2% Separated2.0% Widowed7.6% DivorcedFemales 19.7% Never married68.1% Now married1.4% Separated2.7% Widowed8.2% DivorcedWomen who gave birth in the past 12 months Now married:
85.2% (53)Unmarried:
14.8% (9)
Women who did not give birth in the past 12 months Now married:
65.0% (1,705)Unmarried:
35.0% (920)
Marital status - Hispanic or Latino population 15 years and over
Males 29.9% Never married58.5% Now married1.6% Separated0.0% Widowed10.0% DivorcedFemales 21.4% Never married72.3% Now married3.1% Separated0.9% Widowed2.3% DivorcedWomen who gave birth in the past 12 months Now married:
100.0% (78)Unmarried:
0.0% (0)
Women who did not give birth in the past 12 months Now married:
71.3% (841)Unmarried:
28.7% (339)
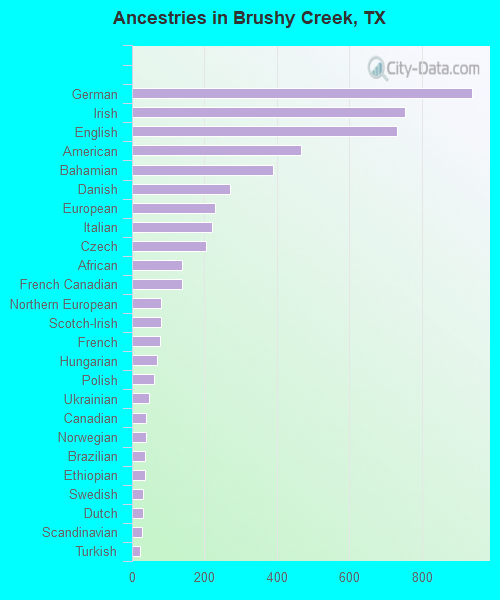
Ancestries in Brushy Creek
938 8.5% German752 6.8% Irish731 6.6% English465 4.2% American390 3.5% Bahamian270 2.5% Danish228 2.1% European220 2.0% Italian204 1.9% Czech137 1.2% African137 1.2% French Canadian81 0.7% Northern European80 0.7% Scotch-Irish76 0.7% French68 0.6% Hungarian62 0.6% Polish47 0.4% Ukrainian39 0.4% Canadian39 0.4% Norwegian37 0.3% Brazilian36 0.3% Ethiopian31 0.3% Swedish30 0.3% Dutch28 0.3% Scandinavian21 0.2% Turkish19 0.2% Slovak19 0.2% Swiss16 0.1% Russian13 0.1% Lebanese12 0.1% Kenyan11 0.1% British10 0.09% Nigerian8 0.07% Jamaican6 0.05% Finnish6 0.05% Scottish6 0.05% Welsh
Geographical mobility in Brushy Creek Same house 1 year ago 12,873 90.0% White (Caucasian)1,111 71.9% Black or African American2,877 80.7% Asian31 98.2% Native Hawaiian / Pacific Islander1,080 67.6% Other race2,010 71.8% Two or more races12,042 91.0% White alone, not Hispanic / Latino3,552 75.3% Hispanic or LatinoMoved within same county 883 6.2% White / Caucasian203 13.1% Black or African American441 12.4% Asian56 3.5% Other race118 4.2% Two or more races699 5.3% White alone, not Hispanic / Latino360 7.6% Hispanic or LatinoMoved within same state 295 2.1% White / Caucasian50 3.3% Black or African American103 2.9% Asian68 4.2% Other race152 5.4% Two or more races245 1.9% White alone, not Hispanic / Latino210 4.5% Hispanic or LatinoMoved from different state 267 1.9% White / Caucasian187 12.1% Black or African American30 0.8% Asian129 8.0% Other race713 25.5% Two or more races259 2.0% White alone, not Hispanic / Latino390 8.3% Hispanic or LatinoMoved from abroad 37 0.3% White50 1.4% Asian165 10.3% Other race43 0.3% White alone, not Hispanic / Latino61 1.3% Hispanic or Latino
Children Nativity (place of birth) in Brushy Creek
Children under 6 years - Living with two parents Both parents native 760 100.0% NativeBoth parents foreign-born 289 83.9% Native56 16.1% Foreign-bornOne native, one foreign-born parent 47 100.0% NativeChildren under 6 years - Living with one parent Native parent 33 100.0% NativeForeign-born parent 37 100.0% NativeChildren 6 to 17 years - Living with two parents Both parents native 3,273 98.2% Native61 1.8% Foreign-bornBoth parents foreign-born 570 61.5% Native357 38.5% Foreign-bornOne native, one foreign-born parent 403 94.3% Native24 5.7% Foreign-bornChildren 6 to 17 years - Living with one parent Native parent 319 100.0% NativeForeign-born parent 294 55.0% Native240 45.0% Foreign-born
Grandparents responsible for own grandchildren in Brushy Creek
Grandparents (30 to 59 years) White / Caucasian 22 100.0% Not responsible for grandchildrenTwo or more races 62 63.0% Responsible for grandchildren37 37.0% Not responsible for grandchildrenWhite alone, not Hispanic / Latino 35 100.0% Not responsible for grandchildrenHispanic or Latino 18 100.0% Responsible for grandchildrenGrandparents (60 years and over) White / Caucasian 25 44.3% Responsible for grandchildren31 55.7% Not responsible for grandchildrenTwo or more races 21 100.0% Responsible for grandchildrenWhite alone, not Hispanic / Latino 16 34.5% Responsible for grandchildren30 65.5% Not responsible for grandchildren