Races in Bryan, Texas (TX) Detailed Stats
Data:
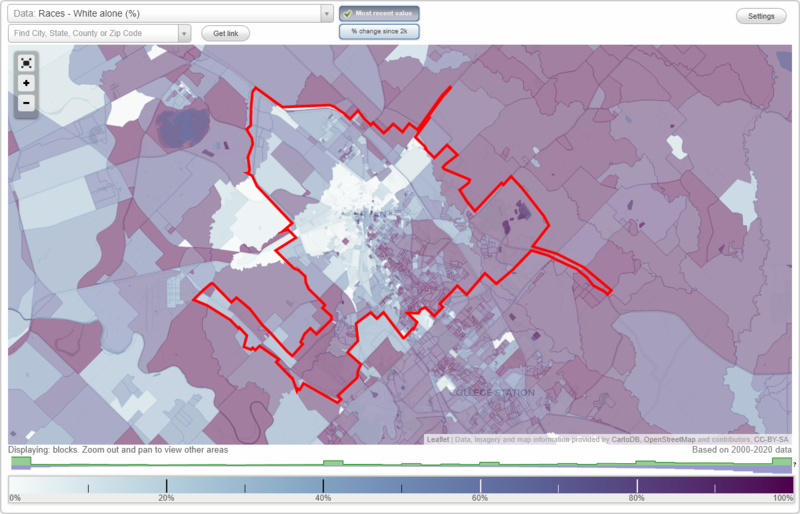
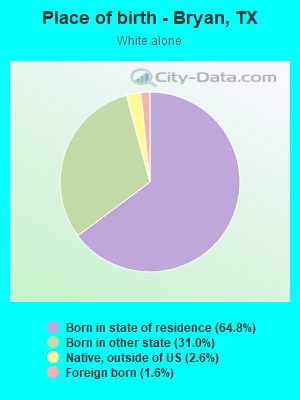
Races - White alone (%)
Races - White alone (% change since 2000)
Races - Black alone (%)
Races - Black alone (% change since 2000)
Races - American Indian alone (%)
Races - American Indian alone (% change since 2000)
Races - Asian alone (%)
Races - Asian alone (% change since 2000)
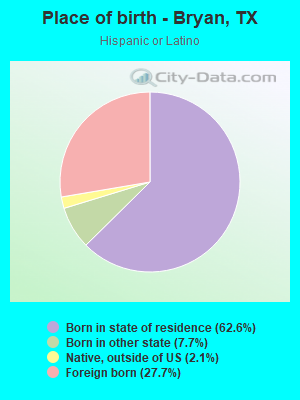
Races - Hispanic (%)
Races - Hispanic (% change since 2000)
Races - Native Hawaiian and Other Pacific Islander alone (%)
Races - Native Hawaiian and Other Pacific Islander alone (% change since 2000)
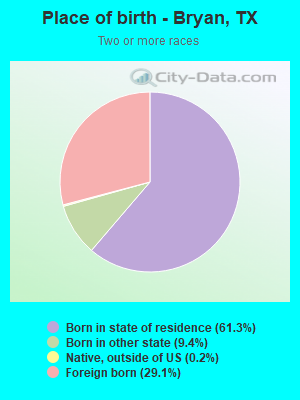
Races - Two or more races(%)
Races - Two or more races(% change since 2000)
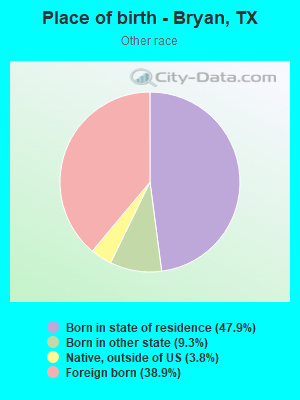
Races - Other race alone (%)
Races - Other race alone (% change since 2000)
Racial diversity
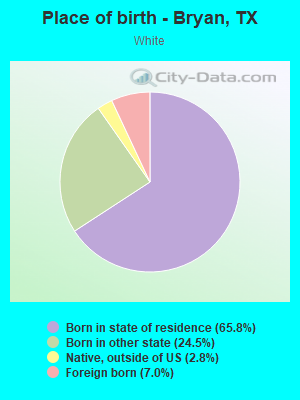
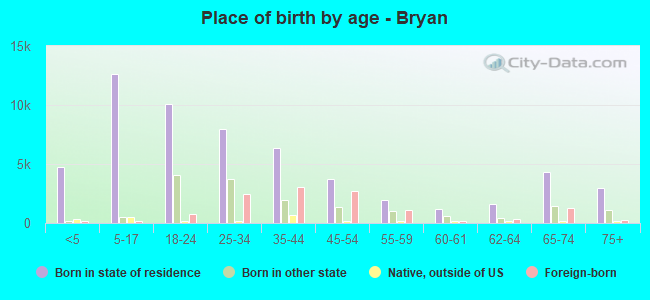
Place of birth - Born in state of residence (%)
Place of birth - Born in state of residence (%) - White
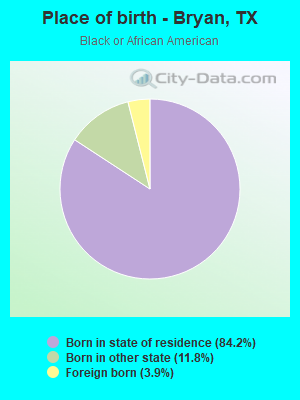
Place of birth - Born in state of residence (%) - Black or African American
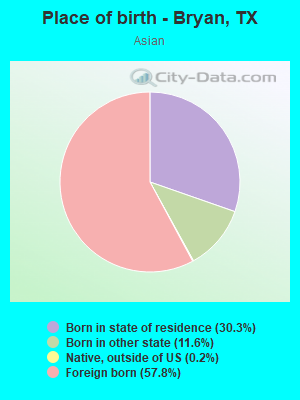
Place of birth - Born in state of residence (%) - Asian
Place of birth - Born in state of residence (%) - Hispanic or Latino
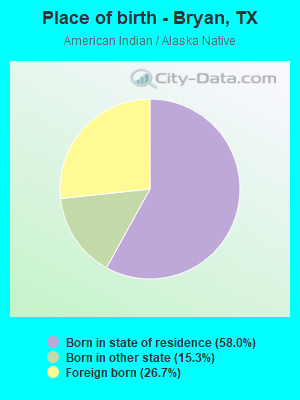
Place of birth - Born in state of residence (%) - American Indian and Alaska Native
Place of birth - Born in state of residence (%) - Multirace
Place of birth - Born in state of residence (%) - Other Race
Place of birth - Born in other state (%)
Place of birth - Born in other state (%) - White
Place of birth - Born in other state (%) - Black or African American
Place of birth - Born in other state (%) - Asian
Place of birth - Born in other state (%) - Hispanic or Latino
Place of birth - Born in other state (%) - American Indian and Alaska Native
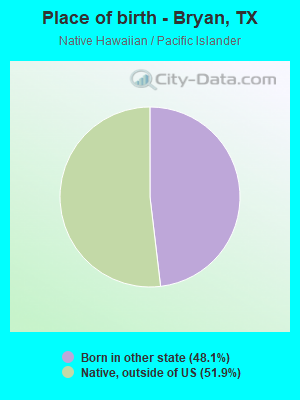
Place of birth - Born in other state (%) - Multirace
Place of birth - Born in other state (%) - Other Race
Place of birth - Native, outside of US (%)
Place of birth - Native, outside of US (%) - White
Place of birth - Native, outside of US (%) - Black or African American
Place of birth - Native, outside of US (%) - Asian
Place of birth - Native, outside of US (%) - Hispanic or Latino
Place of birth - Native, outside of US (%) - American Indian and Alaska Native
Place of birth - Native, outside of US (%) - Multirace
Place of birth - Native, outside of US (%) - Other Race
Place of birth - Foreign born (%)
Place of birth - Foreign born (%) - White
Place of birth - Foreign born (%) - Black or African American
Place of birth - Foreign born (%) - Asian
Place of birth - Foreign born (%) - Hispanic or Latino
Place of birth - Foreign born (%) - American Indian and Alaska Native
Place of birth - Foreign born (%) - Multirace
Place of birth - Foreign born (%) - Other Race
Residents speaking English at home (%)
Residents speaking English at home - Born in the United States (%)
Residents speaking English at home - Native, born elsewhere (%)
Residents speaking English at home - Foreign born (%)
Residents speaking Spanish at home (%)
Residents speaking Spanish at home - Born in the United States (%)
Residents speaking Spanish at home - Native, born elsewhere (%)
Residents speaking Spanish at home - Foreign born (%)
Residents speaking other language at home (%)
Residents speaking other language at home - Born in the United States (%)
Residents speaking other language at home - Native, born elsewhere (%)
Residents speaking other language at home - Foreign born (%)
Marital status - Never married (%)
Marital status - Now married (%)
Marital status - Separated (%)
Marital status - Widowed (%)
Marital status - Divorced (%)
Ancestries Reported - Arab (%)
Ancestries Reported - Czech (%)
Ancestries Reported - Danish (%)
Ancestries Reported - Dutch (%)
Ancestries Reported - English (%)
Ancestries Reported - French (%)
Ancestries Reported - French Canadian (%)
Ancestries Reported - German (%)
Ancestries Reported - Greek (%)
Ancestries Reported - Hungarian (%)
Ancestries Reported - Irish (%)
Ancestries Reported - Italian (%)
Ancestries Reported - Lithuanian (%)
Ancestries Reported - Norwegian (%)
Ancestries Reported - Polish (%)
Ancestries Reported - Portuguese (%)
Ancestries Reported - Russian (%)
Ancestries Reported - Scotch-Irish (%)
Ancestries Reported - Scottish (%)
Ancestries Reported - Slovak (%)
Ancestries Reported - Subsaharan African (%)
Ancestries Reported - Swedish (%)
Ancestries Reported - Swiss (%)
Ancestries Reported - Ukrainian (%)
Ancestries Reported - United States (%)
Ancestries Reported - Welsh (%)
Ancestries Reported - West Indian (%)
Ancestries Reported - Other (%)
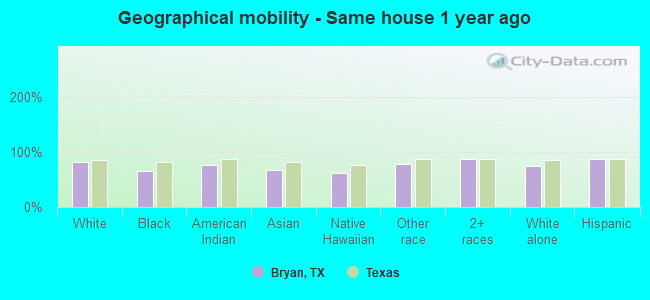
Geographical mobility - Same house 1 year ago (%)
Geographical mobility - Same house 1 year ago (%) - White
Geographical mobility - Same house 1 year ago (%) - Black or African American
Geographical mobility - Same house 1 year ago (%) - Asian
Geographical mobility - Same house 1 year ago (%) - Hispanic or Latino
Geographical mobility - Same house 1 year ago (%) - American Indian and Alaska Native
Geographical mobility - Same house 1 year ago (%) - Multirace
Geographical mobility - Same house 1 year ago (%) - Other Race
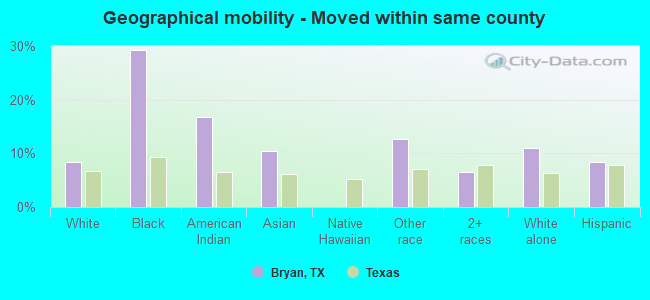
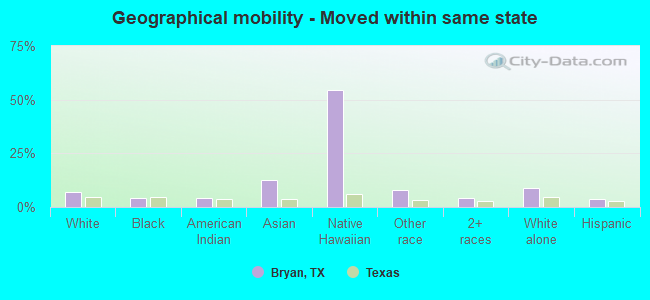
Geographical mobility - Moved within same county (%)
Geographical mobility - Moved within same county (%) - White
Geographical mobility - Moved within same county (%) - Black or African American
Geographical mobility - Moved within same county (%) - Asian
Geographical mobility - Moved within same county (%) - Hispanic or Latino
Geographical mobility - Moved within same county (%) - American Indian and Alaska Native
Geographical mobility - Moved within same county (%) - Multirace
Geographical mobility - Moved within same county (%) - Other Race
Geographical mobility - Moved from different county within same state (%)
Geographical mobility - Moved from different county within same state (%) - White
Geographical mobility - Moved from different county within same state (%) - Black or African American
Geographical mobility - Moved from different county within same state (%) - Asian
Geographical mobility - Moved from different county within same state (%) - Hispanic or Latino
Geographical mobility - Moved from different county within same state (%) - American Indian and Alaska Native
Geographical mobility - Moved from different county within same state (%) - Multirace
Geographical mobility - Moved from different county within same state (%) - Other Race
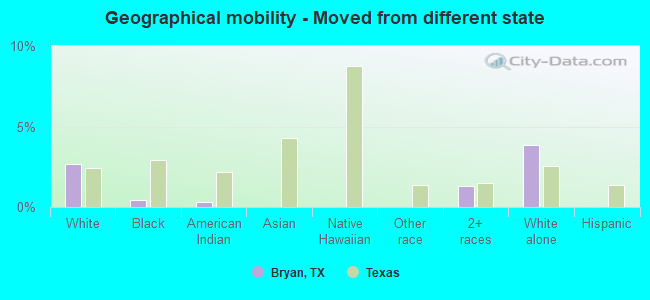
Geographical mobility - Moved from different state (%)
Geographical mobility - Moved from different state (%) - White
Geographical mobility - Moved from different state (%) - Black or African American
Geographical mobility - Moved from different state (%) - Asian
Geographical mobility - Moved from different state (%) - Hispanic or Latino
Geographical mobility - Moved from different state (%) - American Indian and Alaska Native
Geographical mobility - Moved from different state (%) - Multirace
Geographical mobility - Moved from different state (%) - Other Race
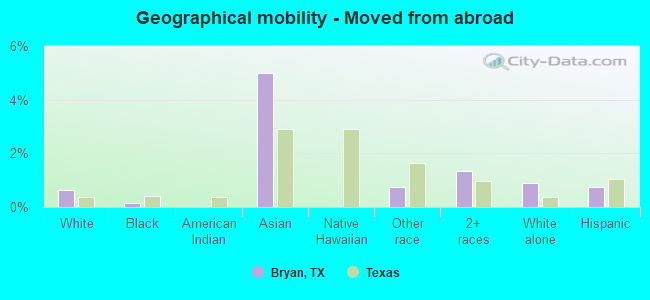
Geographical mobility - Moved from abroad (%)
Geographical mobility - Moved from abroad (%) - White
Geographical mobility - Moved from abroad (%) - Black or African American
Geographical mobility - Moved from abroad (%) - Asian
Geographical mobility - Moved from abroad (%) - Hispanic or Latino
Geographical mobility - Moved from abroad (%) - American Indian and Alaska Native
Geographical mobility - Moved from abroad (%) - Multirace
Geographical mobility - Moved from abroad (%) - Other Race
Place of birth for the foreign-born population - Ireland (%)
Place of birth for the foreign-born population - Denmark (%)
Place of birth for the foreign-born population - Norway (%)
Place of birth for the foreign-born population - Sweden (%)
Place of birth for the foreign-born population - United Kingdom (%)
Place of birth for the foreign-born population - England (%)
Place of birth for the foreign-born population - Scotland (%)
Place of birth for the foreign-born population - Other Northern Europe (%)
Place of birth for the foreign-born population - Austria (%)
Place of birth for the foreign-born population - Belgium (%)
Place of birth for the foreign-born population - France (%)
Place of birth for the foreign-born population - Germany (%)
Place of birth for the foreign-born population - Netherlands (%)
Place of birth for the foreign-born population - Switzerland (%)
Place of birth for the foreign-born population - Other Western Europe (%)
Place of birth for the foreign-born population - Greece (%)
Place of birth for the foreign-born population - Italy (%)
Place of birth for the foreign-born population - Portugal (%)
Place of birth for the foreign-born population - Spain (%)
Place of birth for the foreign-born population - Other Southern Europe (%)
Place of birth for the foreign-born population - Albania (%)
Place of birth for the foreign-born population - Belarus (%)
Place of birth for the foreign-born population - Bosnia and Herzegovina (%)
Place of birth for the foreign-born population - Bulgaria (%)
Place of birth for the foreign-born population - Croatia (%)
Place of birth for the foreign-born population - Czechoslovakia (%)
Place of birth for the foreign-born population - Hungary (%)
Place of birth for the foreign-born population - Latvia (%)
Place of birth for the foreign-born population - Lithuania (%)
Place of birth for the foreign-born population - North Macedonia (Macedonia) (%)
Place of birth for the foreign-born population - Moldova (%)
Place of birth for the foreign-born population - Poland (%)
Place of birth for the foreign-born population - Romania (%)
Place of birth for the foreign-born population - Russia (%)
Place of birth for the foreign-born population - Serbia (%)
Place of birth for the foreign-born population - Ukraine (%)
Place of birth for the foreign-born population - Other Eastern Europe (%)
Place of birth for the foreign-born population - China (%)
Place of birth for the foreign-born population - Hong Kong (%)
Place of birth for the foreign-born population - Taiwan (%)
Place of birth for the foreign-born population - Japan (%)
Place of birth for the foreign-born population - Korea (%)
Place of birth for the foreign-born population - Other Eastern Asia (%)
Place of birth for the foreign-born population - Afghanistan (%)
Place of birth for the foreign-born population - Bangladesh (%)
Place of birth for the foreign-born population - India (%)
Place of birth for the foreign-born population - Iran (%)
Place of birth for the foreign-born population - Kazakhstan (%)
Place of birth for the foreign-born population - Nepal (%)
Place of birth for the foreign-born population - Pakistan (%)
Place of birth for the foreign-born population - Sri Lanka (%)
Place of birth for the foreign-born population - Uzbekistan (%)
Place of birth for the foreign-born population - Other South Central Asia (%)
Place of birth for the foreign-born population - Burma (%)
Place of birth for the foreign-born population - Cambodia (%)
Place of birth for the foreign-born population - Indonesia (%)
Place of birth for the foreign-born population - Laos (%)
Place of birth for the foreign-born population - Malaysia (%)
Place of birth for the foreign-born population - Philippines (%)
Place of birth for the foreign-born population - Singapore (%)
Place of birth for the foreign-born population - Thailand (%)
Place of birth for the foreign-born population - Vietnam (%)
Place of birth for the foreign-born population - Other South Eastern Asia (%)
Place of birth for the foreign-born population - Armenia (%)
Place of birth for the foreign-born population - Iraq (%)
Place of birth for the foreign-born population - Israel (%)
Place of birth for the foreign-born population - Jordan (%)
Place of birth for the foreign-born population - Kuwait (%)
Place of birth for the foreign-born population - Lebanon (%)
Place of birth for the foreign-born population - Saudi Arabia (%)
Place of birth for the foreign-born population - Syria (%)
Place of birth for the foreign-born population - Turkey (%)
Place of birth for the foreign-born population - Yemen (%)
Place of birth for the foreign-born population - Other Western Asia (%)
Place of birth for the foreign-born population - Eritrea (%)
Place of birth for the foreign-born population - Ethiopia (%)
Place of birth for the foreign-born population - Kenya (%)
Place of birth for the foreign-born population - Somalia (%)
Place of birth for the foreign-born population - Uganda (%)
Place of birth for the foreign-born population - Zimbabwe (%)
Place of birth for the foreign-born population - Other Eastern Africa (%)
Place of birth for the foreign-born population - Cameroon (%)
Place of birth for the foreign-born population - Congo (%)
Place of birth for the foreign-born population - Democratic Republic of Congo (Zaire) (%)
Place of birth for the foreign-born population - Other Middle Africa (%)
Place of birth for the foreign-born population - Egypt (%)
Place of birth for the foreign-born population - Morocco (%)
Place of birth for the foreign-born population - Sudan (%)
Place of birth for the foreign-born population - Other Northern Africa (%)
Place of birth for the foreign-born population - South Africa (%)
Place of birth for the foreign-born population - Other Southern Africa (%)
Place of birth for the foreign-born population - Cabo Verde (%)
Place of birth for the foreign-born population - Ghana (%)
Place of birth for the foreign-born population - Liberia (%)
Place of birth for the foreign-born population - Nigeria (%)
Place of birth for the foreign-born population - Senegal (%)
Place of birth for the foreign-born population - Sierra Leone (%)
Place of birth for the foreign-born population - Other Western Africa (%)
Place of birth for the foreign-born population - Australia (%)
Place of birth for the foreign-born population - New Zealand (%)
Place of birth for the foreign-born population - Fiji (%)
Place of birth for the foreign-born population - Micronesia (%)
Place of birth for the foreign-born population - Bahamas (%)
Place of birth for the foreign-born population - Barbados (%)
Place of birth for the foreign-born population - Cuba (%)
Place of birth for the foreign-born population - Dominica (%)
Place of birth for the foreign-born population - Dominican Republic (%)
Place of birth for the foreign-born population - Grenada (%)
Place of birth for the foreign-born population - Haiti (%)
Place of birth for the foreign-born population - Jamaica (%)
Place of birth for the foreign-born population - St. Vincent and the Grenadines (%)
Place of birth for the foreign-born population - Trinidad and Tobago (%)
Place of birth for the foreign-born population - West Indies (%)
Place of birth for the foreign-born population - Other Caribbean (%)
Place of birth for the foreign-born population - Belize (%)
Place of birth for the foreign-born population - Costa Rica (%)
Place of birth for the foreign-born population - El Salvador (%)
Place of birth for the foreign-born population - Guatemala (%)
Place of birth for the foreign-born population - Honduras (%)
Place of birth for the foreign-born population - Mexico (%)
Place of birth for the foreign-born population - Nicaragua (%)
Place of birth for the foreign-born population - Panama (%)
Place of birth for the foreign-born population - Other Central America (%)
Place of birth for the foreign-born population - Argentina (%)
Place of birth for the foreign-born population - Bolivia (%)
Place of birth for the foreign-born population - Brazil (%)
Place of birth for the foreign-born population - Chile (%)
Place of birth for the foreign-born population - Colombia (%)
Place of birth for the foreign-born population - Ecuador (%)
Place of birth for the foreign-born population - Guyana (%)
Place of birth for the foreign-born population - Peru (%)
Place of birth for the foreign-born population - Uruguay (%)
Place of birth for the foreign-born population - Venezuela (%)
Place of birth for the foreign-born population - Other South America (%)
Place of birth for the foreign-born population - Canada (%)
Place of birth for the foreign-born population - Other Northern America (%)
Place of birth for the foreign-born population - Other (%)
Latest news about races in Bryan, TX collected exclusively by city-data.com from local newspapers, TV, and radio stations
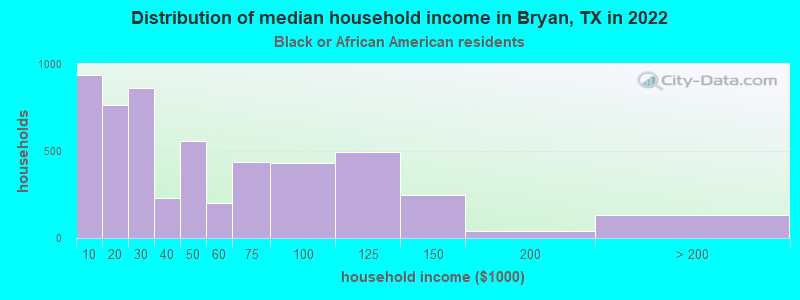
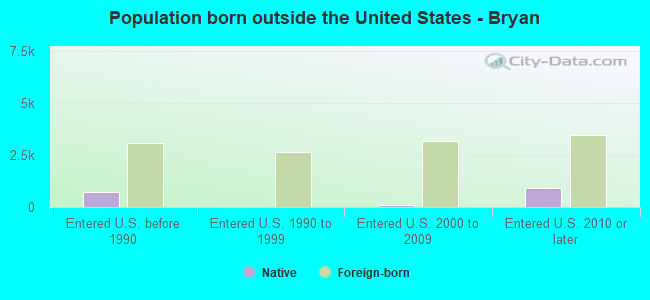
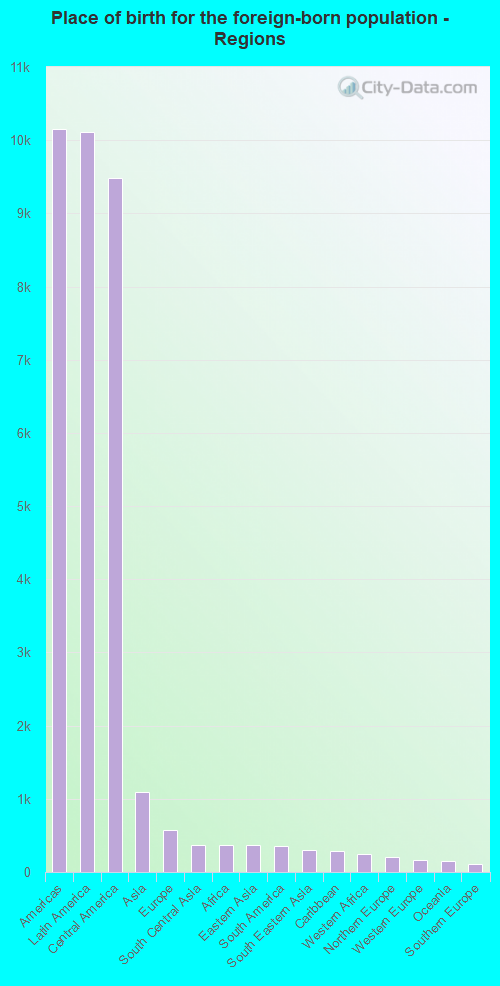
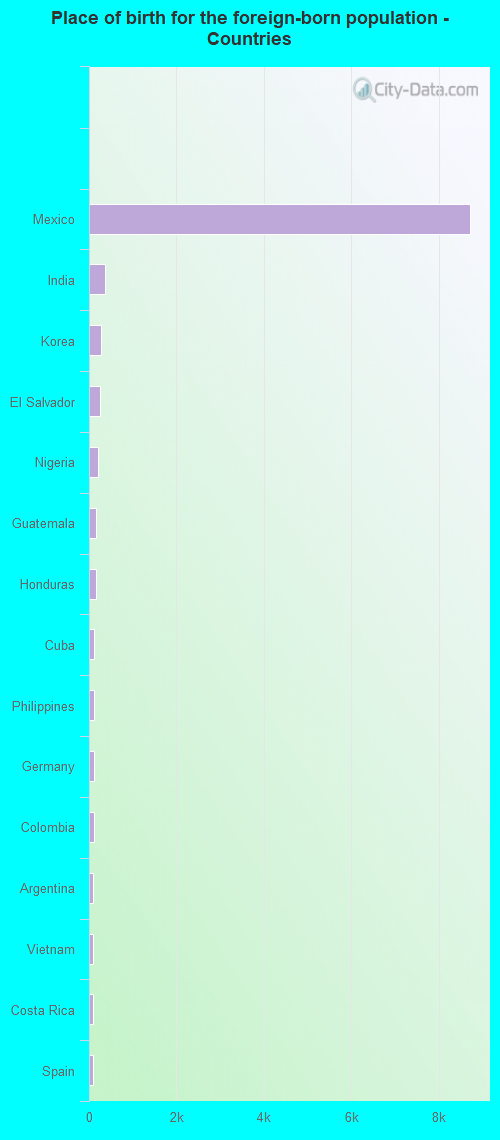
According to 2022 data, the most numerous races in Bryan, TX are Hispanic (38,566 residents), White alone (35,756 residents), and Black alone (9,466 residents). 67.4% of Bryan residents speak English at home. 14.1% of Bryan, TX residents are foreign-born (11.5% born in Latin America), which is 20.6% less than the foreign-born rate of 17.0% across the entire state of Texas.
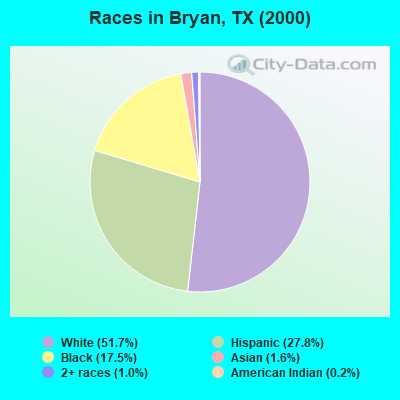
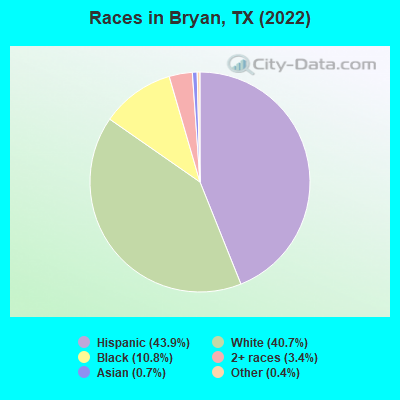
Race distribution in Bryan
2000 2022
10,933,313 52.4% White alone 6,669,666 32.0% Hispanic 2,364,255 11.3% Black alone 554,445 2.7% Asian alone 230,567 1.1% Two or more races 68,859 0.3% American Indian alone 19,958 0.10% Other race alone 10,757 0.05% Native Hawaiian and Other
12,070,642 40.2% Hispanic 11,683,430 38.9% White alone 3,508,706 11.7% Black alone 1,608,173 5.4% Asian alone 956,560 3.2% Two or more races 125,763 0.4% Other race alone 47,023 0.2% American Indian alone 29,275 0.10% Native Hawaiian and Other
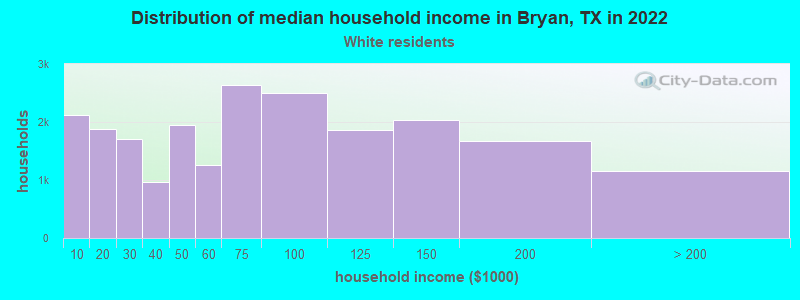
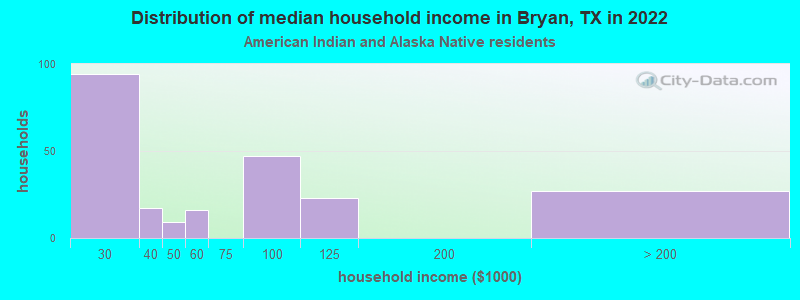
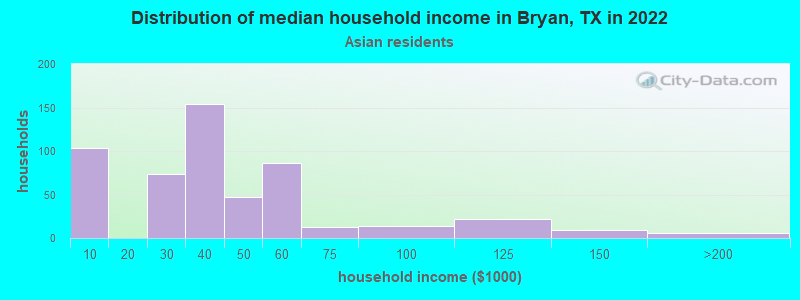
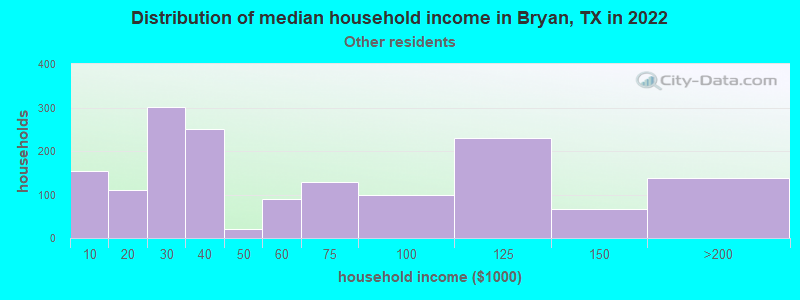
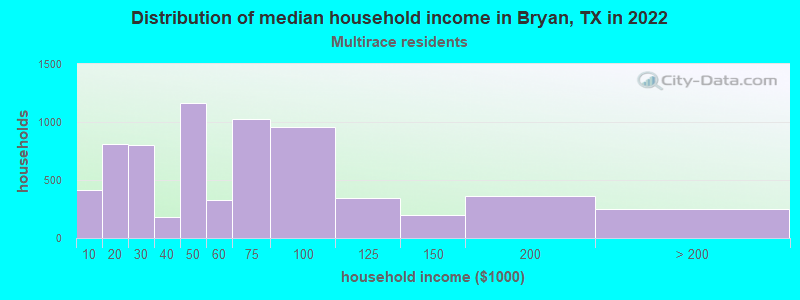
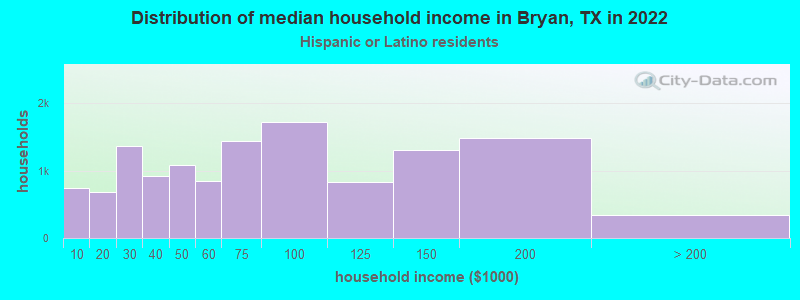
Income and house value in Bryan Median household income in 2022 $61,993 White non-Hispanic householders$45,816 Black householders$39,830 American Indian and Alaska Native householders$32,311 Asian householders$77,517 Some other race householders$52,500 Two or more races householders$64,347 Hispanic or Latino race householdersMedian 2022 house value $265,787 White Non-Hispanic householders$158,444 Black or African American householders$88,595 American Indian or Alaska Native householders $274,858 Asian householders$144,837 Some other race householders$202,590 Two or more races householders$149,675 Hispanic or Latino householders
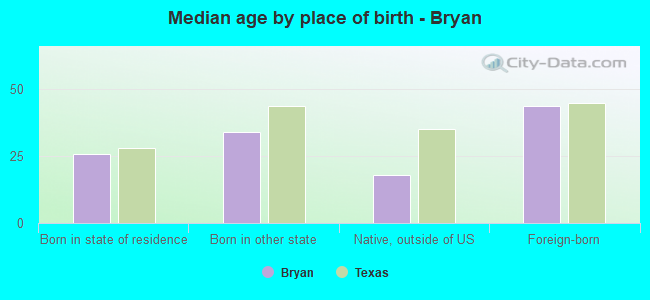
Median age by race in Bryan
32.3 Median age for White residents32.5 31.8 31.8 Median age for Black or African American residents32.1 30.6 30.1 Median age for American Indian / Alaska Native residents30.3 21.8 30.2 Median age for Asian residents27.8 36.0 -666,666,666.0 Median age for Native Hawaiian / Pacific Islander residents-666,666,666.0 -666,666,666.0 32.3 Median age for Other race residents34.1 32.3 29.4 Median age for Two or more races residents27.8 29.6 36.1 Median age for White alone residents37.0 35.7 27.3 Median age for Hispanic or Latino residents26.4 29.1
Owner/renter occupied households by race in Bryan
House owners and renters - White residents 11,503 52.9% Owner occupied10,241 47.1% Renter occupiedHouse owners and renters - Black or African American residents 1,398 34.8% Owner occupied2,622 65.2% Renter occupiedHouse owners and renters - American Indian / Alaska Native residents 131 56.2% Owner occupied102 43.8% Renter occupiedHouse owners and renters - Asian residents 70 17.9% Owner occupied320 82.1% Renter occupiedHouse owners and renters - Native Hawaiian / Pacific Islander residents 34 100.0% Renter occupiedHouse owners and renters - Other race residents 1,654 65.7% Owner occupied862 34.3% Renter occupiedHouse owners and renters - Two or more races residents 3,614 52.9% Owner occupied3,214 47.1% Renter occupiedHouse owners and renters - White alone residents 8,967 52.1% Owner occupied8,249 47.9% Renter occupiedHouse owners and renters - Hispanic or Latino residents 7,424 58.0% Owner occupied5,365 42.0% Renter occupied
Language usage in Bryan
English speakers - Total 67.4% of residents of Bryan speak English at home.
30.2% of residents speak Spanish at home 16,219 65.0% Speak English very well8,749 35.0% Speak English less than very well2.3% of residents speak other language at home 1,422 73.9% Speak English very well503 26.1% Speak English less than very well
English speakers - Born in the United States 86.1% of residents of Bryan speak English at home.
12.4% of residents speak Spanish at home 1,914 96.1% Speak English very well78 3.9% Speak English less than very well1.5% of residents speak other language at home 203 83.9% Speak English very well39 16.1% Speak English less than very well
English speakers - Native, born elsewhere 61.5% of residents of Bryan speak English at home.
34.4% of residents speak Spanish at home 414 85.7% Speak English very well69 14.3% Speak English less than very well4.1% of residents speak other language at home 57 100.0% Speak English very well
English speakers - Foreign-born 9.8% of residents of Bryan speak English at home.
79.5% of residents speak Spanish at home 2,473 25.3% Speak English very well7,318 74.7% Speak English less than very well10.7% of residents speak other language at home 906 69.1% Speak English very well406 30.9% Speak English less than very well
White (Caucasian) - Speak only English Native:
83.3% (37,503)Foreign-born:
21.1% (765)
White (Caucasian) - Speak another language Native:
16.7% (7,492)Foreign-born:
78.9% (2,862)
Black or African American - Speak only English Native:
96.0% (11,245)Foreign-born:
18.1% (51)
Black or African American - Speak another language Native:
3.9% (456)Foreign-born:
79.0% (224)
American Indian / Alaska Native - Speak only English Native:
44.0% (167)Foreign-born:
16.5% (23)
American Indian / Alaska Native - Speak another language Native:
58.2% (221)Foreign-born:
84.9% (120)
Asian - Speak only English Native:
54.2% (281)Foreign-born:
28.3% (231)
Asian - Speak another language Native:
45.5% (235)Foreign-born:
70.8% (579)
Other race - Speak only English Native:
53.6% (2,036)Foreign-born:
2.7% (67)
Other race - Speak another language Native:
46.4% (1,766)Foreign-born:
97.3% (2,448)
Two or more races - Speak only English Native:
51.6% (6,121)Foreign-born:
6.2% (314)
Two or more races - Speak another language Native:
48.4% (5,736)Foreign-born:
93.8% (4,757)
White alone - Speak only English Native:
95.3% (31,954)Foreign-born:
47.0% (270)
White alone - Speak another language Native:
4.7% (1,560)Foreign-born:
53.0% (305)
Hispanic or Latino - Speak only English Native:
46.3% (11,665)Foreign-born:
8.2% (879)
Hispanic or Latino - Speak another language Native:
53.7% (13,522)Foreign-born:
91.8% (9,791)
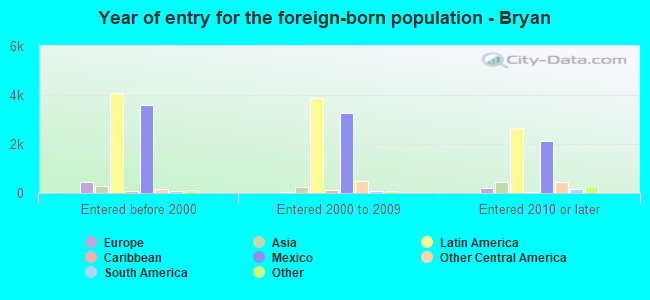
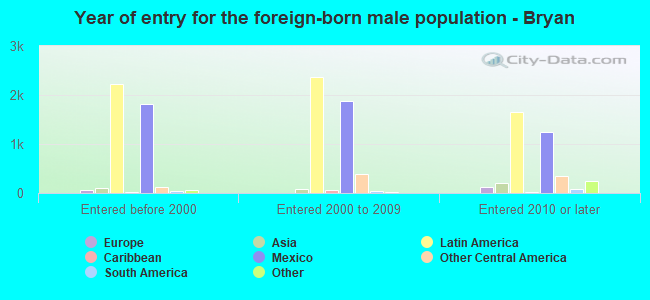
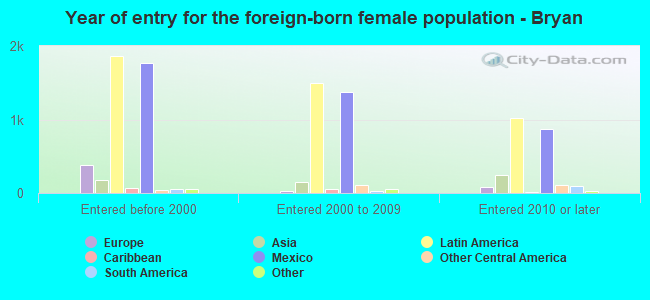
Foreign-born residents in Bryan 12,336 residents are foreign born (11.5% Latin America ).
This city:
14.1%Texas:
17.1%
Marital status for residents in Bryan Marital status - White (Caucasian) population 15 years and over
Males 44.5% Never married44.2% Now married0.7% Separated2.5% Widowed8.1% DivorcedFemales 39.0% Never married38.1% Now married1.5% Separated9.1% Widowed12.3% DivorcedWomen who gave birth in the past 12 months Now married:
75.3% (365)Unmarried:
24.7% (120)
Women who did not give birth in the past 12 months Now married:
36.2% (5,090)Unmarried:
63.8% (8,953)
Marital status - Black or African American population 15 years and over
Males 60.5% Never married33.2% Now married0.4% Separated1.2% Widowed4.7% DivorcedFemales 52.2% Never married33.5% Now married0.0% Separated4.7% Widowed9.5% DivorcedWomen who gave birth in the past 12 months Now married:
81.0% (220)Unmarried:
19.0% (52)
Women who did not give birth in the past 12 months Now married:
24.9% (778)Unmarried:
75.1% (2,347)
Marital status - American Indian / Alaska Native population 15 years and over
Males 28.3% Never married58.7% Now married1.1% Separated0.0% Widowed12.0% DivorcedFemales 60.1% Never married22.8% Now married9.6% Separated0.0% Widowed7.5% DivorcedWomen who did not give birth in the past 12 months Now married:
23.0% (66)Unmarried:
77.0% (221)
Marital status - Asian population 15 years and over
Males 76.3% Never married17.3% Now married0.0% Separated6.4% Widowed0.0% DivorcedFemales 63.7% Never married32.6% Now married0.0% Separated2.8% Widowed0.9% DivorcedWomen who gave birth in the past 12 months Now married:
0.0% (0)Unmarried:
100.0% (20)
Women who did not give birth in the past 12 months Now married:
15.0% (83)Unmarried:
85.0% (471)
Marital status - Native Hawaiian / Pacific Islander population 15 years and over
Males 81.8% Never married18.2% Now married0.0% Separated0.0% Widowed0.0% DivorcedFemales 55.7% Never married0.0% Now married44.3% Separated0.0% Widowed0.0% DivorcedWomen who did not give birth in the past 12 months Now married:
44.3% (33)Unmarried:
55.7% (41)
Marital status - Other race population 15 years and over
Males 34.2% Never married41.0% Now married2.6% Separated9.6% Widowed12.7% DivorcedFemales 37.7% Never married45.7% Now married0.0% Separated8.0% Widowed8.6% DivorcedWomen who gave birth in the past 12 months Now married:
88.7% (65)Unmarried:
11.3% (8)
Women who did not give birth in the past 12 months Now married:
37.4% (441)Unmarried:
62.6% (738)
Marital status - Two or more races population 15 years and over
Males 42.9% Never married50.7% Now married0.4% Separated1.1% Widowed4.8% DivorcedFemales 42.6% Never married38.1% Now married2.4% Separated5.8% Widowed11.0% DivorcedWomen who gave birth in the past 12 months Now married:
100.0% (217)Unmarried:
0.0% (0)
Women who did not give birth in the past 12 months Now married:
31.0% (1,561)Unmarried:
69.0% (3,472)
Marital status - White alone, not Hispanic / Latino population 15 years and over
Males 43.1% Never married45.0% Now married1.0% Separated2.9% Widowed7.9% DivorcedFemales 36.8% Never married36.9% Now married1.6% Separated11.6% Widowed13.0% DivorcedWomen who gave birth in the past 12 months Now married:
88.6% (365)Unmarried:
11.4% (47)
Women who did not give birth in the past 12 months Now married:
33.6% (3,259)Unmarried:
66.4% (6,451)
Marital status - Hispanic or Latino population 15 years and over
Males 45.9% Never married44.7% Now married0.7% Separated3.0% Widowed5.7% DivorcedFemales 39.0% Never married43.3% Now married2.4% Separated4.0% Widowed11.2% DivorcedWomen who gave birth in the past 12 months Now married:
80.0% (292)Unmarried:
20.0% (73)
Women who did not give birth in the past 12 months Now married:
42.6% (4,298)Unmarried:
57.4% (5,793)
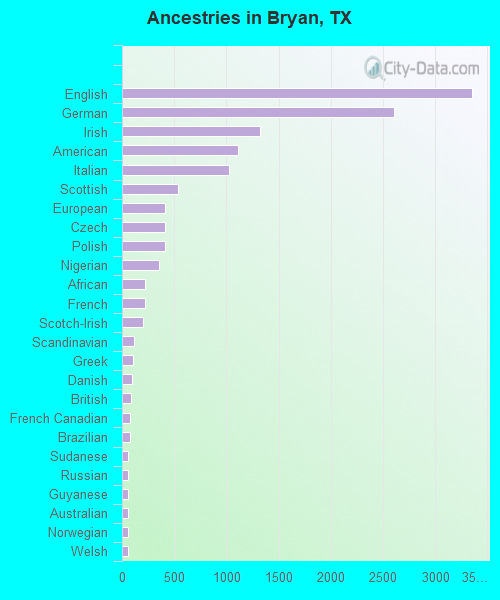
Ancestries in Bryan
3,348 7.0% English2,601 5.4% German1,322 2.8% Irish1,109 2.3% American1,021 2.1% Italian539 1.1% Scottish416 0.9% European412 0.9% Czech408 0.9% Polish357 0.7% Nigerian222 0.5% African220 0.5% French204 0.4% Scotch-Irish119 0.2% Scandinavian102 0.2% Greek97 0.2% Danish83 0.2% British79 0.2% French Canadian77 0.2% Brazilian61 0.1% Sudanese60 0.1% Russian60 0.1% Guyanese54 0.1% Australian54 0.1% Norwegian53 0.1% Welsh48 0.1% Austrian43 0.09% Czechoslovakian42 0.09% Dutch39 0.08% Finnish38 0.08% Armenian26 0.05% South African22 0.05% Turkish21 0.04% Northern European21 0.04% Trinidadian and Tobagonian20 0.04% Swedish20 0.04% Ukrainian18 0.04% Swiss16 0.03% Portuguese14 0.03% Egyptian14 0.03% Albanian14 0.03% British West Indian12 0.03% Romanian12 0.03% Yugoslavian11 0.02% Arab10 0.02% Palestinian10 0.02% Belgian8 0.02% Canadian
Geographical mobility in Bryan Same house 1 year ago 42,061 81.2% White (Caucasian)6,936 66.1% Black or African American404 76.0% American Indian / Alaska Native937 68.3% Asian75 62.7% Native Hawaiian / Pacific Islander5,074 78.5% Other race15,054 86.8% Two or more races26,917 75.5% White alone, not Hispanic / Latino33,559 87.3% Hispanic or LatinoMoved within same county 4,375 8.4% White / Caucasian3,080 29.3% Black or African American89 16.8% American Indian / Alaska Native142 10.4% Asian815 12.6% Other race1,115 6.4% Two or more races3,911 11.0% White alone, not Hispanic / Latino3,203 8.3% Hispanic or LatinoMoved within same state 3,657 7.1% White / Caucasian422 4.0% Black or African American23 4.3% American Indian / Alaska Native170 12.4% Asian65 54.5% Native Hawaiian / Pacific Islander523 8.1% Other race712 4.1% Two or more races3,141 8.8% White alone, not Hispanic / Latino1,408 3.7% Hispanic or LatinoMoved from different state 1,375 2.7% White / Caucasian47 0.4% Black or African American2 0.3% American Indian / Alaska Native226 1.3% Two or more races1,375 3.9% White alone, not Hispanic / LatinoMoved from abroad 319 0.6% White15 0.1% Black or African American68 5.0% Asian49 0.8% Other race235 1.4% Two or more races319 0.9% White alone, not Hispanic / Latino284 0.7% Hispanic or Latino
Children Nativity (place of birth) in Bryan
Children under 6 years - Living with two parents Both parents native 2,305 100.0% NativeBoth parents foreign-born 631 100.0% NativeOne native, one foreign-born parent 363 100.0% NativeChildren under 6 years - Living with one parent Native parent 3,789 100.0% NativeForeign-born parent 336 100.0% NativeChildren 6 to 17 years - Living with two parents Both parents native 3,654 99.1% Native34 0.9% Foreign-bornBoth parents foreign-born 2,128 95.9% Native91 4.1% Foreign-bornOne native, one foreign-born parent 988 100.0% NativeChildren 6 to 17 years - Living with one parent Native parent 4,125 100.0% NativeForeign-born parent 1,240 51.9% Native1,148 48.1% Foreign-born
Grandparents responsible for own grandchildren in Bryan
Grandparents (30 to 59 years) White / Caucasian 203 43.8% Responsible for grandchildren261 56.2% Not responsible for grandchildrenBlack or African American 106 65.5% Responsible for grandchildren56 34.5% Not responsible for grandchildrenOther race 33 82.7% Responsible for grandchildren7 17.3% Not responsible for grandchildrenTwo or more races 302 100.0% Responsible for grandchildrenWhite alone, not Hispanic / Latino 122 79.2% Responsible for grandchildren32 20.8% Not responsible for grandchildrenHispanic or Latino 276 42.5% Responsible for grandchildren373 57.5% Not responsible for grandchildrenGrandparents (60 years and over) White / Caucasian 187 43.7% Responsible for grandchildren240 56.3% Not responsible for grandchildrenBlack or African American 58 45.0% Responsible for grandchildren71 55.0% Not responsible for grandchildrenOther race 11 9.3% Responsible for grandchildren106 90.7% Not responsible for grandchildrenTwo or more races 26 58.0% Responsible for grandchildren19 42.0% Not responsible for grandchildrenWhite alone, not Hispanic / Latino 108 71.0% Responsible for grandchildren44 29.0% Not responsible for grandchildrenHispanic or Latino 163 27.2% Responsible for grandchildren437 72.8% Not responsible for grandchildren