Races in Busti, New York (NY) Detailed Stats
Ancestries, Foreign-born residents, place of birth

Data:
1.1% of Busti, NY residents are foreign-born , which is 1908.5% less than the foreign-born rate of 22.0% across the entire state of New York.
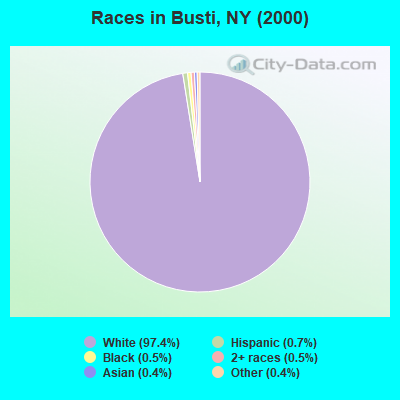
Race distribution in Busti

- 7,56197.4%White alone
- 550.7%Hispanic
- 390.5%Black alone
- 360.5%Two or more races
- 330.4%Asian alone
- 300.4%Other race alone
- 60.08%American Indian alone
2000
2022
-
- 11,760,98162.0%White alone
- 2,867,58315.1%Hispanic
- 2,812,62314.8%Black alone
- 1,035,9265.5%Asian alone
- 366,1161.9%Two or more races
- 75,4990.4%Other race alone
- 52,4990.3%American Indian alone
- 5,2300.03%Native Hawaiian and Other
Pacific Islander alone
-
- 10,408,93352.9%White alone
- 3,867,29919.7%Hispanic
- 2,633,84013.4%Black alone
- 1,776,2869.0%Asian alone
- 732,6703.7%Two or more races
- 216,1101.1%Other race alone
- 35,0820.2%American Indian alone
- 6,9310.04%Native Hawaiian and Other
Pacific Islander alone
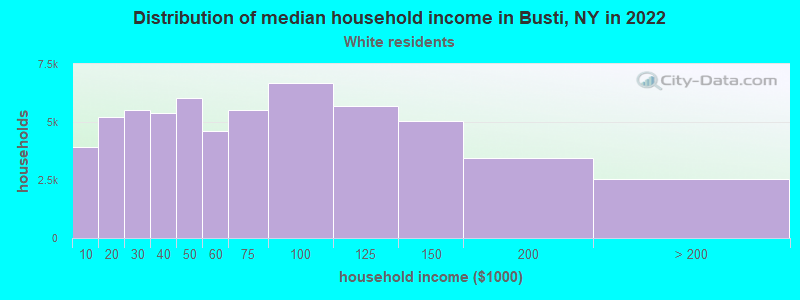
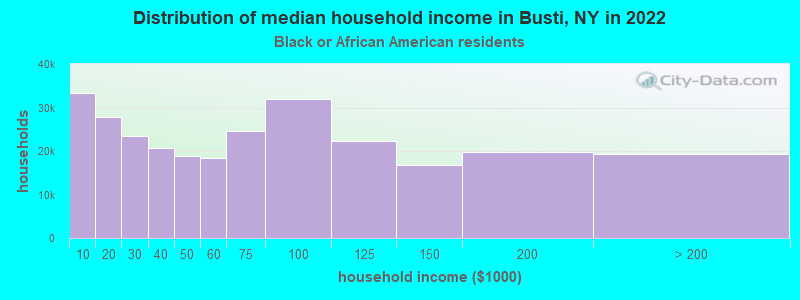
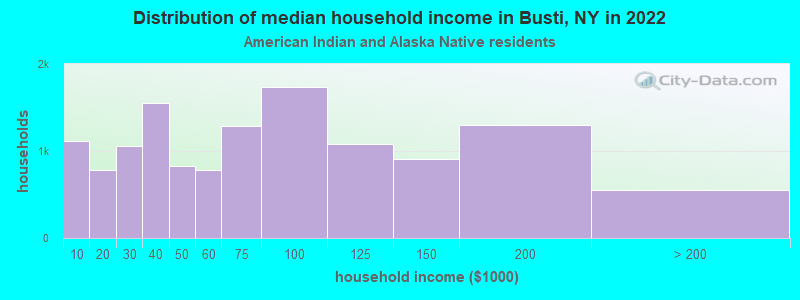
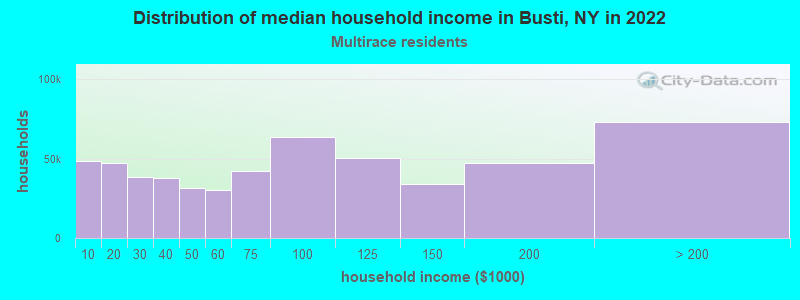
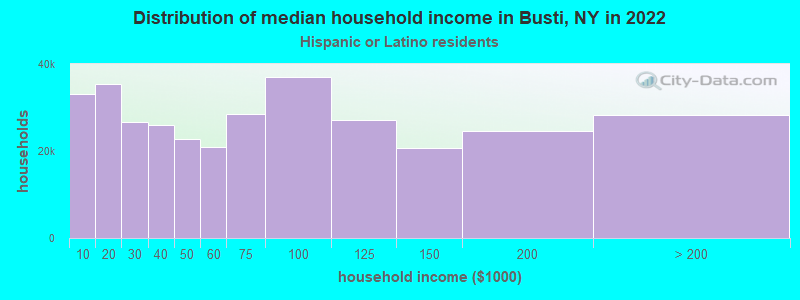
Income and house value in Busti
- Median household income in 2022
- $69,365White non-Hispanic householders
- $35,854Black householders
- $37,135American Indian and Alaska Native householders
- $76,149Two or more races householders
- $23,204Hispanic or Latino race householders
- Median 2022 house value
- $152,196White Non-Hispanic householders
- $317,484Black or African American householders
- $126,993American Indian or Alaska Native householders
- $67,013Two or more races householders
- $154,736Hispanic or Latino householders
Foreign-born residents in Busti
85 residents are foreign born
| This city: | 1.1% |
| New York: | 20.4% |
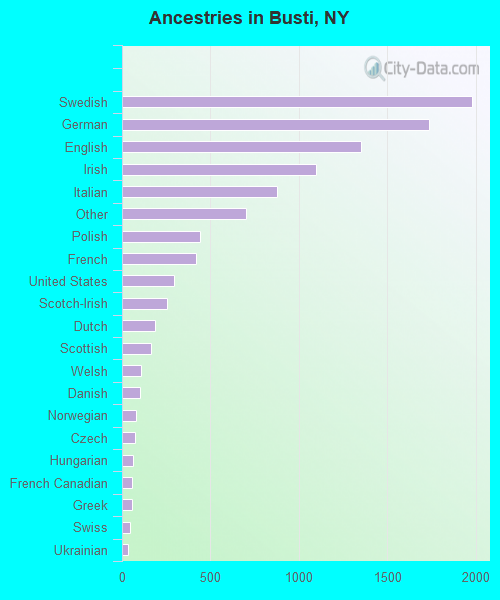
Ancestries in Busti

- 1,97519.5%Swedish
- 1,73217.1%German
- 1,35313.4%English
- 1,09510.8%Irish
- 8778.7%Italian
- 6996.9%Other
- 4394.3%Polish
- 4194.1%French
- 2962.9%United States
- 2562.5%Scotch-Irish
- 1881.9%Dutch
- 1631.6%Scottish
- 1081.1%Welsh
- 1031.0%Danish
- 800.8%Norwegian
- 720.7%Czech
- 630.6%Hungarian
- 590.6%French Canadian
- 540.5%Greek
- 430.4%Swiss
- 340.3%Ukrainian
- 170.2%Slovak