Races in Caledonia, Wisconsin (WI) Detailed Stats
Data:
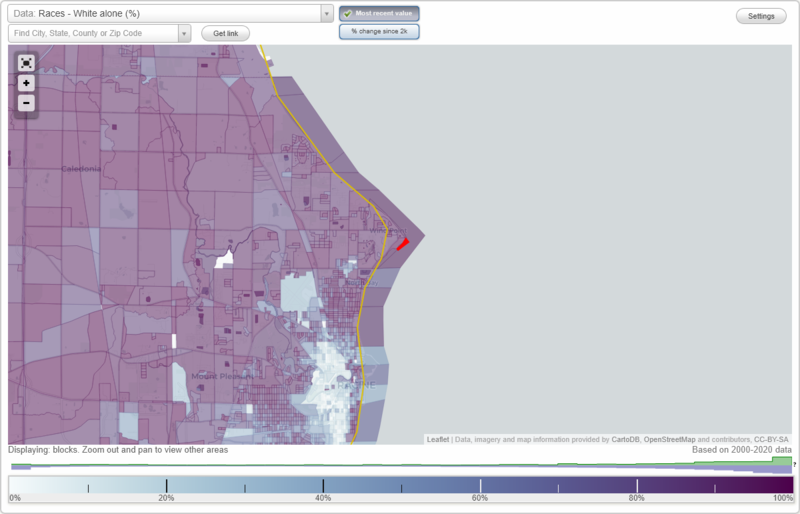
Races - White alone (%)
Races - White alone (% change since 2000)
Races - Black alone (%)
Races - Black alone (% change since 2000)
Races - American Indian alone (%)
Races - American Indian alone (% change since 2000)
Races - Asian alone (%)
Races - Asian alone (% change since 2000)
Races - Hispanic (%)
Races - Hispanic (% change since 2000)
Races - Native Hawaiian and Other Pacific Islander alone (%)
Races - Native Hawaiian and Other Pacific Islander alone (% change since 2000)
Races - Two or more races(%)
Races - Two or more races(% change since 2000)
Races - Other race alone (%)
Races - Other race alone (% change since 2000)
Racial diversity
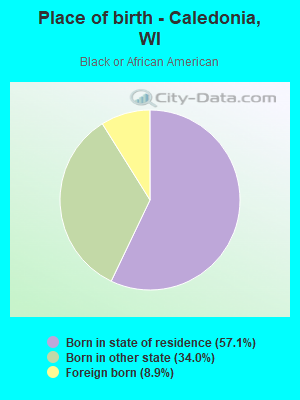
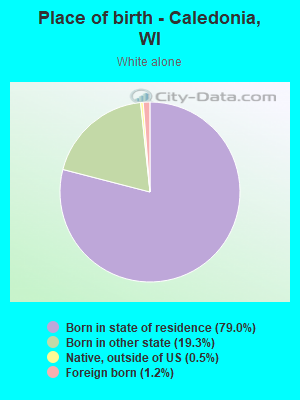
Place of birth - Born in state of residence (%)
Place of birth - Born in state of residence (%) - White
Place of birth - Born in state of residence (%) - Black or African American
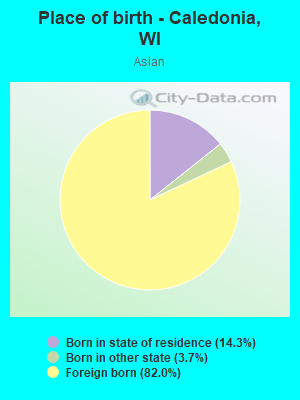
Place of birth - Born in state of residence (%) - Asian
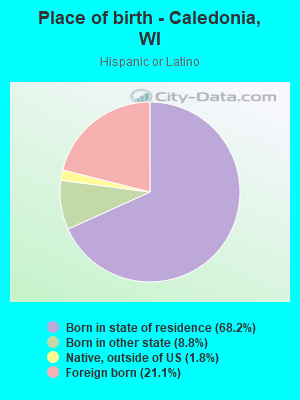
Place of birth - Born in state of residence (%) - Hispanic or Latino
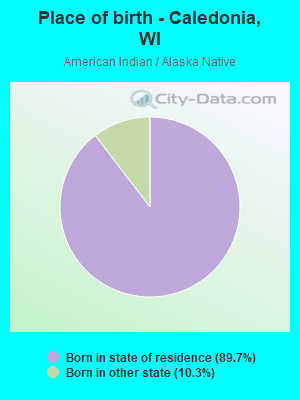
Place of birth - Born in state of residence (%) - American Indian and Alaska Native
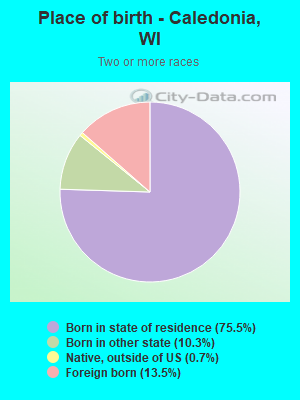
Place of birth - Born in state of residence (%) - Multirace
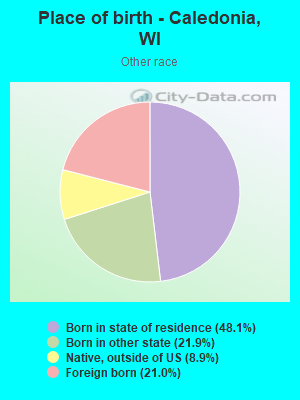
Place of birth - Born in state of residence (%) - Other Race
Place of birth - Born in other state (%)
Place of birth - Born in other state (%) - White
Place of birth - Born in other state (%) - Black or African American
Place of birth - Born in other state (%) - Asian
Place of birth - Born in other state (%) - Hispanic or Latino
Place of birth - Born in other state (%) - American Indian and Alaska Native
Place of birth - Born in other state (%) - Multirace
Place of birth - Born in other state (%) - Other Race
Place of birth - Native, outside of US (%)
Place of birth - Native, outside of US (%) - White
Place of birth - Native, outside of US (%) - Black or African American
Place of birth - Native, outside of US (%) - Asian
Place of birth - Native, outside of US (%) - Hispanic or Latino
Place of birth - Native, outside of US (%) - American Indian and Alaska Native
Place of birth - Native, outside of US (%) - Multirace
Place of birth - Native, outside of US (%) - Other Race
Place of birth - Foreign born (%)
Place of birth - Foreign born (%) - White
Place of birth - Foreign born (%) - Black or African American
Place of birth - Foreign born (%) - Asian
Place of birth - Foreign born (%) - Hispanic or Latino
Place of birth - Foreign born (%) - American Indian and Alaska Native
Place of birth - Foreign born (%) - Multirace
Place of birth - Foreign born (%) - Other Race
Residents speaking English at home (%)
Residents speaking English at home - Born in the United States (%)
Residents speaking English at home - Native, born elsewhere (%)
Residents speaking English at home - Foreign born (%)
Residents speaking Spanish at home (%)
Residents speaking Spanish at home - Born in the United States (%)
Residents speaking Spanish at home - Native, born elsewhere (%)
Residents speaking Spanish at home - Foreign born (%)
Residents speaking other language at home (%)
Residents speaking other language at home - Born in the United States (%)
Residents speaking other language at home - Native, born elsewhere (%)
Residents speaking other language at home - Foreign born (%)
Marital status - Never married (%)
Marital status - Now married (%)
Marital status - Separated (%)
Marital status - Widowed (%)
Marital status - Divorced (%)
Ancestries Reported - Arab (%)
Ancestries Reported - Czech (%)
Ancestries Reported - Danish (%)
Ancestries Reported - Dutch (%)
Ancestries Reported - English (%)
Ancestries Reported - French (%)
Ancestries Reported - French Canadian (%)
Ancestries Reported - German (%)
Ancestries Reported - Greek (%)
Ancestries Reported - Hungarian (%)
Ancestries Reported - Irish (%)
Ancestries Reported - Italian (%)
Ancestries Reported - Lithuanian (%)
Ancestries Reported - Norwegian (%)
Ancestries Reported - Polish (%)
Ancestries Reported - Portuguese (%)
Ancestries Reported - Russian (%)
Ancestries Reported - Scotch-Irish (%)
Ancestries Reported - Scottish (%)
Ancestries Reported - Slovak (%)
Ancestries Reported - Subsaharan African (%)
Ancestries Reported - Swedish (%)
Ancestries Reported - Swiss (%)
Ancestries Reported - Ukrainian (%)
Ancestries Reported - United States (%)
Ancestries Reported - Welsh (%)
Ancestries Reported - West Indian (%)
Ancestries Reported - Other (%)
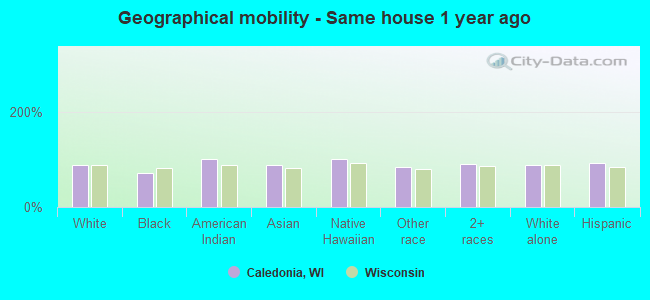
Geographical mobility - Same house 1 year ago (%)
Geographical mobility - Same house 1 year ago (%) - White
Geographical mobility - Same house 1 year ago (%) - Black or African American
Geographical mobility - Same house 1 year ago (%) - Asian
Geographical mobility - Same house 1 year ago (%) - Hispanic or Latino
Geographical mobility - Same house 1 year ago (%) - American Indian and Alaska Native
Geographical mobility - Same house 1 year ago (%) - Multirace
Geographical mobility - Same house 1 year ago (%) - Other Race
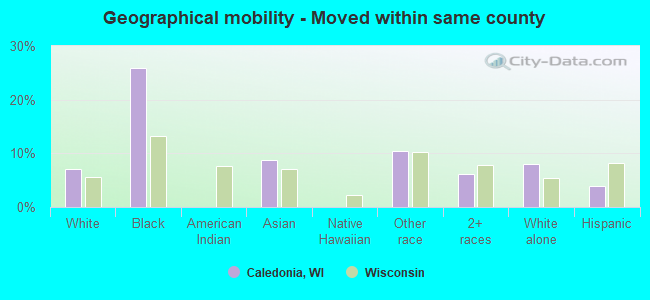
Geographical mobility - Moved within same county (%)
Geographical mobility - Moved within same county (%) - White
Geographical mobility - Moved within same county (%) - Black or African American
Geographical mobility - Moved within same county (%) - Asian
Geographical mobility - Moved within same county (%) - Hispanic or Latino
Geographical mobility - Moved within same county (%) - American Indian and Alaska Native
Geographical mobility - Moved within same county (%) - Multirace
Geographical mobility - Moved within same county (%) - Other Race
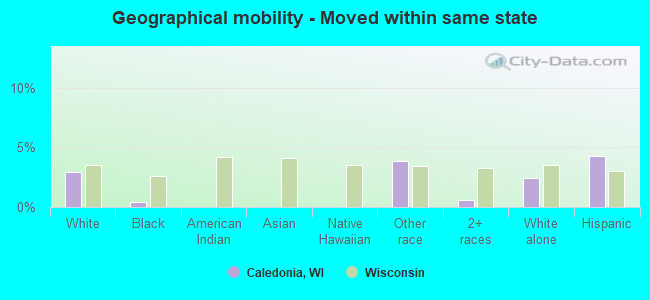
Geographical mobility - Moved from different county within same state (%)
Geographical mobility - Moved from different county within same state (%) - White
Geographical mobility - Moved from different county within same state (%) - Black or African American
Geographical mobility - Moved from different county within same state (%) - Asian
Geographical mobility - Moved from different county within same state (%) - Hispanic or Latino
Geographical mobility - Moved from different county within same state (%) - American Indian and Alaska Native
Geographical mobility - Moved from different county within same state (%) - Multirace
Geographical mobility - Moved from different county within same state (%) - Other Race
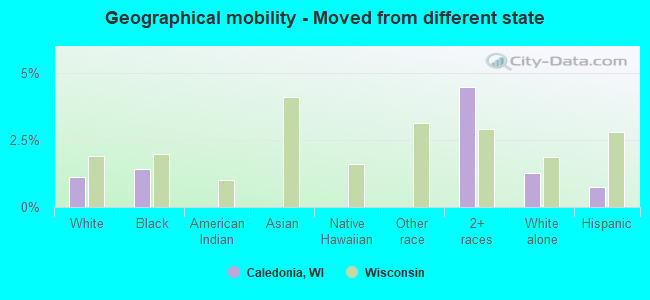
Geographical mobility - Moved from different state (%)
Geographical mobility - Moved from different state (%) - White
Geographical mobility - Moved from different state (%) - Black or African American
Geographical mobility - Moved from different state (%) - Asian
Geographical mobility - Moved from different state (%) - Hispanic or Latino
Geographical mobility - Moved from different state (%) - American Indian and Alaska Native
Geographical mobility - Moved from different state (%) - Multirace
Geographical mobility - Moved from different state (%) - Other Race
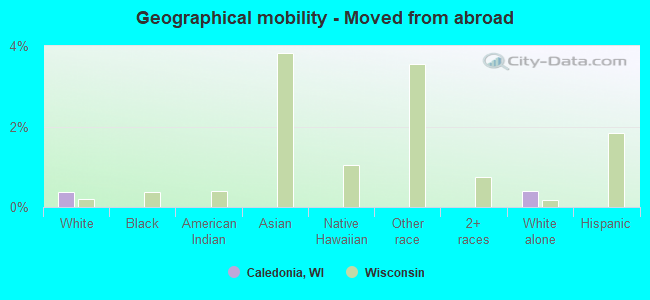
Geographical mobility - Moved from abroad (%)
Geographical mobility - Moved from abroad (%) - White
Geographical mobility - Moved from abroad (%) - Black or African American
Geographical mobility - Moved from abroad (%) - Asian
Geographical mobility - Moved from abroad (%) - Hispanic or Latino
Geographical mobility - Moved from abroad (%) - American Indian and Alaska Native
Geographical mobility - Moved from abroad (%) - Multirace
Geographical mobility - Moved from abroad (%) - Other Race
Place of birth for the foreign-born population - Ireland (%)
Place of birth for the foreign-born population - Denmark (%)
Place of birth for the foreign-born population - Norway (%)
Place of birth for the foreign-born population - Sweden (%)
Place of birth for the foreign-born population - United Kingdom (%)
Place of birth for the foreign-born population - England (%)
Place of birth for the foreign-born population - Scotland (%)
Place of birth for the foreign-born population - Other Northern Europe (%)
Place of birth for the foreign-born population - Austria (%)
Place of birth for the foreign-born population - Belgium (%)
Place of birth for the foreign-born population - France (%)
Place of birth for the foreign-born population - Germany (%)
Place of birth for the foreign-born population - Netherlands (%)
Place of birth for the foreign-born population - Switzerland (%)
Place of birth for the foreign-born population - Other Western Europe (%)
Place of birth for the foreign-born population - Greece (%)
Place of birth for the foreign-born population - Italy (%)
Place of birth for the foreign-born population - Portugal (%)
Place of birth for the foreign-born population - Spain (%)
Place of birth for the foreign-born population - Other Southern Europe (%)
Place of birth for the foreign-born population - Albania (%)
Place of birth for the foreign-born population - Belarus (%)
Place of birth for the foreign-born population - Bosnia and Herzegovina (%)
Place of birth for the foreign-born population - Bulgaria (%)
Place of birth for the foreign-born population - Croatia (%)
Place of birth for the foreign-born population - Czechoslovakia (%)
Place of birth for the foreign-born population - Hungary (%)
Place of birth for the foreign-born population - Latvia (%)
Place of birth for the foreign-born population - Lithuania (%)
Place of birth for the foreign-born population - North Macedonia (Macedonia) (%)
Place of birth for the foreign-born population - Moldova (%)
Place of birth for the foreign-born population - Poland (%)
Place of birth for the foreign-born population - Romania (%)
Place of birth for the foreign-born population - Russia (%)
Place of birth for the foreign-born population - Serbia (%)
Place of birth for the foreign-born population - Ukraine (%)
Place of birth for the foreign-born population - Other Eastern Europe (%)
Place of birth for the foreign-born population - China (%)
Place of birth for the foreign-born population - Hong Kong (%)
Place of birth for the foreign-born population - Taiwan (%)
Place of birth for the foreign-born population - Japan (%)
Place of birth for the foreign-born population - Korea (%)
Place of birth for the foreign-born population - Other Eastern Asia (%)
Place of birth for the foreign-born population - Afghanistan (%)
Place of birth for the foreign-born population - Bangladesh (%)
Place of birth for the foreign-born population - India (%)
Place of birth for the foreign-born population - Iran (%)
Place of birth for the foreign-born population - Kazakhstan (%)
Place of birth for the foreign-born population - Nepal (%)
Place of birth for the foreign-born population - Pakistan (%)
Place of birth for the foreign-born population - Sri Lanka (%)
Place of birth for the foreign-born population - Uzbekistan (%)
Place of birth for the foreign-born population - Other South Central Asia (%)
Place of birth for the foreign-born population - Burma (%)
Place of birth for the foreign-born population - Cambodia (%)
Place of birth for the foreign-born population - Indonesia (%)
Place of birth for the foreign-born population - Laos (%)
Place of birth for the foreign-born population - Malaysia (%)
Place of birth for the foreign-born population - Philippines (%)
Place of birth for the foreign-born population - Singapore (%)
Place of birth for the foreign-born population - Thailand (%)
Place of birth for the foreign-born population - Vietnam (%)
Place of birth for the foreign-born population - Other South Eastern Asia (%)
Place of birth for the foreign-born population - Armenia (%)
Place of birth for the foreign-born population - Iraq (%)
Place of birth for the foreign-born population - Israel (%)
Place of birth for the foreign-born population - Jordan (%)
Place of birth for the foreign-born population - Kuwait (%)
Place of birth for the foreign-born population - Lebanon (%)
Place of birth for the foreign-born population - Saudi Arabia (%)
Place of birth for the foreign-born population - Syria (%)
Place of birth for the foreign-born population - Turkey (%)
Place of birth for the foreign-born population - Yemen (%)
Place of birth for the foreign-born population - Other Western Asia (%)
Place of birth for the foreign-born population - Eritrea (%)
Place of birth for the foreign-born population - Ethiopia (%)
Place of birth for the foreign-born population - Kenya (%)
Place of birth for the foreign-born population - Somalia (%)
Place of birth for the foreign-born population - Uganda (%)
Place of birth for the foreign-born population - Zimbabwe (%)
Place of birth for the foreign-born population - Other Eastern Africa (%)
Place of birth for the foreign-born population - Cameroon (%)
Place of birth for the foreign-born population - Congo (%)
Place of birth for the foreign-born population - Democratic Republic of Congo (Zaire) (%)
Place of birth for the foreign-born population - Other Middle Africa (%)
Place of birth for the foreign-born population - Egypt (%)
Place of birth for the foreign-born population - Morocco (%)
Place of birth for the foreign-born population - Sudan (%)
Place of birth for the foreign-born population - Other Northern Africa (%)
Place of birth for the foreign-born population - South Africa (%)
Place of birth for the foreign-born population - Other Southern Africa (%)
Place of birth for the foreign-born population - Cabo Verde (%)
Place of birth for the foreign-born population - Ghana (%)
Place of birth for the foreign-born population - Liberia (%)
Place of birth for the foreign-born population - Nigeria (%)
Place of birth for the foreign-born population - Senegal (%)
Place of birth for the foreign-born population - Sierra Leone (%)
Place of birth for the foreign-born population - Other Western Africa (%)
Place of birth for the foreign-born population - Australia (%)
Place of birth for the foreign-born population - New Zealand (%)
Place of birth for the foreign-born population - Fiji (%)
Place of birth for the foreign-born population - Micronesia (%)
Place of birth for the foreign-born population - Bahamas (%)
Place of birth for the foreign-born population - Barbados (%)
Place of birth for the foreign-born population - Cuba (%)
Place of birth for the foreign-born population - Dominica (%)
Place of birth for the foreign-born population - Dominican Republic (%)
Place of birth for the foreign-born population - Grenada (%)
Place of birth for the foreign-born population - Haiti (%)
Place of birth for the foreign-born population - Jamaica (%)
Place of birth for the foreign-born population - St. Vincent and the Grenadines (%)
Place of birth for the foreign-born population - Trinidad and Tobago (%)
Place of birth for the foreign-born population - West Indies (%)
Place of birth for the foreign-born population - Other Caribbean (%)
Place of birth for the foreign-born population - Belize (%)
Place of birth for the foreign-born population - Costa Rica (%)
Place of birth for the foreign-born population - El Salvador (%)
Place of birth for the foreign-born population - Guatemala (%)
Place of birth for the foreign-born population - Honduras (%)
Place of birth for the foreign-born population - Mexico (%)
Place of birth for the foreign-born population - Nicaragua (%)
Place of birth for the foreign-born population - Panama (%)
Place of birth for the foreign-born population - Other Central America (%)
Place of birth for the foreign-born population - Argentina (%)
Place of birth for the foreign-born population - Bolivia (%)
Place of birth for the foreign-born population - Brazil (%)
Place of birth for the foreign-born population - Chile (%)
Place of birth for the foreign-born population - Colombia (%)
Place of birth for the foreign-born population - Ecuador (%)
Place of birth for the foreign-born population - Guyana (%)
Place of birth for the foreign-born population - Peru (%)
Place of birth for the foreign-born population - Uruguay (%)
Place of birth for the foreign-born population - Venezuela (%)
Place of birth for the foreign-born population - Other South America (%)
Place of birth for the foreign-born population - Canada (%)
Place of birth for the foreign-born population - Other Northern America (%)
Place of birth for the foreign-born population - Other (%)
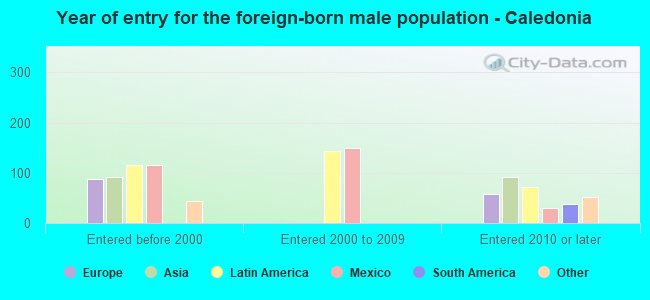
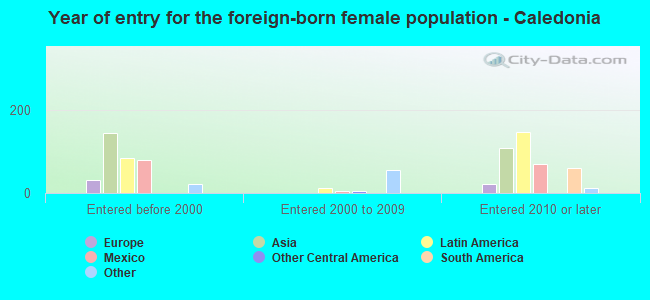
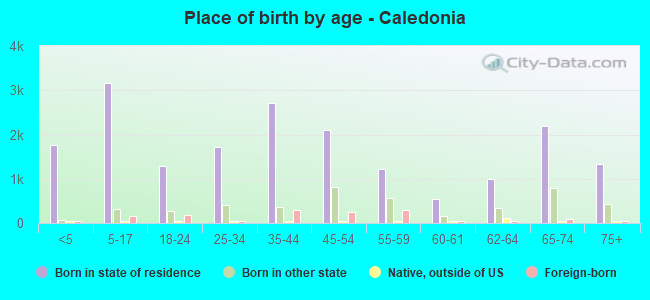
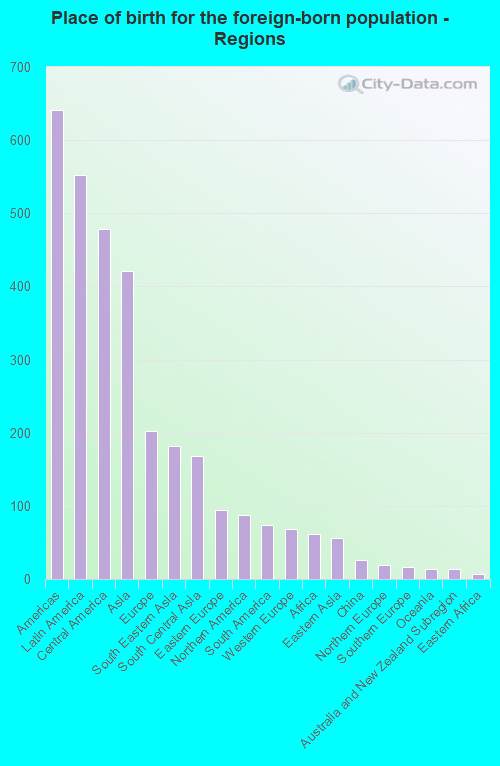
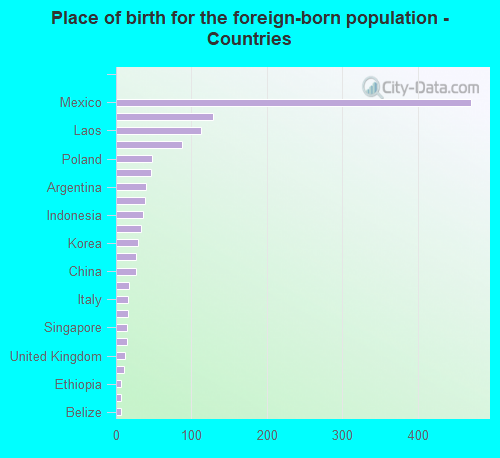
According to 2022 data, the most numerous races in Caledonia, WI are White alone (19,578 residents), Hispanic (2,897 residents), and Black alone (755 residents). 92.1% of Caledonia residents speak English at home. 5.3% of Caledonia, WI residents are foreign-born (2.2% born in Latin America, 1.7% born in Asia, 0.8% born in Europe), which is 6.4% greater than the foreign-born rate of 5.0% across the entire state of Wisconsin.
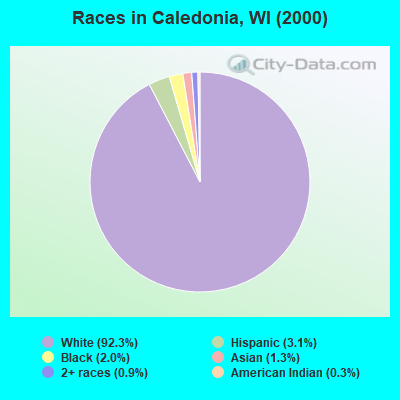
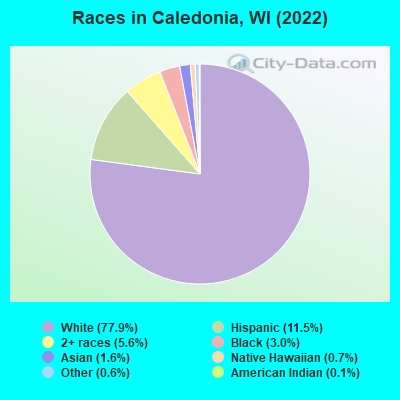
Race distribution in Caledonia
2000 2022
4,681,630 87.3% White alone 300,245 5.6% Black alone 192,921 3.6% Hispanic 87,995 1.6% Asian alone 51,921 1.0% Two or more races 43,980 0.8% American Indian alone 3,637 0.07% Other race alone 1,346 0.03% Native Hawaiian and Other
4,654,031 79.0% White alone 447,022 7.6% Hispanic 345,678 5.9% Black alone 217,532 3.7% Two or more races 172,242 2.9% Asian alone 33,762 0.6% American Indian alone 19,680 0.3% Other race alone 2,592 0.04% Native Hawaiian and Other
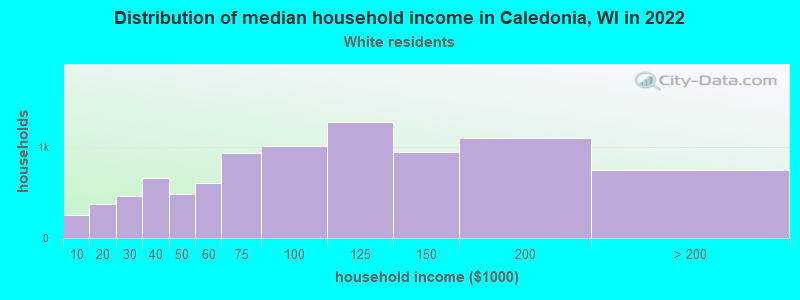
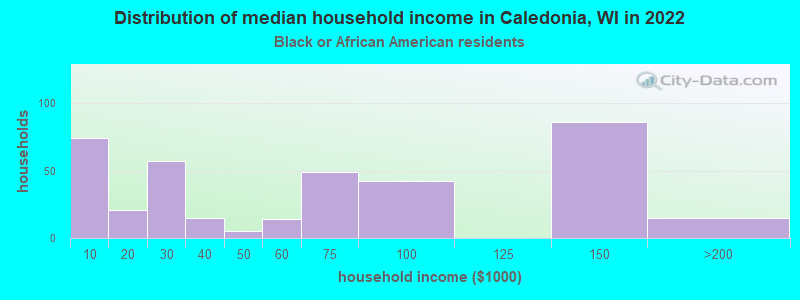
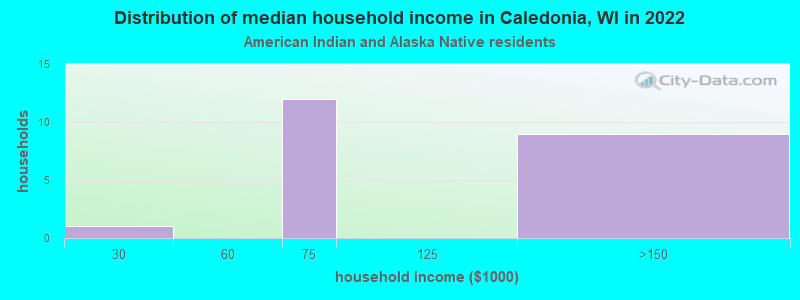
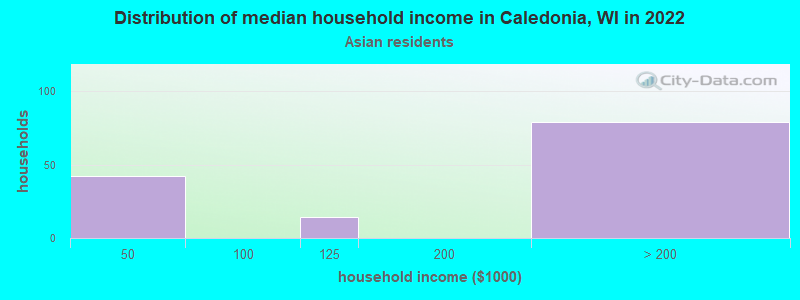
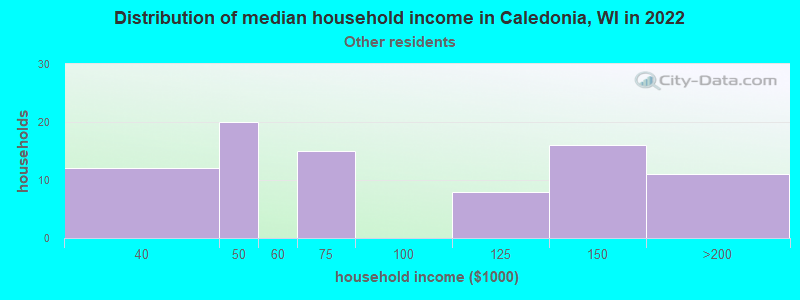
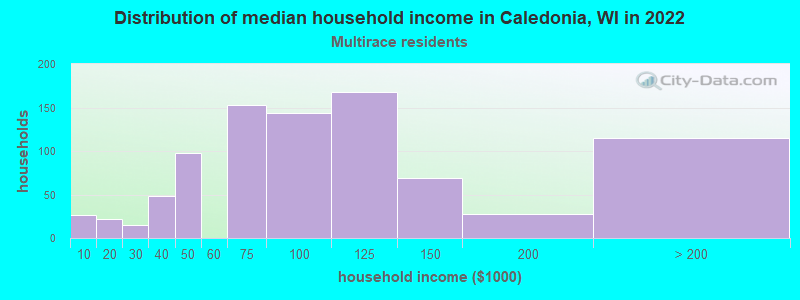
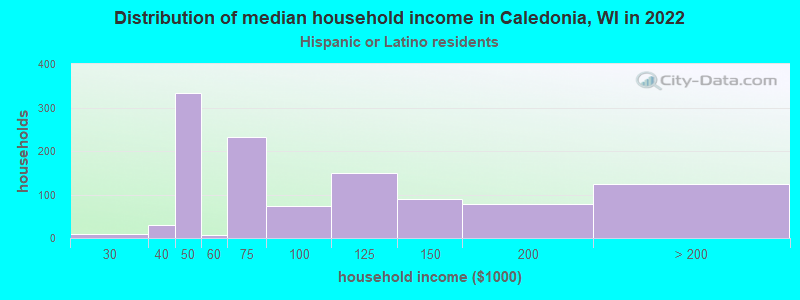
Income and house value in Caledonia Median household income in 2022 $89,821 White non-Hispanic householdersover $200,000 Asian householders$91,602 Two or more races householders$82,129 Hispanic or Latino race householdersMedian 2022 house value $274,055 White Non-Hispanic householders$203,909 Black or African American householders$132,541 American Indian or Alaska Native householders $359,085 Asian householders$237,147 Some other race householders$280,376 Two or more races householders$223,485 Hispanic or Latino householders
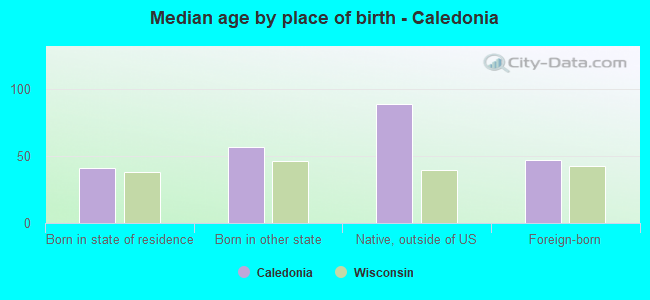
Median age by race in Caledonia
48.8 Median age for White residents47.5 49.6 48.7 Median age for Black or African American residents31.3 57.8 23.4 Median age for American Indian / Alaska Native residents11.3 43.9 42.1 Median age for Asian residents42.5 42.6 -825,688,072.6 Median age for Native Hawaiian / Pacific Islander residents-862,745,097.2 -732,444,443.7 61.0 Median age for Other race residents49.5 76.6 21.2 Median age for Two or more races residents22.4 19.4 48.8 Median age for White alone residents47.9 49.4 27.5 Median age for Hispanic or Latino residents22.9 32.9
Owner/renter occupied households by race in Caledonia
House owners and renters - White residents 7,394 82.6% Owner occupied1,561 17.4% Renter occupiedHouse owners and renters - Black or African American residents 166 48.9% Owner occupied173 51.1% Renter occupiedHouse owners and renters - American Indian / Alaska Native residents 22 100.0% Owner occupiedHouse owners and renters - Asian residents 90 78.5% Owner occupied25 21.5% Renter occupiedHouse owners and renters - Other race residents 83 82.2% Owner occupied18 17.8% Renter occupiedHouse owners and renters - Two or more races residents 755 84.0% Owner occupied144 16.0% Renter occupiedHouse owners and renters - White alone residents 7,107 81.4% Owner occupied1,627 18.6% Renter occupiedHouse owners and renters - Hispanic or Latino residents 863 90.3% Owner occupied93 9.7% Renter occupied
Language usage in Caledonia
English speakers - Total 92.1% of residents of Caledonia speak English at home.
4.7% of residents speak Spanish at home 631 57.9% Speak English very well459 42.1% Speak English less than very well3.1% of residents speak other language at home 456 62.5% Speak English very well274 37.5% Speak English less than very well
English speakers - Born in the United States 95.5% of residents of Caledonia speak English at home.
3.0% of residents speak Spanish at home 113 83.1% Speak English very well23 16.9% Speak English less than very well2.1% of residents speak other language at home 93 100.0% Speak English very well
English speakers - Native, born elsewhere 97.5% of residents of Caledonia speak English at home.
35.6% of residents speak Spanish at home 45 52.9% Speak English very well40 47.1% Speak English less than very well
English speakers - Foreign-born 9.1% of residents of Caledonia speak English at home.
44.0% of residents speak Spanish at home 162 27.8% Speak English very well421 72.2% Speak English less than very well42.4% of residents speak other language at home 306 54.4% Speak English very well256 45.6% Speak English less than very well
White (Caucasian) - Speak only English Native:
98.8% (18,385)Foreign-born:
17.0% (47)
White (Caucasian) - Speak another language Native:
1.5% (284)Foreign-born:
85.4% (238)
Black or African American - Speak only English Native:
100.0% (643)Foreign-born:
67.7% (57)
Asian - Speak only English Native:
100.0% (50)Foreign-born:
11.8% (42)
Asian - Speak another language Native:
5.7% (3)Foreign-born:
92.0% (326)
Other race - Speak another language Native:
31.9% (88)Foreign-born:
100.0% (79)
Two or more races - Speak another language Native:
9.7% (235)Foreign-born:
100.0% (399)
White alone - Speak only English Native:
98.8% (17,916)Foreign-born:
24.9% (56)
White alone - Speak another language Native:
1.1% (208)Foreign-born:
82.7% (187)
Hispanic or Latino - Speak another language Native:
25.1% (502)Foreign-born:
100.0% (591)
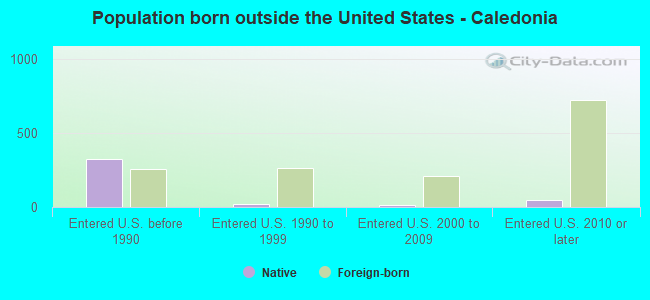
Foreign-born residents in Caledonia 1,342 residents are foreign born (2.2% Latin America , 1.7% Asia , 0.8% Europe ).
This city:
5.3%Wisconsin:
5.0%
Marital status for residents in Caledonia Marital status - White (Caucasian) population 15 years and over
Males 23.8% Never married63.9% Now married0.3% Separated3.5% Widowed8.4% DivorcedFemales 18.6% Never married60.5% Now married0.2% Separated7.6% Widowed13.1% DivorcedWomen who gave birth in the past 12 months Now married:
84.7% (154)Unmarried:
15.3% (28)
Women who did not give birth in the past 12 months Now married:
58.3% (2,098)Unmarried:
41.7% (1,502)
Marital status - Black or African American population 15 years and over
Males 31.0% Never married40.8% Now married6.5% Separated6.5% Widowed15.2% DivorcedFemales 53.2% Never married29.7% Now married0.0% Separated2.9% Widowed14.1% DivorcedWomen who gave birth in the past 12 months Now married:
0.0% (0)Unmarried:
100.0% (43)
Women who did not give birth in the past 12 months Now married:
7.8% (10)Unmarried:
92.2% (121)
Marital status - American Indian / Alaska Native population 15 years and over
Males 26.7% Never married73.3% Now married0.0% Separated0.0% Widowed0.0% DivorcedFemales 0.0% Never married95.7% Now married0.0% Separated0.0% Widowed4.3% DivorcedWomen who did not give birth in the past 12 months Now married:
100.0% (7)Unmarried:
0.0% (0)
Marital status - Asian population 15 years and over
Males 22.7% Never married66.3% Now married0.0% Separated0.0% Widowed11.0% DivorcedFemales 11.8% Never married88.2% Now married0.0% Separated0.0% Widowed0.0% DivorcedWomen who did not give birth in the past 12 months Now married:
72.0% (66)Unmarried:
28.0% (26)
Marital status - Other race population 15 years and over
Males 29.0% Never married61.9% Now married0.0% Separated9.0% Widowed0.0% DivorcedFemales 17.6% Never married64.7% Now married0.0% Separated0.0% Widowed17.6% DivorcedWomen who did not give birth in the past 12 months Now married:
40.9% (16)Unmarried:
59.1% (24)
Marital status - Two or more races population 15 years and over
Males 42.8% Never married55.8% Now married1.4% Separated0.0% Widowed0.0% DivorcedFemales 40.1% Never married46.1% Now married0.0% Separated0.0% Widowed13.8% DivorcedWomen who did not give birth in the past 12 months Now married:
40.7% (377)Unmarried:
59.3% (549)
Marital status - White alone, not Hispanic / Latino population 15 years and over
Males 23.5% Never married63.6% Now married0.3% Separated3.8% Widowed8.9% DivorcedFemales 17.6% Never married61.0% Now married0.2% Separated8.0% Widowed13.2% DivorcedWomen who gave birth in the past 12 months Now married:
81.9% (133)Unmarried:
18.1% (29)
Women who did not give birth in the past 12 months Now married:
60.0% (2,081)Unmarried:
40.0% (1,386)
Marital status - Hispanic or Latino population 15 years and over
Males 37.3% Never married60.2% Now married0.0% Separated1.5% Widowed1.0% DivorcedFemales 31.4% Never married52.5% Now married0.0% Separated0.0% Widowed16.1% DivorcedWomen who gave birth in the past 12 months Now married:
100.0% (30)Unmarried:
0.0% (0)
Women who did not give birth in the past 12 months Now married:
44.8% (290)Unmarried:
55.2% (357)
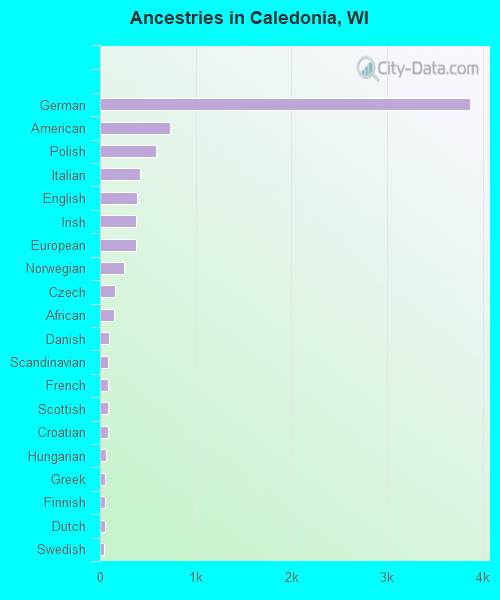
Ancestries in Caledonia
3,874 34.7% German731 6.5% American583 5.2% Polish421 3.8% Italian391 3.5% English379 3.4% Irish376 3.4% European252 2.3% Norwegian158 1.4% Czech145 1.3% African97 0.9% Danish87 0.8% Scandinavian85 0.8% French81 0.7% Scottish80 0.7% Croatian59 0.5% Hungarian56 0.5% Greek56 0.5% Finnish55 0.5% Dutch37 0.3% Swedish35 0.3% Czechoslovakian34 0.3% Armenian33 0.3% Iranian29 0.3% Eastern European28 0.3% Palestinian28 0.3% French Canadian26 0.2% Canadian18 0.2% Belgian16 0.1% Ukrainian14 0.1% Northern European12 0.1% Russian12 0.1% Scotch-Irish11 0.10% Romanian11 0.10% Serbian11 0.10% Ethiopian8 0.07% British7 0.06% Lithuanian6 0.05% Austrian6 0.05% Swiss6 0.05% Welsh4 0.04% Lebanese
Geographical mobility in Caledonia Same house 1 year ago 17,616 88.2% White (Caucasian)507 71.4% Black or African American70 100.0% American Indian / Alaska Native433 89.2% Asian134 100.0% Native Hawaiian / Pacific Islander224 82.7% Other race2,793 90.7% Two or more races17,008 87.6% White alone, not Hispanic / Latino2,615 92.0% Hispanic or LatinoMoved within same county 1,419 7.1% White / Caucasian184 26.0% Black or African American43 8.8% Asian28 10.4% Other race192 6.2% Two or more races1,548 8.0% White alone, not Hispanic / Latino109 3.8% Hispanic or LatinoMoved within same state 583 2.9% White / Caucasian3 0.4% Black or African American11 3.9% Other race19 0.6% Two or more races475 2.4% White alone, not Hispanic / Latino121 4.3% Hispanic or LatinoMoved from different state 221 1.1% White / Caucasian10 1.4% Black or African American138 4.5% Two or more races247 1.3% White alone, not Hispanic / Latino21 0.8% Hispanic or LatinoMoved from abroad 74 0.4% White79 0.4% White alone, not Hispanic / Latino
Children Nativity (place of birth) in Caledonia
Children under 6 years - Living with two parents Both parents native 1,365 100.0% NativeBoth parents foreign-born 45 52.5% Native40 47.5% Foreign-bornOne native, one foreign-born parent 59 100.0% NativeChildren under 6 years - Living with one parent Native parent 296 100.0% NativeForeign-born parent 95 100.0% NativeChildren 6 to 17 years - Living with two parents Both parents native 2,110 100.0% NativeBoth parents foreign-born 39 24.8% Native118 75.2% Foreign-bornOne native, one foreign-born parent 279 100.0% NativeChildren 6 to 17 years - Living with one parent Native parent 727 100.0% NativeForeign-born parent 49 48.4% Native52 51.6% Foreign-born
Grandparents responsible for own grandchildren in Caledonia
Grandparents (30 to 59 years) White / Caucasian 32 26.5% Responsible for grandchildren90 73.5% Not responsible for grandchildrenBlack or African American 9 100.0% Responsible for grandchildrenTwo or more races 26 100.0% Not responsible for grandchildrenWhite alone, not Hispanic / Latino 16 16.0% Responsible for grandchildren82 84.0% Not responsible for grandchildrenHispanic or Latino 13 30.2% Responsible for grandchildren30 69.8% Not responsible for grandchildrenGrandparents (60 years and over) White / Caucasian 63 56.0% Responsible for grandchildren49 44.0% Not responsible for grandchildrenBlack or African American 29 100.0% Not responsible for grandchildrenWhite alone, not Hispanic / Latino 63 56.0% Responsible for grandchildren49 44.0% Not responsible for grandchildren