Races in Calhoun-Riceville, Tennessee (TN) Detailed Stats
Ancestries, Foreign-born residents, place of birth
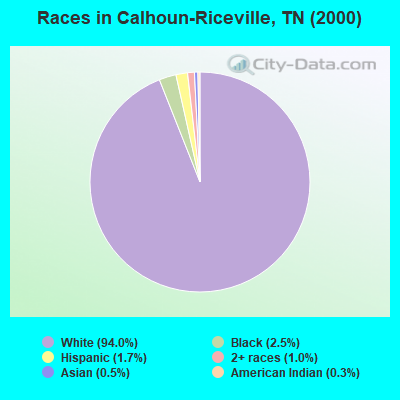
Race distribution in Calhoun-Riceville

- 6,08794.0%White alone
- 1642.5%Black alone
- 1081.7%Hispanic
- 631.0%Two or more races
- 340.5%Asian alone
- 190.3%American Indian alone
- 10.02%Other race alone
2000
2022
-
- 4,505,93079.2%White alone
- 928,20416.3%Black alone
- 123,8382.2%Hispanic
- 54,8241.0%Two or more races
- 56,0771.0%Asian alone
- 13,8200.2%American Indian alone
- 4,7800.08%Other race alone
- 1,8100.03%Native Hawaiian and Other
Pacific Islander alone

-
- 5,070,02671.9%White alone
- 1,089,73815.5%Black alone
- 442,6296.3%Hispanic
- 279,3814.0%Two or more races
- 131,8171.9%Asian alone
- 26,9720.4%Other race alone
- 6,3870.09%American Indian alone
- 4,3890.06%Native Hawaiian and Other
Pacific Islander alone

Income and house value in Calhoun-Riceville
- Median household income in 2022
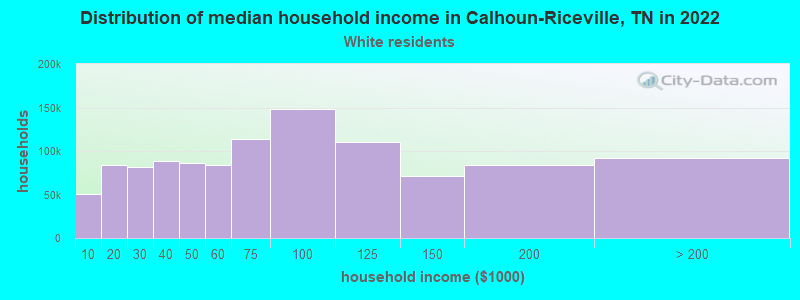
- $68,718White non-Hispanic householders
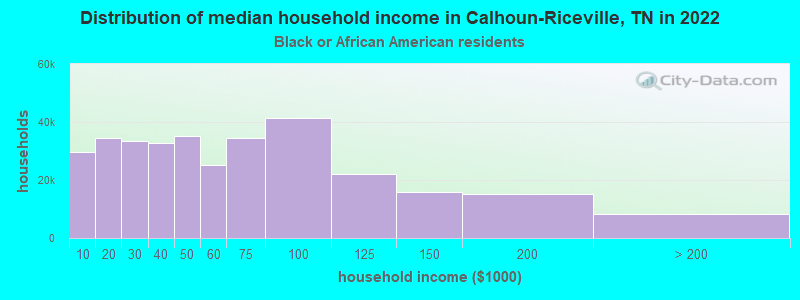
- $86,131Black householders
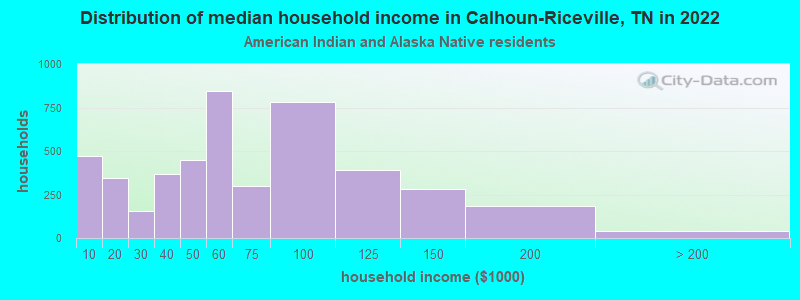
- $52,058American Indian and Alaska Native householders
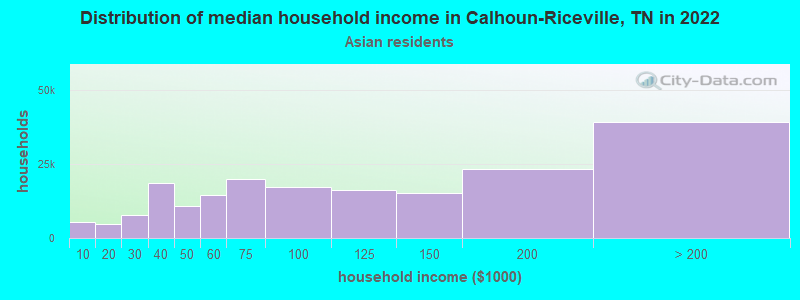
- over $200,000Asian householders
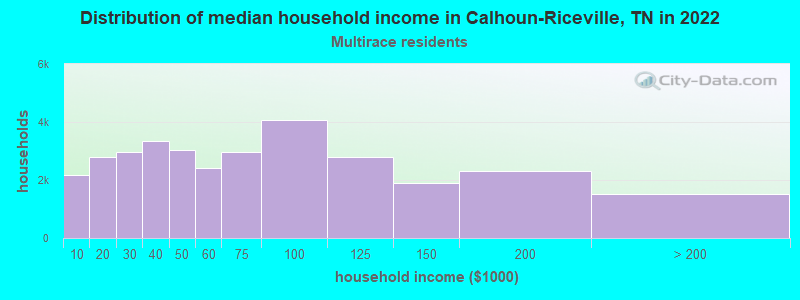
- $25,389Two or more races householders
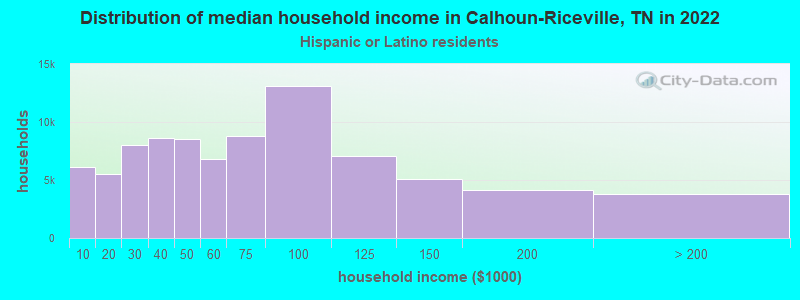
- $108,216Hispanic or Latino race householders
- Median 2022 house value
- $248,090White Non-Hispanic householders
- $569,854Black or African American householders
- $193,114American Indian or Alaska Native householders
- over $1,000,000Asian householders
- $207,346Two or more races householders
Household income for White non-Hispanic householders
Household income for Black householders
Household income for American Indian and Alaska Native householders
Household income for Asian householders
Household income for Two or more races householders
Household income for Hispanic or Latino race householders
Zip code: 37370