Races in Campbellsville, Kentucky (KY) Detailed Stats
Data:
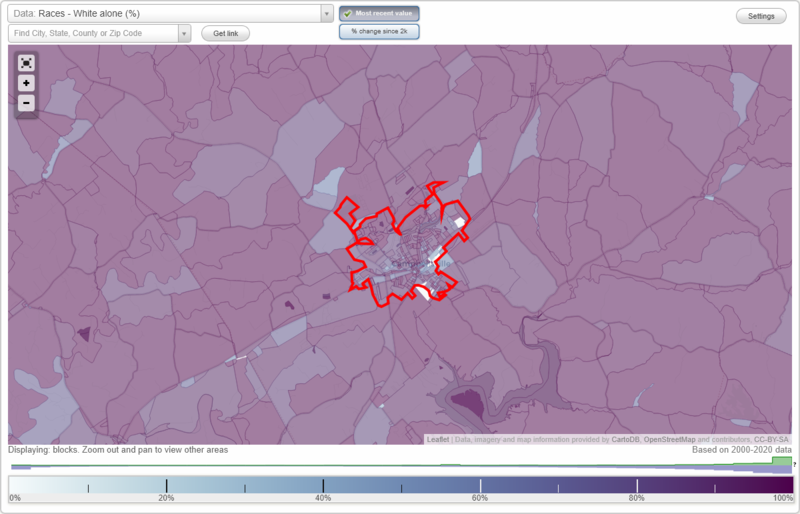
Races - White alone (%)
Races - White alone (% change since 2000)
Races - Black alone (%)
Races - Black alone (% change since 2000)
Races - American Indian alone (%)
Races - American Indian alone (% change since 2000)
Races - Asian alone (%)
Races - Asian alone (% change since 2000)
Races - Hispanic (%)
Races - Hispanic (% change since 2000)
Races - Native Hawaiian and Other Pacific Islander alone (%)
Races - Native Hawaiian and Other Pacific Islander alone (% change since 2000)
Races - Two or more races(%)
Races - Two or more races(% change since 2000)
Races - Other race alone (%)
Races - Other race alone (% change since 2000)
Racial diversity
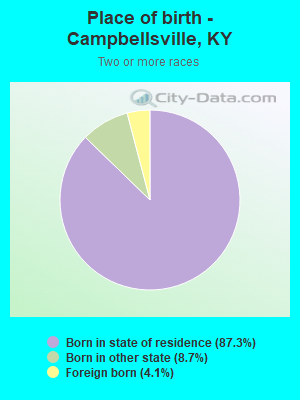
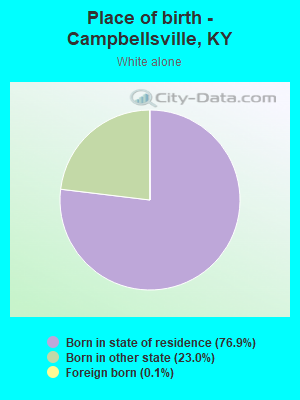
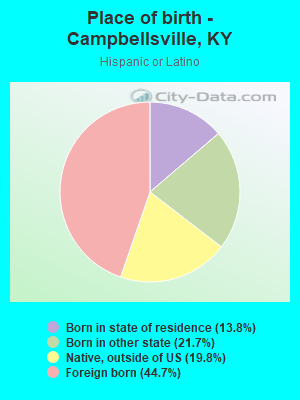
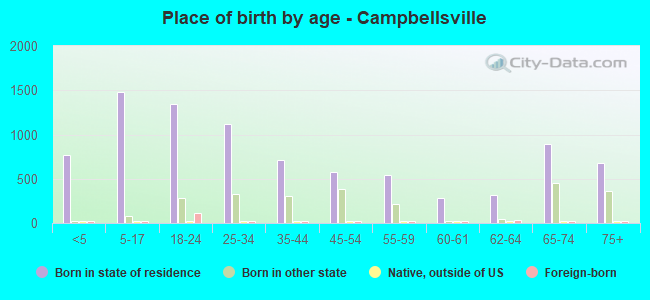
Place of birth - Born in state of residence (%)
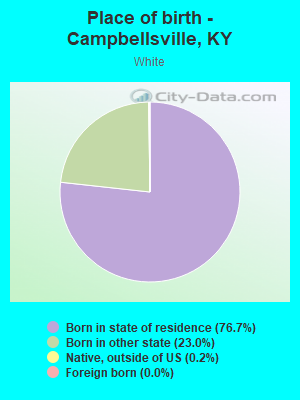
Place of birth - Born in state of residence (%) - White
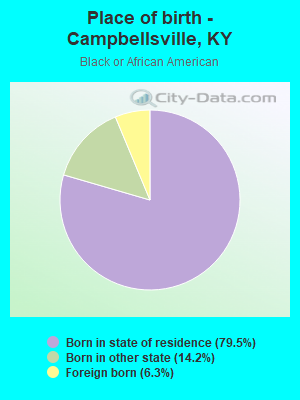
Place of birth - Born in state of residence (%) - Black or African American
Place of birth - Born in state of residence (%) - Asian
Place of birth - Born in state of residence (%) - Hispanic or Latino
Place of birth - Born in state of residence (%) - American Indian and Alaska Native
Place of birth - Born in state of residence (%) - Multirace
Place of birth - Born in state of residence (%) - Other Race
Place of birth - Born in other state (%)
Place of birth - Born in other state (%) - White
Place of birth - Born in other state (%) - Black or African American
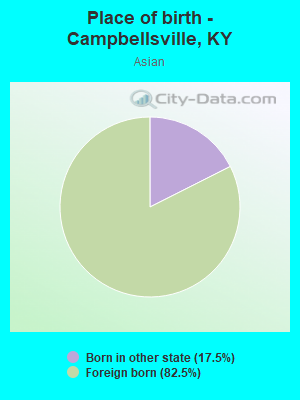
Place of birth - Born in other state (%) - Asian
Place of birth - Born in other state (%) - Hispanic or Latino
Place of birth - Born in other state (%) - American Indian and Alaska Native
Place of birth - Born in other state (%) - Multirace
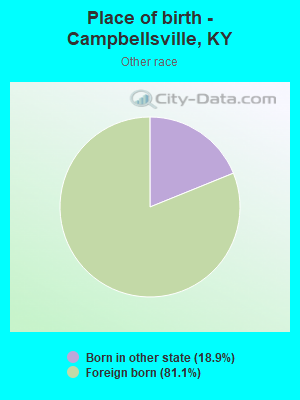
Place of birth - Born in other state (%) - Other Race
Place of birth - Native, outside of US (%)
Place of birth - Native, outside of US (%) - White
Place of birth - Native, outside of US (%) - Black or African American
Place of birth - Native, outside of US (%) - Asian
Place of birth - Native, outside of US (%) - Hispanic or Latino
Place of birth - Native, outside of US (%) - American Indian and Alaska Native
Place of birth - Native, outside of US (%) - Multirace
Place of birth - Native, outside of US (%) - Other Race
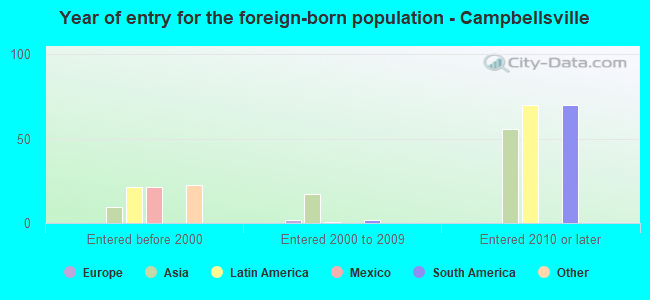
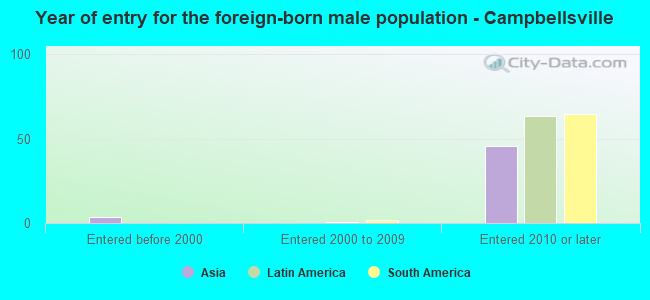
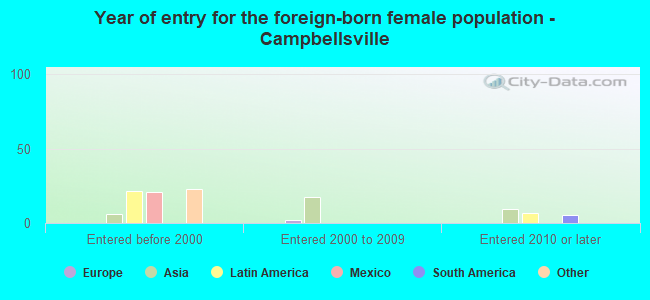
Place of birth - Foreign born (%)
Place of birth - Foreign born (%) - White
Place of birth - Foreign born (%) - Black or African American
Place of birth - Foreign born (%) - Asian
Place of birth - Foreign born (%) - Hispanic or Latino
Place of birth - Foreign born (%) - American Indian and Alaska Native
Place of birth - Foreign born (%) - Multirace
Place of birth - Foreign born (%) - Other Race
Residents speaking English at home (%)
Residents speaking English at home - Born in the United States (%)
Residents speaking English at home - Native, born elsewhere (%)
Residents speaking English at home - Foreign born (%)
Residents speaking Spanish at home (%)
Residents speaking Spanish at home - Born in the United States (%)
Residents speaking Spanish at home - Native, born elsewhere (%)
Residents speaking Spanish at home - Foreign born (%)
Residents speaking other language at home (%)
Residents speaking other language at home - Born in the United States (%)
Residents speaking other language at home - Native, born elsewhere (%)
Residents speaking other language at home - Foreign born (%)
Marital status - Never married (%)
Marital status - Now married (%)
Marital status - Separated (%)
Marital status - Widowed (%)
Marital status - Divorced (%)
Ancestries Reported - Arab (%)
Ancestries Reported - Czech (%)
Ancestries Reported - Danish (%)
Ancestries Reported - Dutch (%)
Ancestries Reported - English (%)
Ancestries Reported - French (%)
Ancestries Reported - French Canadian (%)
Ancestries Reported - German (%)
Ancestries Reported - Greek (%)
Ancestries Reported - Hungarian (%)
Ancestries Reported - Irish (%)
Ancestries Reported - Italian (%)
Ancestries Reported - Lithuanian (%)
Ancestries Reported - Norwegian (%)
Ancestries Reported - Polish (%)
Ancestries Reported - Portuguese (%)
Ancestries Reported - Russian (%)
Ancestries Reported - Scotch-Irish (%)
Ancestries Reported - Scottish (%)
Ancestries Reported - Slovak (%)
Ancestries Reported - Subsaharan African (%)
Ancestries Reported - Swedish (%)
Ancestries Reported - Swiss (%)
Ancestries Reported - Ukrainian (%)
Ancestries Reported - United States (%)
Ancestries Reported - Welsh (%)
Ancestries Reported - West Indian (%)
Ancestries Reported - Other (%)
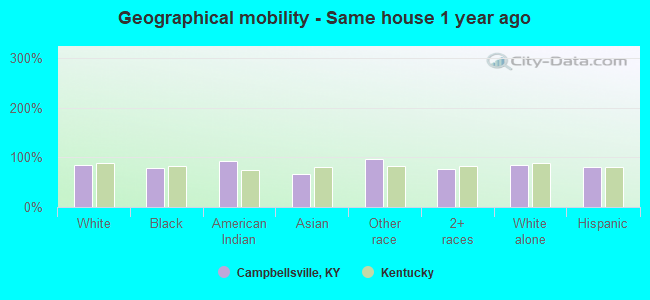
Geographical mobility - Same house 1 year ago (%)
Geographical mobility - Same house 1 year ago (%) - White
Geographical mobility - Same house 1 year ago (%) - Black or African American
Geographical mobility - Same house 1 year ago (%) - Asian
Geographical mobility - Same house 1 year ago (%) - Hispanic or Latino
Geographical mobility - Same house 1 year ago (%) - American Indian and Alaska Native
Geographical mobility - Same house 1 year ago (%) - Multirace
Geographical mobility - Same house 1 year ago (%) - Other Race
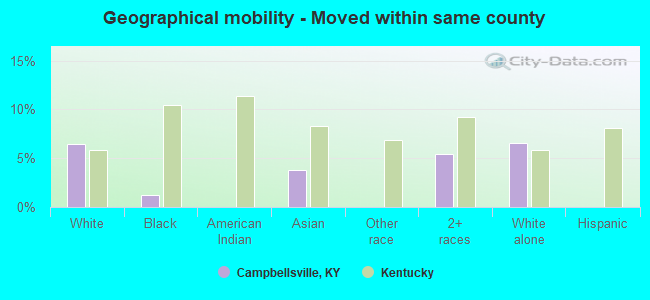
Geographical mobility - Moved within same county (%)
Geographical mobility - Moved within same county (%) - White
Geographical mobility - Moved within same county (%) - Black or African American
Geographical mobility - Moved within same county (%) - Asian
Geographical mobility - Moved within same county (%) - Hispanic or Latino
Geographical mobility - Moved within same county (%) - American Indian and Alaska Native
Geographical mobility - Moved within same county (%) - Multirace
Geographical mobility - Moved within same county (%) - Other Race
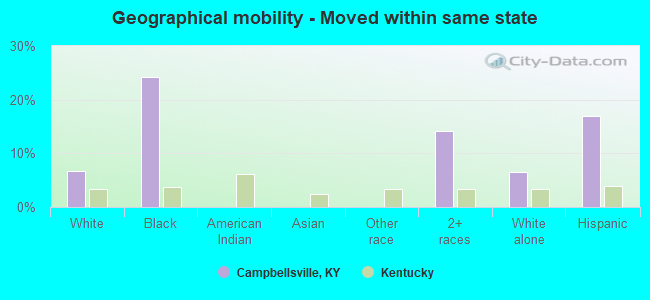
Geographical mobility - Moved from different county within same state (%)
Geographical mobility - Moved from different county within same state (%) - White
Geographical mobility - Moved from different county within same state (%) - Black or African American
Geographical mobility - Moved from different county within same state (%) - Asian
Geographical mobility - Moved from different county within same state (%) - Hispanic or Latino
Geographical mobility - Moved from different county within same state (%) - American Indian and Alaska Native
Geographical mobility - Moved from different county within same state (%) - Multirace
Geographical mobility - Moved from different county within same state (%) - Other Race
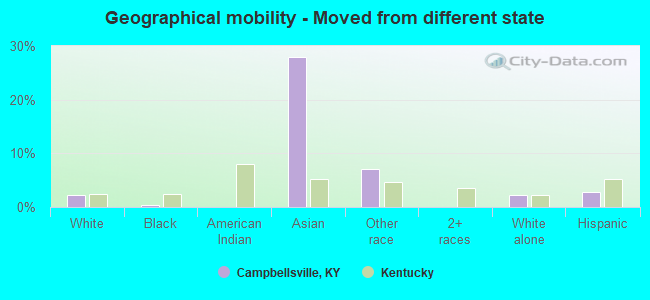
Geographical mobility - Moved from different state (%)
Geographical mobility - Moved from different state (%) - White
Geographical mobility - Moved from different state (%) - Black or African American
Geographical mobility - Moved from different state (%) - Asian
Geographical mobility - Moved from different state (%) - Hispanic or Latino
Geographical mobility - Moved from different state (%) - American Indian and Alaska Native
Geographical mobility - Moved from different state (%) - Multirace
Geographical mobility - Moved from different state (%) - Other Race
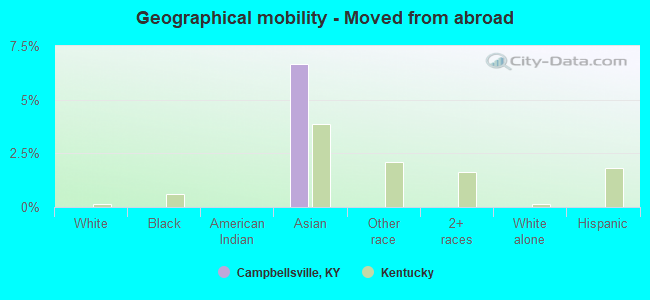
Geographical mobility - Moved from abroad (%)
Geographical mobility - Moved from abroad (%) - White
Geographical mobility - Moved from abroad (%) - Black or African American
Geographical mobility - Moved from abroad (%) - Asian
Geographical mobility - Moved from abroad (%) - Hispanic or Latino
Geographical mobility - Moved from abroad (%) - American Indian and Alaska Native
Geographical mobility - Moved from abroad (%) - Multirace
Geographical mobility - Moved from abroad (%) - Other Race
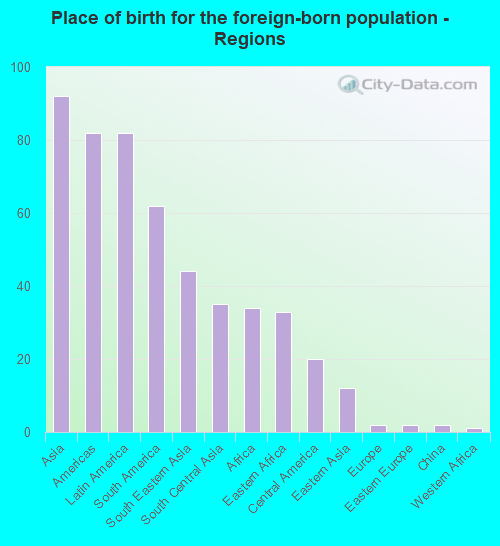
Place of birth for the foreign-born population - Ireland (%)
Place of birth for the foreign-born population - Denmark (%)
Place of birth for the foreign-born population - Norway (%)
Place of birth for the foreign-born population - Sweden (%)
Place of birth for the foreign-born population - United Kingdom (%)
Place of birth for the foreign-born population - England (%)
Place of birth for the foreign-born population - Scotland (%)
Place of birth for the foreign-born population - Other Northern Europe (%)
Place of birth for the foreign-born population - Austria (%)
Place of birth for the foreign-born population - Belgium (%)
Place of birth for the foreign-born population - France (%)
Place of birth for the foreign-born population - Germany (%)
Place of birth for the foreign-born population - Netherlands (%)
Place of birth for the foreign-born population - Switzerland (%)
Place of birth for the foreign-born population - Other Western Europe (%)
Place of birth for the foreign-born population - Greece (%)
Place of birth for the foreign-born population - Italy (%)
Place of birth for the foreign-born population - Portugal (%)
Place of birth for the foreign-born population - Spain (%)
Place of birth for the foreign-born population - Other Southern Europe (%)
Place of birth for the foreign-born population - Albania (%)
Place of birth for the foreign-born population - Belarus (%)
Place of birth for the foreign-born population - Bosnia and Herzegovina (%)
Place of birth for the foreign-born population - Bulgaria (%)
Place of birth for the foreign-born population - Croatia (%)
Place of birth for the foreign-born population - Czechoslovakia (%)
Place of birth for the foreign-born population - Hungary (%)
Place of birth for the foreign-born population - Latvia (%)
Place of birth for the foreign-born population - Lithuania (%)
Place of birth for the foreign-born population - North Macedonia (Macedonia) (%)
Place of birth for the foreign-born population - Moldova (%)
Place of birth for the foreign-born population - Poland (%)
Place of birth for the foreign-born population - Romania (%)
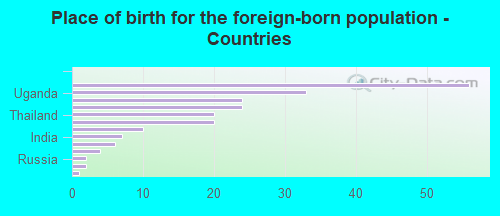
Place of birth for the foreign-born population - Russia (%)
Place of birth for the foreign-born population - Serbia (%)
Place of birth for the foreign-born population - Ukraine (%)
Place of birth for the foreign-born population - Other Eastern Europe (%)
Place of birth for the foreign-born population - China (%)
Place of birth for the foreign-born population - Hong Kong (%)
Place of birth for the foreign-born population - Taiwan (%)
Place of birth for the foreign-born population - Japan (%)
Place of birth for the foreign-born population - Korea (%)
Place of birth for the foreign-born population - Other Eastern Asia (%)
Place of birth for the foreign-born population - Afghanistan (%)
Place of birth for the foreign-born population - Bangladesh (%)
Place of birth for the foreign-born population - India (%)
Place of birth for the foreign-born population - Iran (%)
Place of birth for the foreign-born population - Kazakhstan (%)
Place of birth for the foreign-born population - Nepal (%)
Place of birth for the foreign-born population - Pakistan (%)
Place of birth for the foreign-born population - Sri Lanka (%)
Place of birth for the foreign-born population - Uzbekistan (%)
Place of birth for the foreign-born population - Other South Central Asia (%)
Place of birth for the foreign-born population - Burma (%)
Place of birth for the foreign-born population - Cambodia (%)
Place of birth for the foreign-born population - Indonesia (%)
Place of birth for the foreign-born population - Laos (%)
Place of birth for the foreign-born population - Malaysia (%)
Place of birth for the foreign-born population - Philippines (%)
Place of birth for the foreign-born population - Singapore (%)
Place of birth for the foreign-born population - Thailand (%)
Place of birth for the foreign-born population - Vietnam (%)
Place of birth for the foreign-born population - Other South Eastern Asia (%)
Place of birth for the foreign-born population - Armenia (%)
Place of birth for the foreign-born population - Iraq (%)
Place of birth for the foreign-born population - Israel (%)
Place of birth for the foreign-born population - Jordan (%)
Place of birth for the foreign-born population - Kuwait (%)
Place of birth for the foreign-born population - Lebanon (%)
Place of birth for the foreign-born population - Saudi Arabia (%)
Place of birth for the foreign-born population - Syria (%)
Place of birth for the foreign-born population - Turkey (%)
Place of birth for the foreign-born population - Yemen (%)
Place of birth for the foreign-born population - Other Western Asia (%)
Place of birth for the foreign-born population - Eritrea (%)
Place of birth for the foreign-born population - Ethiopia (%)
Place of birth for the foreign-born population - Kenya (%)
Place of birth for the foreign-born population - Somalia (%)
Place of birth for the foreign-born population - Uganda (%)
Place of birth for the foreign-born population - Zimbabwe (%)
Place of birth for the foreign-born population - Other Eastern Africa (%)
Place of birth for the foreign-born population - Cameroon (%)
Place of birth for the foreign-born population - Congo (%)
Place of birth for the foreign-born population - Democratic Republic of Congo (Zaire) (%)
Place of birth for the foreign-born population - Other Middle Africa (%)
Place of birth for the foreign-born population - Egypt (%)
Place of birth for the foreign-born population - Morocco (%)
Place of birth for the foreign-born population - Sudan (%)
Place of birth for the foreign-born population - Other Northern Africa (%)
Place of birth for the foreign-born population - South Africa (%)
Place of birth for the foreign-born population - Other Southern Africa (%)
Place of birth for the foreign-born population - Cabo Verde (%)
Place of birth for the foreign-born population - Ghana (%)
Place of birth for the foreign-born population - Liberia (%)
Place of birth for the foreign-born population - Nigeria (%)
Place of birth for the foreign-born population - Senegal (%)
Place of birth for the foreign-born population - Sierra Leone (%)
Place of birth for the foreign-born population - Other Western Africa (%)
Place of birth for the foreign-born population - Australia (%)
Place of birth for the foreign-born population - New Zealand (%)
Place of birth for the foreign-born population - Fiji (%)
Place of birth for the foreign-born population - Micronesia (%)
Place of birth for the foreign-born population - Bahamas (%)
Place of birth for the foreign-born population - Barbados (%)
Place of birth for the foreign-born population - Cuba (%)
Place of birth for the foreign-born population - Dominica (%)
Place of birth for the foreign-born population - Dominican Republic (%)
Place of birth for the foreign-born population - Grenada (%)
Place of birth for the foreign-born population - Haiti (%)
Place of birth for the foreign-born population - Jamaica (%)
Place of birth for the foreign-born population - St. Vincent and the Grenadines (%)
Place of birth for the foreign-born population - Trinidad and Tobago (%)
Place of birth for the foreign-born population - West Indies (%)
Place of birth for the foreign-born population - Other Caribbean (%)
Place of birth for the foreign-born population - Belize (%)
Place of birth for the foreign-born population - Costa Rica (%)
Place of birth for the foreign-born population - El Salvador (%)
Place of birth for the foreign-born population - Guatemala (%)
Place of birth for the foreign-born population - Honduras (%)
Place of birth for the foreign-born population - Mexico (%)
Place of birth for the foreign-born population - Nicaragua (%)
Place of birth for the foreign-born population - Panama (%)
Place of birth for the foreign-born population - Other Central America (%)
Place of birth for the foreign-born population - Argentina (%)
Place of birth for the foreign-born population - Bolivia (%)
Place of birth for the foreign-born population - Brazil (%)
Place of birth for the foreign-born population - Chile (%)
Place of birth for the foreign-born population - Colombia (%)
Place of birth for the foreign-born population - Ecuador (%)
Place of birth for the foreign-born population - Guyana (%)
Place of birth for the foreign-born population - Peru (%)
Place of birth for the foreign-born population - Uruguay (%)
Place of birth for the foreign-born population - Venezuela (%)
Place of birth for the foreign-born population - Other South America (%)
Place of birth for the foreign-born population - Canada (%)
Place of birth for the foreign-born population - Other Northern America (%)
Place of birth for the foreign-born population - Other (%)
Latest news about races in Campbellsville, KY collected exclusively by city-data.com from local newspapers, TV, and radio stations
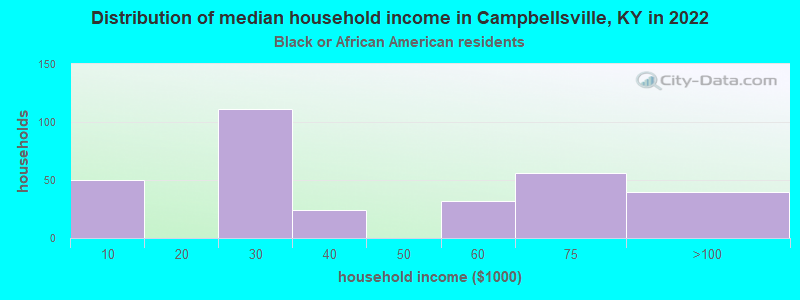
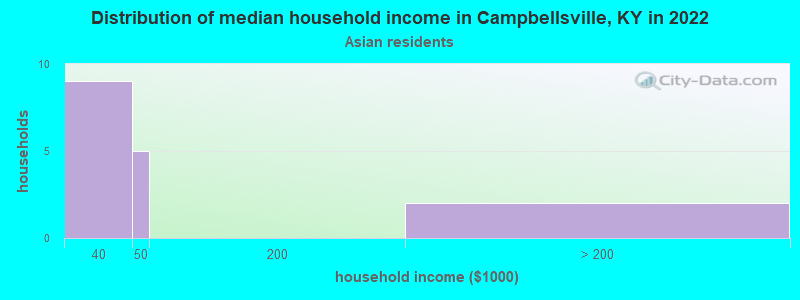
According to 2022 data, the most numerous races in Campbellsville, KY are White alone (9,493 residents), Black alone (1,025 residents), and Hispanic (127 residents). 97.4% of Campbellsville residents speak English at home. 1.9% of Campbellsville, KY residents are foreign-born , which is 116.2% less than the foreign-born rate of 4.0% across the entire state of Kentucky.
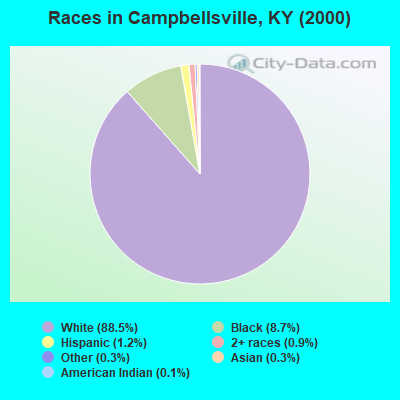
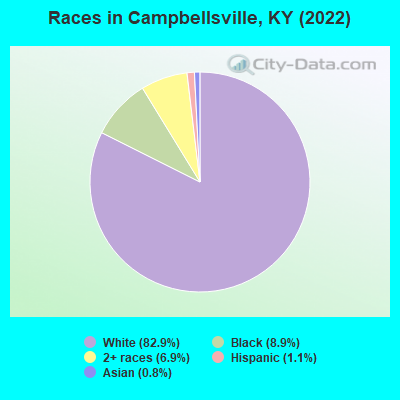
Race distribution in Campbellsville
2000 2022
3,608,013 89.3% White alone 293,639 7.3% Black alone 59,939 1.5% Hispanic 37,750 0.9% Two or more races 29,368 0.7% Asian alone 7,939 0.2% American Indian alone 3,846 0.10% Other race alone 1,275 0.03% Native Hawaiian and Other
3,710,998 82.2% White alone 343,194 7.6% Black alone 187,483 4.2% Hispanic 187,394 4.2% Two or more races 62,240 1.4% Asian alone 13,529 0.3% Other race alone 4,302 0.10% American Indian alone 3,170 0.07% Native Hawaiian and Other
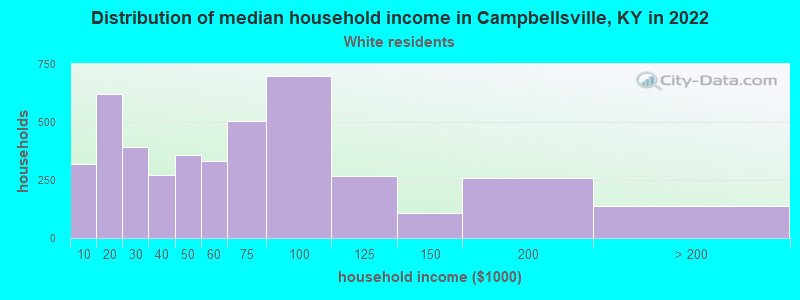
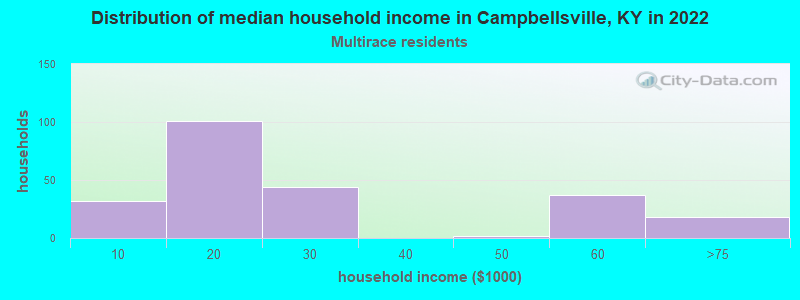
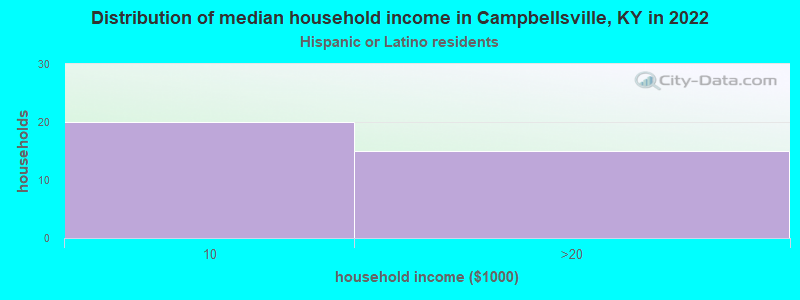
Income and house value in Campbellsville Median household income in 2022 $53,471 White non-Hispanic householders$33,017 Asian householdersMedian 2022 house value $183,578 White Non-Hispanic householders$116,701 Black or African American householders$119,898 Two or more races householders$146,543 Hispanic or Latino householders
Median age by race in Campbellsville
38.5 Median age for White residents36.7 40.4 28.6 Median age for Black or African American residents28.4 29.9 -521,556,256.1 Median age for American Indian / Alaska Native residents-607,449,856.1 -630,065,358.8 24.1 Median age for Asian residents22.1 46.1 -755,186,721.2 Median age for Native Hawaiian / Pacific Islander residents-724,043,715.1 -853,801,168.7 24.3 Median age for Other race residents23.5 -736,990,154.0 19.0 Median age for Two or more races residents18.2 20.7 38.3 Median age for White alone residents37.2 40.0 38.7 Median age for Hispanic or Latino residents23.6 76.5
Owner/renter occupied households by race in Campbellsville
House owners and renters - White residents 2,127 50.2% Owner occupied2,109 49.8% Renter occupiedHouse owners and renters - Black or African American residents 102 32.7% Owner occupied210 67.3% Renter occupiedHouse owners and renters - Asian residents 18 100.0% Renter occupiedHouse owners and renters - Two or more races residents 88 38.1% Owner occupied144 61.9% Renter occupiedHouse owners and renters - White alone residents 2,133 50.0% Owner occupied2,136 50.0% Renter occupiedHouse owners and renters - Hispanic or Latino residents 24 56.6% Owner occupied18 43.4% Renter occupied
Language usage in Campbellsville
English speakers - Total 97.4% of residents of Campbellsville speak English at home.
0.8% of residents speak Spanish at home 69 82.1% Speak English very well15 17.9% Speak English less than very well1.8% of residents speak other language at home 169 87.1% Speak English very well25 12.9% Speak English less than very well
English speakers - Born in the United States 98.2% of residents of Campbellsville speak English at home.
1.0% of residents speak Spanish at home 25 100.0% Speak English very well0.6% of residents speak other language at home 7 43.8% Speak English very well9 56.2% Speak English less than very well
All residents speak only English at home
English speakers - Foreign-born 26.0% of residents of Campbellsville speak English at home.
28.4% of residents speak Spanish at home 43 74.1% Speak English very well15 25.9% Speak English less than very well43.6% of residents speak other language at home 84 94.4% Speak English very well5 5.6% Speak English less than very well
White (Caucasian) - Speak only English Native:
98.9% (8,744)Foreign-born:
100.0% (4)
Black or African American - Speak another language Native:
0.6% (6)Foreign-born:
97.0% (61)
Asian - Speak only English Native:
97.9% (15)Foreign-born:
28.7% (23)
Other race - Speak another language Native:
88.5% (9)Foreign-born:
98.6% (45)
Two or more races - Speak only English Native:
98.1% (762)Foreign-born:
96.9% (32)
Two or more races - Speak another language Native:
1.0% (8)Foreign-born:
12.9% (4)
White alone - Speak only English Native:
99.0% (8,742)Foreign-born:
100.0% (5)
Hispanic or Latino - Speak only English Native:
63.9% (44)Foreign-born:
32.6% (19)
Hispanic or Latino - Speak another language Native:
36.4% (25)Foreign-born:
66.3% (39)
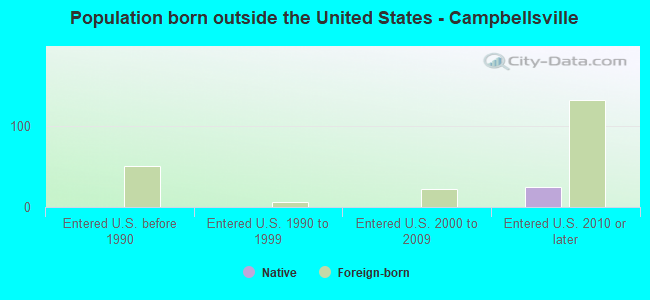
Foreign-born residents in Campbellsville 212 residents are foreign born
This city:
1.9%Kentucky:
4.1%
Marital status for residents in Campbellsville Marital status - White (Caucasian) population 15 years and over
Males 41.2% Never married44.3% Now married1.4% Separated7.3% Widowed5.9% DivorcedFemales 24.6% Never married35.7% Now married1.7% Separated14.4% Widowed23.7% DivorcedWomen who gave birth in the past 12 months Now married:
100.0% (131)Unmarried:
0.0% (0)
Women who did not give birth in the past 12 months Now married:
36.0% (713)Unmarried:
64.0% (1,269)
Marital status - Black or African American population 15 years and over
Males 47.6% Never married27.4% Now married0.0% Separated0.0% Widowed24.9% DivorcedFemales 45.0% Never married31.5% Now married3.1% Separated2.2% Widowed18.2% DivorcedWomen who did not give birth in the past 12 months Now married:
32.8% (77)Unmarried:
67.2% (158)
Marital status - Asian population 15 years and over
Males 75.0% Never married25.0% Now married0.0% Separated0.0% Widowed0.0% DivorcedFemales 33.3% Never married66.7% Now married0.0% Separated0.0% Widowed0.0% DivorcedWomen who did not give birth in the past 12 months Now married:
66.7% (23)Unmarried:
33.3% (12)
Marital status - Other race population 15 years and over
Males 61.0% Never married19.5% Now married0.0% Separated0.0% Widowed19.5% DivorcedFemales 100.0% Never married0.0% Now married0.0% Separated0.0% Widowed0.0% DivorcedWomen who did not give birth in the past 12 months Now married:
0.0% (0)Unmarried:
100.0% (4)
Marital status - Two or more races population 15 years and over
Males 85.2% Never married0.0% Now married0.0% Separated0.0% Widowed14.8% DivorcedFemales 62.1% Never married0.0% Now married0.0% Separated20.5% Widowed17.4% DivorcedWomen who did not give birth in the past 12 months Now married:
0.0% (0)Unmarried:
100.0% (171)
Marital status - White alone, not Hispanic / Latino population 15 years and over
Males 40.8% Never married44.6% Now married1.4% Separated7.3% Widowed5.9% DivorcedFemales 24.7% Never married35.8% Now married1.7% Separated14.1% Widowed23.8% DivorcedWomen who gave birth in the past 12 months Now married:
100.0% (132)Unmarried:
0.0% (0)
Women who did not give birth in the past 12 months Now married:
36.0% (720)Unmarried:
64.0% (1,281)
Marital status - Hispanic or Latino population 15 years and over
Males 56.8% Never married9.9% Now married0.0% Separated0.0% Widowed33.3% DivorcedFemales 61.9% Never married0.0% Now married0.0% Separated38.1% Widowed0.0% DivorcedWomen who did not give birth in the past 12 months Now married:
0.0% (0)Unmarried:
100.0% (7)
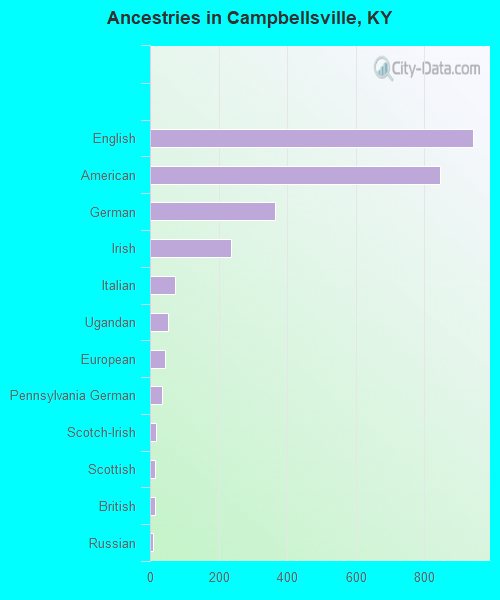
Ancestries in Campbellsville
941 24.1% English845 21.6% American363 9.3% German235 6.0% Irish74 1.9% Italian53 1.4% Ugandan44 1.1% European36 0.9% Pennsylvania German18 0.5% Scotch-Irish16 0.4% Scottish14 0.4% British9 0.2% Russian8 0.2% Haitian7 0.2% Canadian3 0.08% African1 0.03% Hungarian1 0.03% Iranian
Children Nativity (place of birth) in Campbellsville
Children under 6 years - Living with two parents Both parents native 674 100.0% NativeChildren under 6 years - Living with one parent Native parent 188 100.0% Native
Children 6 to 17 years - Living with two parents Both parents native 408 100.0% NativeBoth parents foreign-born 179 100.0% NativeChildren 6 to 17 years - Living with one parent Native parent 833 100.0% Native
Grandparents responsible for own grandchildren in Campbellsville
Grandparents (30 to 59 years) White / Caucasian 94 78.0% Responsible for grandchildren27 22.0% Not responsible for grandchildrenBlack or African American 40 100.0% Responsible for grandchildrenWhite alone, not Hispanic / Latino 94 77.8% Responsible for grandchildren27 22.2% Not responsible for grandchildren
Grandparents (60 years and over) White / Caucasian 74 100.0% Responsible for grandchildrenBlack or African American 6 100.0% Not responsible for grandchildrenWhite alone, not Hispanic / Latino 74 100.0% Responsible for grandchildren