Races in Carmel, Indiana (IN) Detailed Stats
Data:
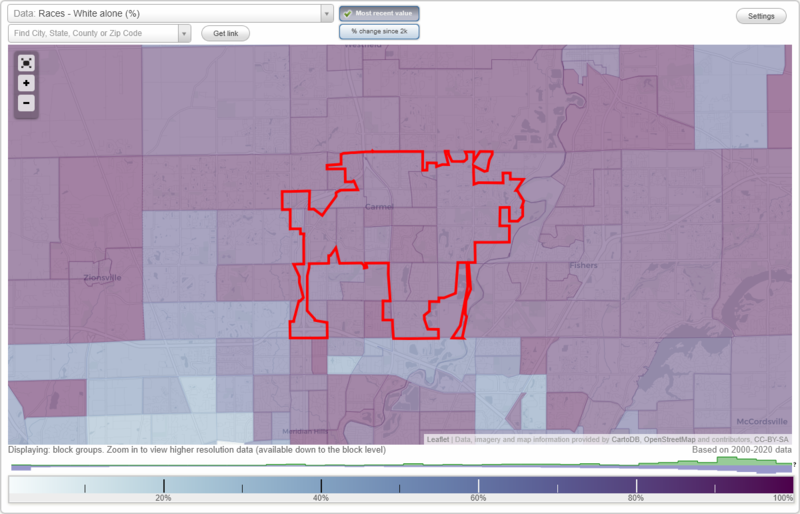
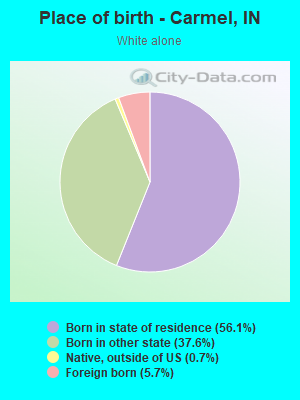
Races - White alone (%)
Races - White alone (% change since 2000)
Races - Black alone (%)
Races - Black alone (% change since 2000)
Races - American Indian alone (%)
Races - American Indian alone (% change since 2000)
Races - Asian alone (%)
Races - Asian alone (% change since 2000)
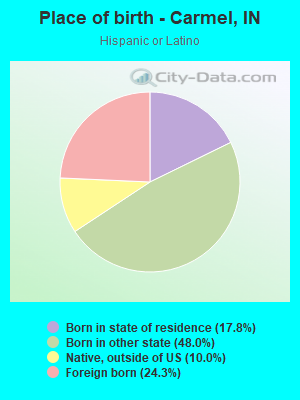
Races - Hispanic (%)
Races - Hispanic (% change since 2000)
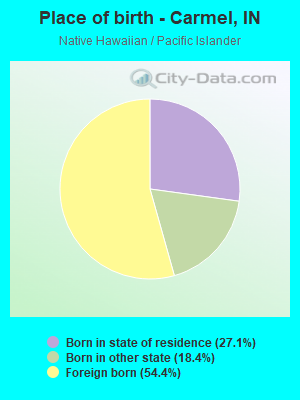
Races - Native Hawaiian and Other Pacific Islander alone (%)
Races - Native Hawaiian and Other Pacific Islander alone (% change since 2000)
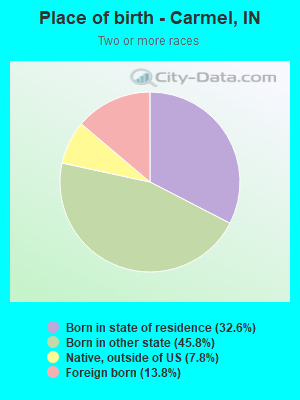
Races - Two or more races(%)
Races - Two or more races(% change since 2000)
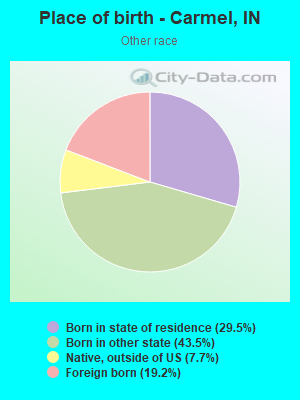
Races - Other race alone (%)
Races - Other race alone (% change since 2000)
Racial diversity
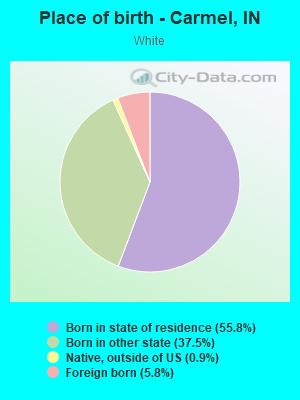
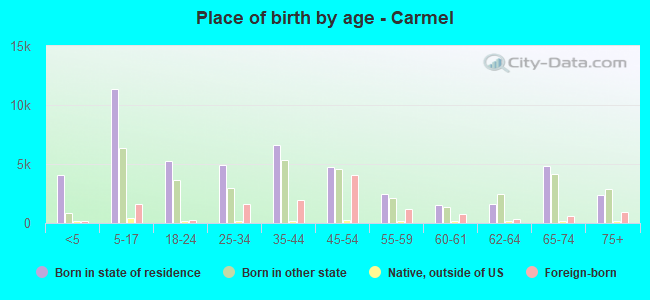
Place of birth - Born in state of residence (%)
Place of birth - Born in state of residence (%) - White
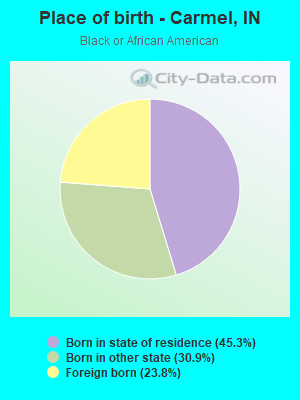
Place of birth - Born in state of residence (%) - Black or African American
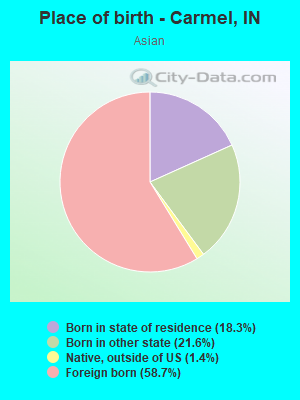
Place of birth - Born in state of residence (%) - Asian
Place of birth - Born in state of residence (%) - Hispanic or Latino
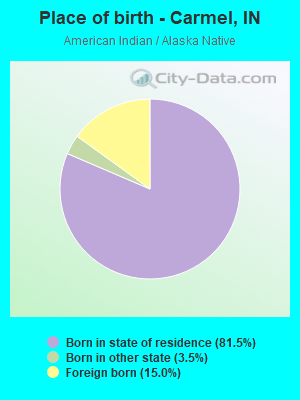
Place of birth - Born in state of residence (%) - American Indian and Alaska Native
Place of birth - Born in state of residence (%) - Multirace
Place of birth - Born in state of residence (%) - Other Race
Place of birth - Born in other state (%)
Place of birth - Born in other state (%) - White
Place of birth - Born in other state (%) - Black or African American
Place of birth - Born in other state (%) - Asian
Place of birth - Born in other state (%) - Hispanic or Latino
Place of birth - Born in other state (%) - American Indian and Alaska Native
Place of birth - Born in other state (%) - Multirace
Place of birth - Born in other state (%) - Other Race
Place of birth - Native, outside of US (%)
Place of birth - Native, outside of US (%) - White
Place of birth - Native, outside of US (%) - Black or African American
Place of birth - Native, outside of US (%) - Asian
Place of birth - Native, outside of US (%) - Hispanic or Latino
Place of birth - Native, outside of US (%) - American Indian and Alaska Native
Place of birth - Native, outside of US (%) - Multirace
Place of birth - Native, outside of US (%) - Other Race
Place of birth - Foreign born (%)
Place of birth - Foreign born (%) - White
Place of birth - Foreign born (%) - Black or African American
Place of birth - Foreign born (%) - Asian
Place of birth - Foreign born (%) - Hispanic or Latino
Place of birth - Foreign born (%) - American Indian and Alaska Native
Place of birth - Foreign born (%) - Multirace
Place of birth - Foreign born (%) - Other Race
Residents speaking English at home (%)
Residents speaking English at home - Born in the United States (%)
Residents speaking English at home - Native, born elsewhere (%)
Residents speaking English at home - Foreign born (%)
Residents speaking Spanish at home (%)
Residents speaking Spanish at home - Born in the United States (%)
Residents speaking Spanish at home - Native, born elsewhere (%)
Residents speaking Spanish at home - Foreign born (%)
Residents speaking other language at home (%)
Residents speaking other language at home - Born in the United States (%)
Residents speaking other language at home - Native, born elsewhere (%)
Residents speaking other language at home - Foreign born (%)
Marital status - Never married (%)
Marital status - Now married (%)
Marital status - Separated (%)
Marital status - Widowed (%)
Marital status - Divorced (%)
Ancestries Reported - Arab (%)
Ancestries Reported - Czech (%)
Ancestries Reported - Danish (%)
Ancestries Reported - Dutch (%)
Ancestries Reported - English (%)
Ancestries Reported - French (%)
Ancestries Reported - French Canadian (%)
Ancestries Reported - German (%)
Ancestries Reported - Greek (%)
Ancestries Reported - Hungarian (%)
Ancestries Reported - Irish (%)
Ancestries Reported - Italian (%)
Ancestries Reported - Lithuanian (%)
Ancestries Reported - Norwegian (%)
Ancestries Reported - Polish (%)
Ancestries Reported - Portuguese (%)
Ancestries Reported - Russian (%)
Ancestries Reported - Scotch-Irish (%)
Ancestries Reported - Scottish (%)
Ancestries Reported - Slovak (%)
Ancestries Reported - Subsaharan African (%)
Ancestries Reported - Swedish (%)
Ancestries Reported - Swiss (%)
Ancestries Reported - Ukrainian (%)
Ancestries Reported - United States (%)
Ancestries Reported - Welsh (%)
Ancestries Reported - West Indian (%)
Ancestries Reported - Other (%)
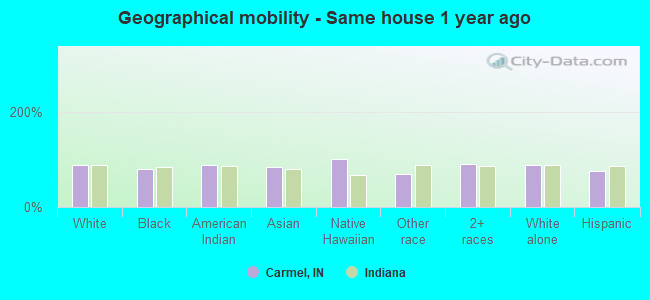
Geographical mobility - Same house 1 year ago (%)
Geographical mobility - Same house 1 year ago (%) - White
Geographical mobility - Same house 1 year ago (%) - Black or African American
Geographical mobility - Same house 1 year ago (%) - Asian
Geographical mobility - Same house 1 year ago (%) - Hispanic or Latino
Geographical mobility - Same house 1 year ago (%) - American Indian and Alaska Native
Geographical mobility - Same house 1 year ago (%) - Multirace
Geographical mobility - Same house 1 year ago (%) - Other Race
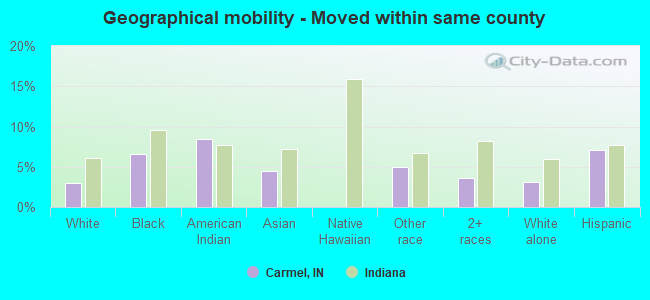
Geographical mobility - Moved within same county (%)
Geographical mobility - Moved within same county (%) - White
Geographical mobility - Moved within same county (%) - Black or African American
Geographical mobility - Moved within same county (%) - Asian
Geographical mobility - Moved within same county (%) - Hispanic or Latino
Geographical mobility - Moved within same county (%) - American Indian and Alaska Native
Geographical mobility - Moved within same county (%) - Multirace
Geographical mobility - Moved within same county (%) - Other Race
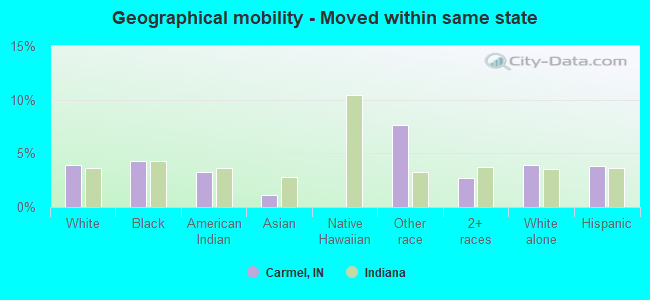
Geographical mobility - Moved from different county within same state (%)
Geographical mobility - Moved from different county within same state (%) - White
Geographical mobility - Moved from different county within same state (%) - Black or African American
Geographical mobility - Moved from different county within same state (%) - Asian
Geographical mobility - Moved from different county within same state (%) - Hispanic or Latino
Geographical mobility - Moved from different county within same state (%) - American Indian and Alaska Native
Geographical mobility - Moved from different county within same state (%) - Multirace
Geographical mobility - Moved from different county within same state (%) - Other Race
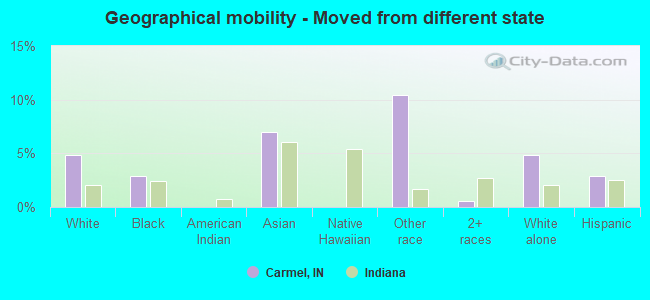
Geographical mobility - Moved from different state (%)
Geographical mobility - Moved from different state (%) - White
Geographical mobility - Moved from different state (%) - Black or African American
Geographical mobility - Moved from different state (%) - Asian
Geographical mobility - Moved from different state (%) - Hispanic or Latino
Geographical mobility - Moved from different state (%) - American Indian and Alaska Native
Geographical mobility - Moved from different state (%) - Multirace
Geographical mobility - Moved from different state (%) - Other Race
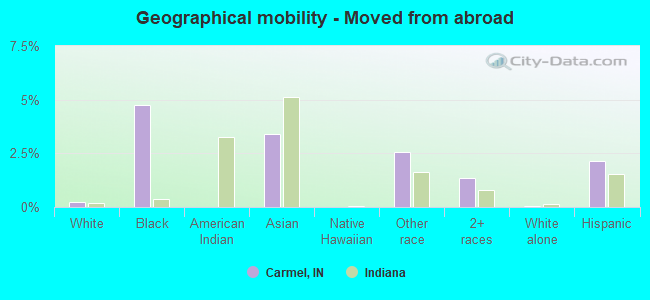
Geographical mobility - Moved from abroad (%)
Geographical mobility - Moved from abroad (%) - White
Geographical mobility - Moved from abroad (%) - Black or African American
Geographical mobility - Moved from abroad (%) - Asian
Geographical mobility - Moved from abroad (%) - Hispanic or Latino
Geographical mobility - Moved from abroad (%) - American Indian and Alaska Native
Geographical mobility - Moved from abroad (%) - Multirace
Geographical mobility - Moved from abroad (%) - Other Race
Place of birth for the foreign-born population - Ireland (%)
Place of birth for the foreign-born population - Denmark (%)
Place of birth for the foreign-born population - Norway (%)
Place of birth for the foreign-born population - Sweden (%)
Place of birth for the foreign-born population - United Kingdom (%)
Place of birth for the foreign-born population - England (%)
Place of birth for the foreign-born population - Scotland (%)
Place of birth for the foreign-born population - Other Northern Europe (%)
Place of birth for the foreign-born population - Austria (%)
Place of birth for the foreign-born population - Belgium (%)
Place of birth for the foreign-born population - France (%)
Place of birth for the foreign-born population - Germany (%)
Place of birth for the foreign-born population - Netherlands (%)
Place of birth for the foreign-born population - Switzerland (%)
Place of birth for the foreign-born population - Other Western Europe (%)
Place of birth for the foreign-born population - Greece (%)
Place of birth for the foreign-born population - Italy (%)
Place of birth for the foreign-born population - Portugal (%)
Place of birth for the foreign-born population - Spain (%)
Place of birth for the foreign-born population - Other Southern Europe (%)
Place of birth for the foreign-born population - Albania (%)
Place of birth for the foreign-born population - Belarus (%)
Place of birth for the foreign-born population - Bosnia and Herzegovina (%)
Place of birth for the foreign-born population - Bulgaria (%)
Place of birth for the foreign-born population - Croatia (%)
Place of birth for the foreign-born population - Czechoslovakia (%)
Place of birth for the foreign-born population - Hungary (%)
Place of birth for the foreign-born population - Latvia (%)
Place of birth for the foreign-born population - Lithuania (%)
Place of birth for the foreign-born population - North Macedonia (Macedonia) (%)
Place of birth for the foreign-born population - Moldova (%)
Place of birth for the foreign-born population - Poland (%)
Place of birth for the foreign-born population - Romania (%)
Place of birth for the foreign-born population - Russia (%)
Place of birth for the foreign-born population - Serbia (%)
Place of birth for the foreign-born population - Ukraine (%)
Place of birth for the foreign-born population - Other Eastern Europe (%)
Place of birth for the foreign-born population - China (%)
Place of birth for the foreign-born population - Hong Kong (%)
Place of birth for the foreign-born population - Taiwan (%)
Place of birth for the foreign-born population - Japan (%)
Place of birth for the foreign-born population - Korea (%)
Place of birth for the foreign-born population - Other Eastern Asia (%)
Place of birth for the foreign-born population - Afghanistan (%)
Place of birth for the foreign-born population - Bangladesh (%)
Place of birth for the foreign-born population - India (%)
Place of birth for the foreign-born population - Iran (%)
Place of birth for the foreign-born population - Kazakhstan (%)
Place of birth for the foreign-born population - Nepal (%)
Place of birth for the foreign-born population - Pakistan (%)
Place of birth for the foreign-born population - Sri Lanka (%)
Place of birth for the foreign-born population - Uzbekistan (%)
Place of birth for the foreign-born population - Other South Central Asia (%)
Place of birth for the foreign-born population - Burma (%)
Place of birth for the foreign-born population - Cambodia (%)
Place of birth for the foreign-born population - Indonesia (%)
Place of birth for the foreign-born population - Laos (%)
Place of birth for the foreign-born population - Malaysia (%)
Place of birth for the foreign-born population - Philippines (%)
Place of birth for the foreign-born population - Singapore (%)
Place of birth for the foreign-born population - Thailand (%)
Place of birth for the foreign-born population - Vietnam (%)
Place of birth for the foreign-born population - Other South Eastern Asia (%)
Place of birth for the foreign-born population - Armenia (%)
Place of birth for the foreign-born population - Iraq (%)
Place of birth for the foreign-born population - Israel (%)
Place of birth for the foreign-born population - Jordan (%)
Place of birth for the foreign-born population - Kuwait (%)
Place of birth for the foreign-born population - Lebanon (%)
Place of birth for the foreign-born population - Saudi Arabia (%)
Place of birth for the foreign-born population - Syria (%)
Place of birth for the foreign-born population - Turkey (%)
Place of birth for the foreign-born population - Yemen (%)
Place of birth for the foreign-born population - Other Western Asia (%)
Place of birth for the foreign-born population - Eritrea (%)
Place of birth for the foreign-born population - Ethiopia (%)
Place of birth for the foreign-born population - Kenya (%)
Place of birth for the foreign-born population - Somalia (%)
Place of birth for the foreign-born population - Uganda (%)
Place of birth for the foreign-born population - Zimbabwe (%)
Place of birth for the foreign-born population - Other Eastern Africa (%)
Place of birth for the foreign-born population - Cameroon (%)
Place of birth for the foreign-born population - Congo (%)
Place of birth for the foreign-born population - Democratic Republic of Congo (Zaire) (%)
Place of birth for the foreign-born population - Other Middle Africa (%)
Place of birth for the foreign-born population - Egypt (%)
Place of birth for the foreign-born population - Morocco (%)
Place of birth for the foreign-born population - Sudan (%)
Place of birth for the foreign-born population - Other Northern Africa (%)
Place of birth for the foreign-born population - South Africa (%)
Place of birth for the foreign-born population - Other Southern Africa (%)
Place of birth for the foreign-born population - Cabo Verde (%)
Place of birth for the foreign-born population - Ghana (%)
Place of birth for the foreign-born population - Liberia (%)
Place of birth for the foreign-born population - Nigeria (%)
Place of birth for the foreign-born population - Senegal (%)
Place of birth for the foreign-born population - Sierra Leone (%)
Place of birth for the foreign-born population - Other Western Africa (%)
Place of birth for the foreign-born population - Australia (%)
Place of birth for the foreign-born population - New Zealand (%)
Place of birth for the foreign-born population - Fiji (%)
Place of birth for the foreign-born population - Micronesia (%)
Place of birth for the foreign-born population - Bahamas (%)
Place of birth for the foreign-born population - Barbados (%)
Place of birth for the foreign-born population - Cuba (%)
Place of birth for the foreign-born population - Dominica (%)
Place of birth for the foreign-born population - Dominican Republic (%)
Place of birth for the foreign-born population - Grenada (%)
Place of birth for the foreign-born population - Haiti (%)
Place of birth for the foreign-born population - Jamaica (%)
Place of birth for the foreign-born population - St. Vincent and the Grenadines (%)
Place of birth for the foreign-born population - Trinidad and Tobago (%)
Place of birth for the foreign-born population - West Indies (%)
Place of birth for the foreign-born population - Other Caribbean (%)
Place of birth for the foreign-born population - Belize (%)
Place of birth for the foreign-born population - Costa Rica (%)
Place of birth for the foreign-born population - El Salvador (%)
Place of birth for the foreign-born population - Guatemala (%)
Place of birth for the foreign-born population - Honduras (%)
Place of birth for the foreign-born population - Mexico (%)
Place of birth for the foreign-born population - Nicaragua (%)
Place of birth for the foreign-born population - Panama (%)
Place of birth for the foreign-born population - Other Central America (%)
Place of birth for the foreign-born population - Argentina (%)
Place of birth for the foreign-born population - Bolivia (%)
Place of birth for the foreign-born population - Brazil (%)
Place of birth for the foreign-born population - Chile (%)
Place of birth for the foreign-born population - Colombia (%)
Place of birth for the foreign-born population - Ecuador (%)
Place of birth for the foreign-born population - Guyana (%)
Place of birth for the foreign-born population - Peru (%)
Place of birth for the foreign-born population - Uruguay (%)
Place of birth for the foreign-born population - Venezuela (%)
Place of birth for the foreign-born population - Other South America (%)
Place of birth for the foreign-born population - Canada (%)
Place of birth for the foreign-born population - Other Northern America (%)
Place of birth for the foreign-born population - Other (%)
Latest news about races in Carmel, IN collected exclusively by city-data.com from local newspapers, TV, and radio stations
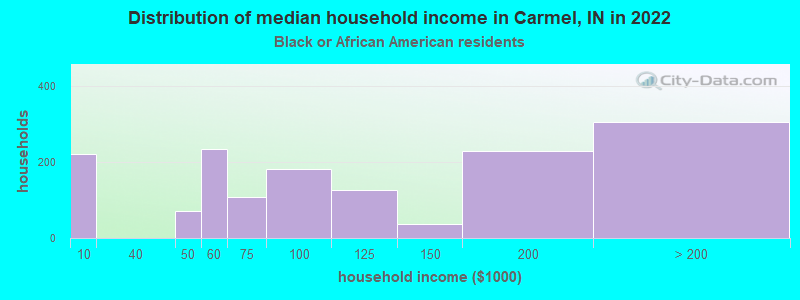
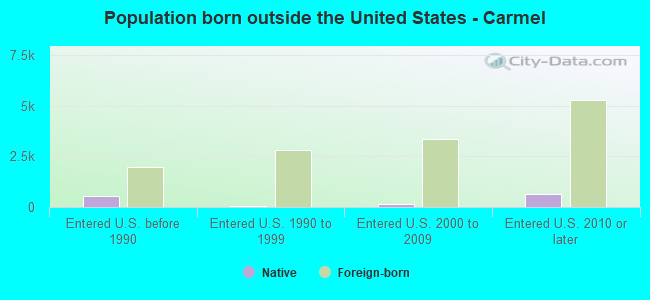
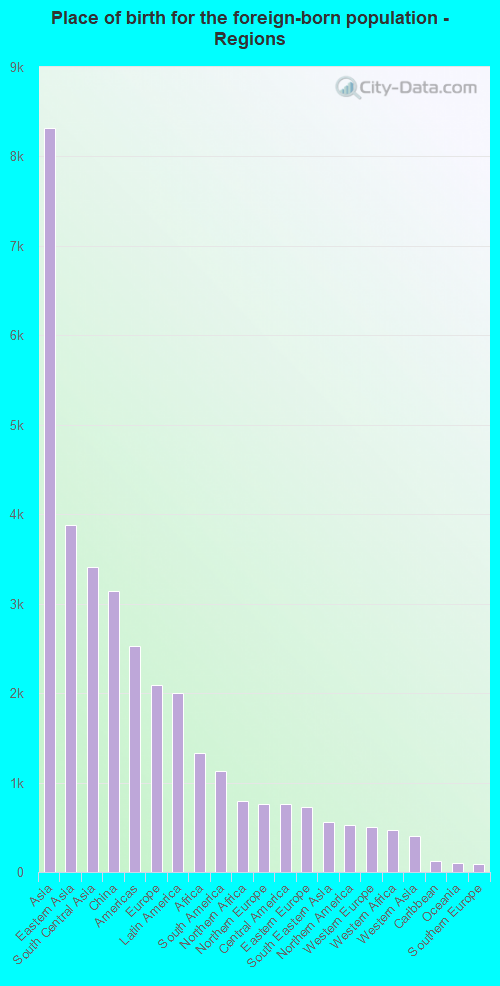
According to 2022 data, the most numerous races in Carmel, IN are White alone (75,191 residents), Black alone (6,277 residents), and Hispanic (4,835 residents). 82.9% of Carmel residents speak English at home. 13.8% of Carmel, IN residents are foreign-born (7.6% born in Asia, 1.9% born in Europe, 1.8% born in Latin America), which is 56.6% greater than the foreign-born rate of 6.0% across the entire state of Indiana.
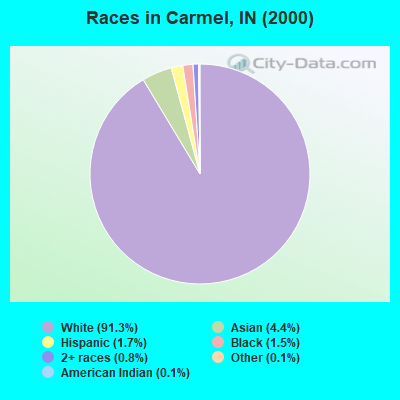
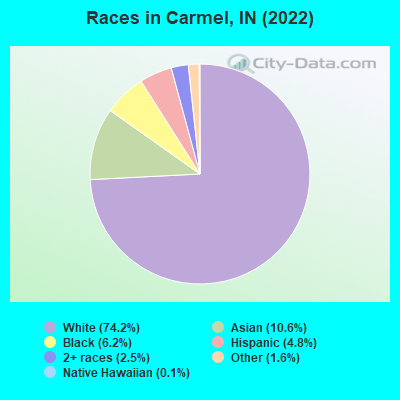
Race distribution in Carmel
2000 2022
5,219,373 85.8% White alone 505,462 8.3% Black alone 214,536 3.5% Hispanic 61,115 1.0% Two or more races 58,424 1.0% Asian alone 13,654 0.2% American Indian alone 6,348 0.1% Other race alone 1,573 0.03% Native Hawaiian and Other
5,192,455 76.0% White alone 628,054 9.2% Black alone 534,528 7.8% Hispanic 263,242 3.9% Two or more races 172,880 2.5% Asian alone 33,467 0.5% Other race alone 5,866 0.09% American Indian alone 2,545 0.04% Native Hawaiian and Other
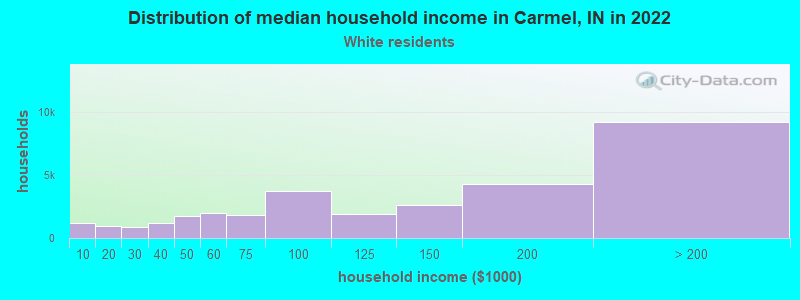
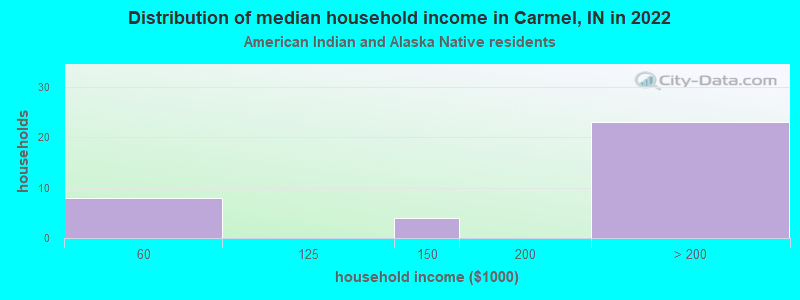
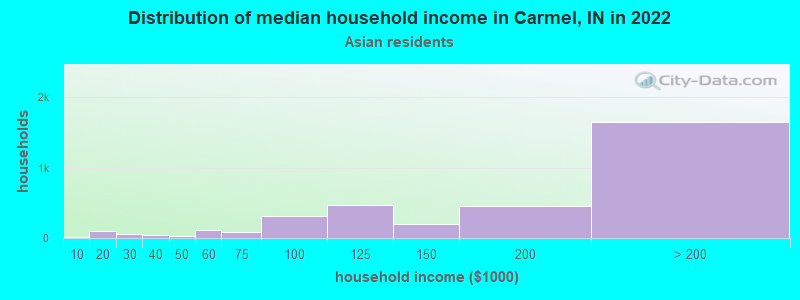
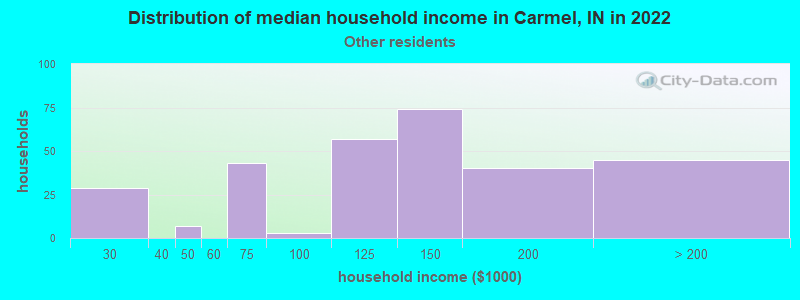
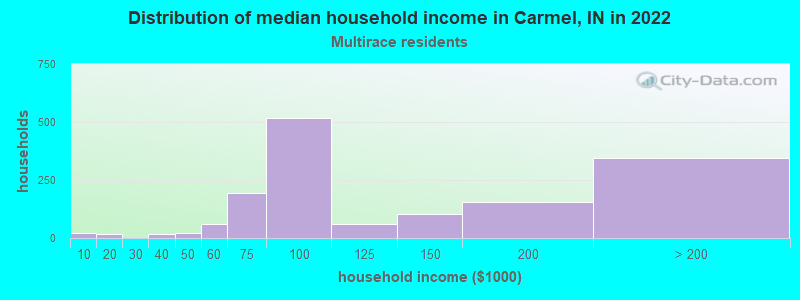
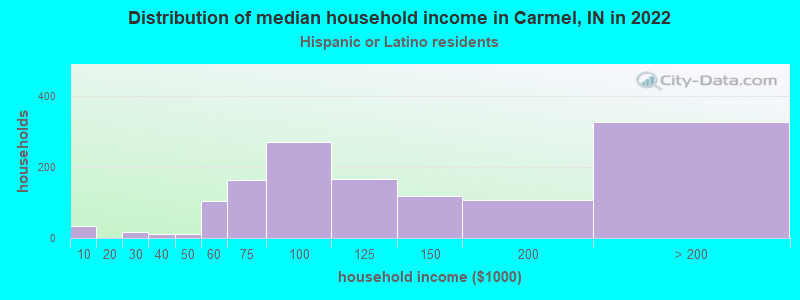
Income and house value in Carmel Median household income in 2022 $128,670 White non-Hispanic householders$75,760 Black householders$173,260 Asian householders$155,820 Two or more races householders$109,167 Hispanic or Latino race householdersMedian 2022 house value $473,996 White Non-Hispanic householders$278,753 Black or African American householders$243,822 American Indian or Alaska Native householders $537,149 Asian householders$480,011 Some other race householders$439,065 Two or more races householders$736,325 Hispanic or Latino householders
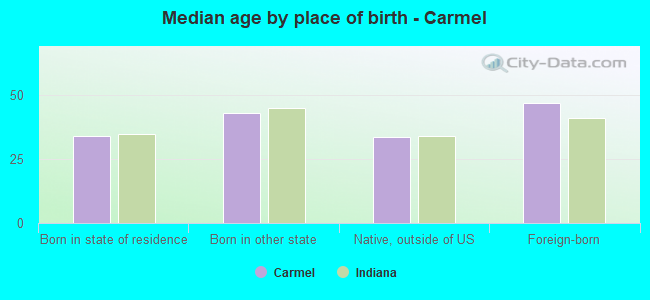
Median age by race in Carmel
43.2 Median age for White residents41.7 44.3 35.3 Median age for Black or African American residents36.9 35.0 -666,666,666.0 Median age for American Indian / Alaska Native residents-666,666,666.0 -666,666,666.0 33.4 Median age for Asian residents31.9 33.8 -666,666,666.0 Median age for Native Hawaiian / Pacific Islander residents-666,666,666.0 -666,666,666.0 29.8 Median age for Other race residents21.6 33.6 20.8 Median age for Two or more races residents19.7 21.1 43.5 Median age for White alone residents42.0 44.6 21.9 Median age for Hispanic or Latino residents32.0 21.0
Owner/renter occupied households by race in Carmel
House owners and renters - White residents 23,574 75.1% Owner occupied7,815 24.9% Renter occupiedHouse owners and renters - Black or African American residents 1,159 48.7% Owner occupied1,223 51.3% Renter occupiedHouse owners and renters - American Indian / Alaska Native residents 41 86.3% Owner occupied6 13.7% Renter occupiedHouse owners and renters - Asian residents 2,199 70.8% Owner occupied906 29.2% Renter occupiedHouse owners and renters - Native Hawaiian / Pacific Islander residents 12 100.0% Owner occupiedHouse owners and renters - Other race residents 293 84.9% Owner occupied52 15.1% Renter occupiedHouse owners and renters - Two or more races residents 974 69.9% Owner occupied419 30.1% Renter occupiedHouse owners and renters - White alone residents 23,463 75.3% Owner occupied7,678 24.7% Renter occupiedHouse owners and renters - Hispanic or Latino residents 547 47.5% Owner occupied605 52.5% Renter occupied
Language usage in Carmel
English speakers - Total 82.9% of residents of Carmel speak English at home.
2.5% of residents speak Spanish at home 2,054 85.3% Speak English very well355 14.7% Speak English less than very well14.6% of residents speak other language at home 11,124 79.1% Speak English very well2,945 20.9% Speak English less than very well
English speakers - Born in the United States 92.3% of residents of Carmel speak English at home.
1.2% of residents speak Spanish at home 424 100.0% Speak English very well6.5% of residents speak other language at home 2,314 98.8% Speak English very well28 1.2% Speak English less than very well
English speakers - Native, born elsewhere 58.7% of residents of Carmel speak English at home.
25.4% of residents speak Spanish at home 352 100.0% Speak English very well15.9% of residents speak other language at home 221 100.0% Speak English very well
English speakers - Foreign-born 19.2% of residents of Carmel speak English at home.
7.3% of residents speak Spanish at home 617 63.5% Speak English very well355 36.5% Speak English less than very well73.6% of residents speak other language at home 6,939 70.4% Speak English very well2,917 29.6% Speak English less than very well
White (Caucasian) - Speak only English Native:
97.5% (66,018)Foreign-born:
30.8% (1,362)
White (Caucasian) - Speak another language Native:
2.5% (1,713)Foreign-born:
69.2% (3,059)
Black or African American - Speak only English Native:
95.1% (2,660)Foreign-born:
37.5% (272)
Black or African American - Speak another language Native:
5.5% (154)Foreign-born:
51.2% (371)
American Indian / Alaska Native - Speak another language Native:
7.7% (9)Foreign-born:
100.0% (20)
Asian - Speak only English Native:
38.4% (1,537)Foreign-born:
9.3% (587)
Asian - Speak another language Native:
61.6% (2,468)Foreign-born:
90.7% (5,714)
Native Hawaiian / Pacific Islander - Speak only English Native:
99.5% (26)Foreign-born:
96.3% (58)
Other race - Speak only English Native:
65.7% (694)Foreign-born:
0.5% (1)
Other race - Speak another language Native:
35.5% (375)Foreign-born:
100.0% (289)
Two or more races - Speak only English Native:
88.3% (4,526)Foreign-born:
14.1% (173)
Two or more races - Speak another language Native:
11.7% (598)Foreign-born:
87.3% (1,073)
White alone - Speak only English Native:
97.6% (65,806)Foreign-born:
32.1% (1,362)
White alone - Speak another language Native:
2.4% (1,627)Foreign-born:
67.9% (2,887)
Hispanic or Latino - Speak only English Native:
73.4% (2,302)Foreign-born:
3.4% (50)
Hispanic or Latino - Speak another language Native:
26.7% (836)Foreign-born:
98.3% (1,438)
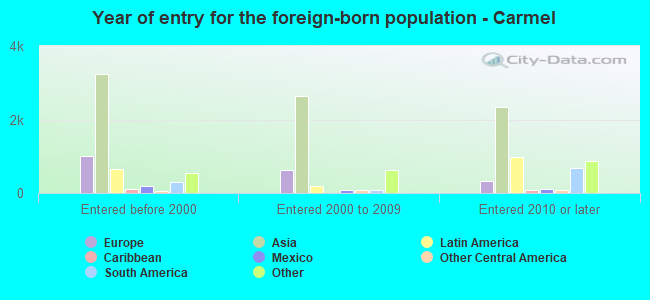
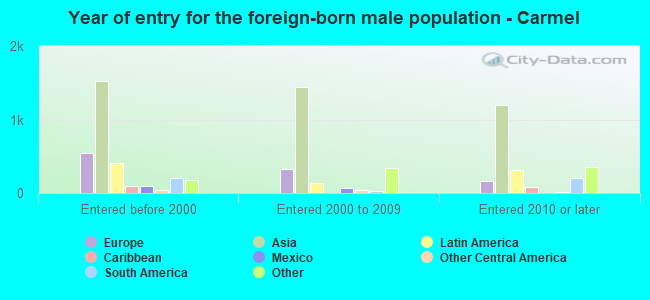
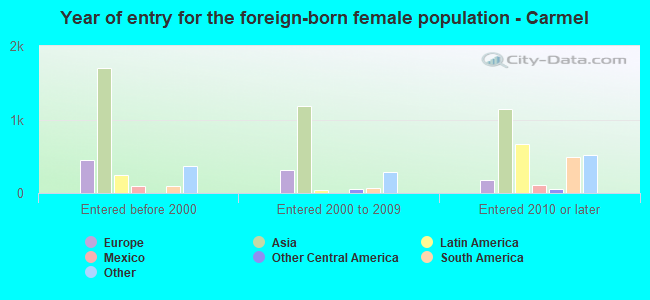
Foreign-born residents in Carmel 14,363 residents are foreign born (7.6% Asia , 1.9% Europe , 1.8% Latin America ).
This city:
13.8%Indiana:
5.6%
Marital status for residents in Carmel Marital status - White (Caucasian) population 15 years and over
Males 30.4% Never married62.9% Now married0.9% Separated1.8% Widowed4.0% DivorcedFemales 22.2% Never married57.3% Now married1.1% Separated7.5% Widowed11.9% DivorcedWomen who gave birth in the past 12 months Now married:
100.0% (812)Unmarried:
0.0% (0)
Women who did not give birth in the past 12 months Now married:
47.9% (7,584)Unmarried:
52.1% (8,242)
Marital status - Black or African American population 15 years and over
Males 37.9% Never married52.4% Now married0.0% Separated3.2% Widowed6.4% DivorcedFemales 35.8% Never married46.6% Now married0.0% Separated3.1% Widowed14.5% DivorcedWomen who gave birth in the past 12 months Now married:
100.0% (27)Unmarried:
0.0% (0)
Women who did not give birth in the past 12 months Now married:
45.4% (435)Unmarried:
54.6% (523)
Marital status - American Indian / Alaska Native population 15 years and over
Males 61.7% Never married31.7% Now married6.7% Separated0.0% Widowed0.0% DivorcedFemales 0.0% Never married100.0% Now married0.0% Separated0.0% Widowed0.0% DivorcedWomen who did not give birth in the past 12 months Now married:
100.0% (38)Unmarried:
0.0% (0)
Marital status - Asian population 15 years and over
Males 25.9% Never married70.5% Now married0.2% Separated0.1% Widowed3.3% DivorcedFemales 23.0% Never married71.7% Now married0.4% Separated1.0% Widowed3.9% DivorcedWomen who gave birth in the past 12 months Now married:
100.0% (214)Unmarried:
0.0% (0)
Women who did not give birth in the past 12 months Now married:
45.7% (1,454)Unmarried:
54.3% (1,728)
Marital status - Native Hawaiian / Pacific Islander population 15 years and over
Males 85.5% Never married14.5% Now married0.0% Separated0.0% Widowed0.0% DivorcedFemales 100.0% Never married0.0% Now married0.0% Separated0.0% Widowed0.0% DivorcedWomen who did not give birth in the past 12 months Now married:
0.0% (0)Unmarried:
100.0% (15)
Marital status - Other race population 15 years and over
Males 27.5% Never married72.2% Now married0.0% Separated0.3% Widowed0.0% DivorcedFemales 25.9% Never married74.1% Now married0.0% Separated0.0% Widowed0.0% DivorcedWomen who did not give birth in the past 12 months Now married:
64.3% (194)Unmarried:
35.7% (108)
Marital status - Two or more races population 15 years and over
Males 46.1% Never married50.4% Now married0.0% Separated1.4% Widowed2.1% DivorcedFemales 40.4% Never married51.5% Now married0.8% Separated0.6% Widowed6.7% DivorcedWomen who gave birth in the past 12 months Now married:
100.0% (103)Unmarried:
0.0% (0)
Women who did not give birth in the past 12 months Now married:
43.0% (653)Unmarried:
57.0% (866)
Marital status - White alone, not Hispanic / Latino population 15 years and over
Males 30.6% Never married62.7% Now married0.9% Separated1.8% Widowed4.0% DivorcedFemales 22.0% Never married57.4% Now married1.1% Separated7.5% Widowed11.9% DivorcedWomen who gave birth in the past 12 months Now married:
100.0% (812)Unmarried:
0.0% (0)
Women who did not give birth in the past 12 months Now married:
48.1% (7,546)Unmarried:
51.9% (8,156)
Marital status - Hispanic or Latino population 15 years and over
Males 22.8% Never married70.7% Now married1.2% Separated1.6% Widowed3.6% DivorcedFemales 39.0% Never married52.6% Now married0.0% Separated2.6% Widowed5.7% DivorcedWomen who gave birth in the past 12 months Now married:
100.0% (48)Unmarried:
0.0% (0)
Women who did not give birth in the past 12 months Now married:
46.1% (702)Unmarried:
53.9% (822)
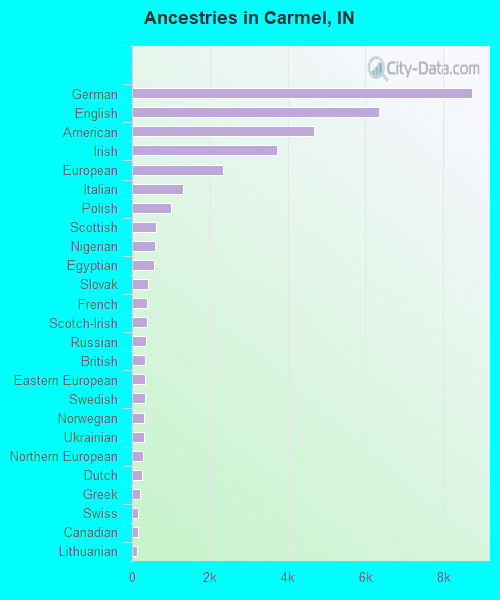
Ancestries in Carmel
8,744 16.8% German6,356 12.2% English4,673 9.0% American3,725 7.1% Irish2,345 4.5% European1,307 2.5% Italian992 1.9% Polish608 1.2% Scottish581 1.1% Nigerian573 1.1% Egyptian409 0.8% Slovak398 0.8% French387 0.7% Scotch-Irish367 0.7% Russian345 0.7% British329 0.6% Eastern European323 0.6% Swedish308 0.6% Norwegian297 0.6% Ukrainian278 0.5% Northern European262 0.5% Dutch216 0.4% Greek161 0.3% Swiss151 0.3% Canadian133 0.3% Lithuanian128 0.2% Portuguese123 0.2% Serbian122 0.2% Hungarian114 0.2% French Canadian94 0.2% Scandinavian88 0.2% Czechoslovakian87 0.2% African75 0.1% Latvian72 0.1% Lebanese72 0.1% Jordanian70 0.1% Turkish61 0.1% Welsh59 0.1% Somali57 0.1% Brazilian49 0.09% Sierra Leonean48 0.09% Palestinian45 0.09% Iraqi38 0.07% Austrian37 0.07% Danish36 0.07% Czech36 0.07% Slovene35 0.07% Haitian25 0.05% Armenian25 0.05% Romanian22 0.04% Macedonian21 0.04% Croatian21 0.04% South African15 0.03% Belgian14 0.03% Iranian14 0.03% Bulgarian12 0.02% Slavic10 0.02% Assyrian9 0.02% Australian9 0.02% Pennsylvania German9 0.02% Alsatian6 0.01% Icelander
Geographical mobility in Carmel Same house 1 year ago 66,383 88.0% White (Caucasian)2,758 79.0% Black or African American138 88.2% American Indian / Alaska Native8,879 84.0% Asian89 100.0% Native Hawaiian / Pacific Islander904 68.6% Other race6,037 90.7% Two or more races65,902 88.1% White alone, not Hispanic / Latino3,645 75.4% Hispanic or LatinoMoved within same county 2,281 3.0% White / Caucasian229 6.6% Black or African American13 8.4% American Indian / Alaska Native468 4.4% Asian65 4.9% Other race236 3.6% Two or more races2,281 3.1% White alone, not Hispanic / Latino340 7.0% Hispanic or LatinoMoved within same state 2,967 3.9% White / Caucasian149 4.3% Black or African American5 3.3% American Indian / Alaska Native117 1.1% Asian101 7.6% Other race180 2.7% Two or more races2,932 3.9% White alone, not Hispanic / Latino186 3.9% Hispanic or LatinoMoved from different state 3,621 4.8% White / Caucasian101 2.9% Black or African American739 7.0% Asian138 10.5% Other race36 0.5% Two or more races3,621 4.8% White alone, not Hispanic / Latino140 2.9% Hispanic or LatinoMoved from abroad 183 0.2% White166 4.7% Black or African American361 3.4% Asian34 2.6% Other race90 1.3% Two or more races46 0.1% White alone, not Hispanic / Latino103 2.1% Hispanic or Latino
Children Nativity (place of birth) in Carmel
Children under 6 years - Living with two parents Both parents native 3,854 100.0% NativeBoth parents foreign-born 769 100.0% NativeOne native, one foreign-born parent 291 100.0% NativeChildren under 6 years - Living with one parent Native parent 493 100.0% NativeForeign-born parent 150 100.0% NativeChildren 6 to 17 years - Living with two parents Both parents native 10,980 97.9% Native232 2.1% Foreign-bornBoth parents foreign-born 2,135 78.7% Native578 21.3% Foreign-bornOne native, one foreign-born parent 1,760 100.0% NativeChildren 6 to 17 years - Living with one parent Native parent 1,230 75.7% Native394 24.3% Foreign-bornForeign-born parent 1,012 76.6% Native309 23.4% Foreign-born
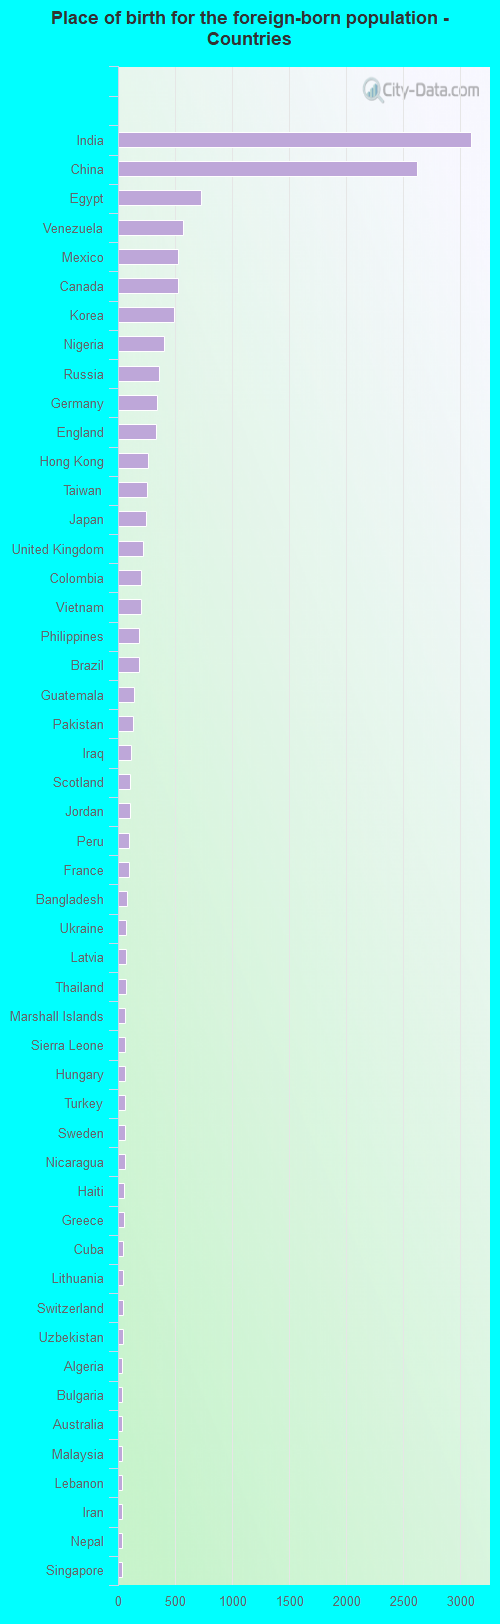
Place of birth for residents in Carmel 8,313 Asia3,880 Eastern Asia3,412 South Central Asia3,142 China2,529 Americas2,088 Europe2,004 Latin America1,331 Africa1,129 South America790 Northern Africa765 Northern Europe756 Central America722 Eastern Europe564 South Eastern Asia524 Northern America505 Western Europe465 Western Africa404 Western Asia118 Caribbean100 Oceania94 Southern Europe61 Eastern Africa36 Australia and New Zealand Subregion14 Southern Africa3,098 India2,625 China724 Egypt572 Venezuela528 Mexico524 Canada489 Korea400 Nigeria361 Russia345 Germany333 England263 Hong Kong253 Taiwan248 Japan216 United Kingdom205 Colombia199 Vietnam186 Philippines182 Brazil136 Guatemala130 Pakistan112 Iraq103 Scotland102 Jordan100 Peru97 France76 Bangladesh71 Ukraine70 Latvia66 Thailand64 Marshall Islands64 Sierra Leone63 Hungary63 Turkey60 Sweden57 Nicaragua53 Haiti53 Greece47 Cuba42 Lithuania40 Switzerland40 Uzbekistan38 Algeria36 Bulgaria36 Australia34 Malaysia34 Lebanon32 Iran32 Nepal31 Singapore28 Armenia28 Laos26 Romania25 Israel25 Panama23 Ireland21 Netherlands20 United Arab Emirates19 Chile17 Indonesia17 Kenya16 Croatia15 Italy14 Ethiopia14 South Africa14 Spain14 Argentina14 Zimbabwe14 Poland10 Portugal9 Saudi Arabia9 Costa Rica9 Belarus9 Morocco8 Dominican Republic8 Jamaica7 Kuwait
Grandparents responsible for own grandchildren in Carmel
Grandparents (30 to 59 years) White / Caucasian 28 37.5% Responsible for grandchildren47 62.5% Not responsible for grandchildrenAsian 11 100.0% Responsible for grandchildrenWhite alone, not Hispanic / Latino 29 51.3% Responsible for grandchildren28 48.7% Not responsible for grandchildrenHispanic or Latino 39 100.0% Not responsible for grandchildrenGrandparents (60 years and over) White / Caucasian 148 29.5% Responsible for grandchildren355 70.5% Not responsible for grandchildrenAsian 5 1.6% Responsible for grandchildren308 98.4% Not responsible for grandchildrenWhite alone, not Hispanic / Latino 139 27.3% Responsible for grandchildren370 72.7% Not responsible for grandchildrenHispanic or Latino 41 100.0% Not responsible for grandchildren