Races in Carrollton, Georgia (GA) Detailed Stats
Data:
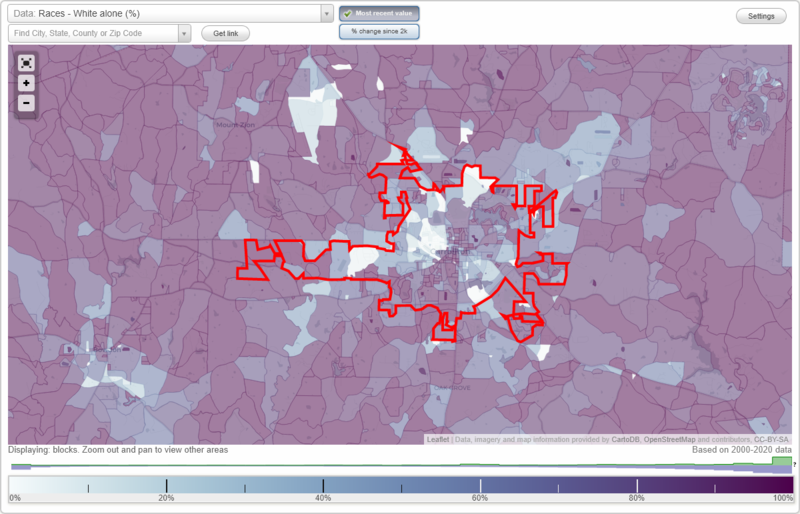
Races - White alone (%)
Races - White alone (% change since 2000)
Races - Black alone (%)
Races - Black alone (% change since 2000)
Races - American Indian alone (%)
Races - American Indian alone (% change since 2000)
Races - Asian alone (%)
Races - Asian alone (% change since 2000)
Races - Hispanic (%)
Races - Hispanic (% change since 2000)
Races - Native Hawaiian and Other Pacific Islander alone (%)
Races - Native Hawaiian and Other Pacific Islander alone (% change since 2000)
Races - Two or more races(%)
Races - Two or more races(% change since 2000)
Races - Other race alone (%)
Races - Other race alone (% change since 2000)
Racial diversity
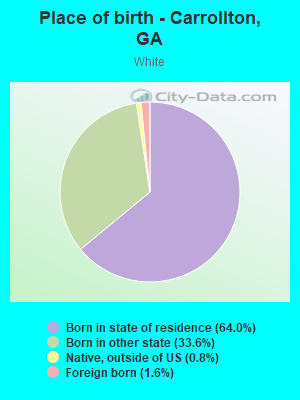
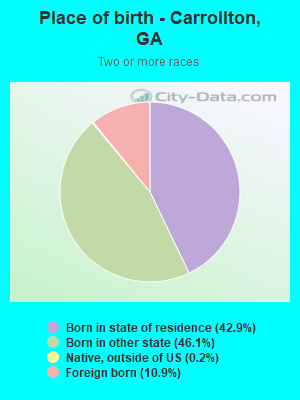
Place of birth - Born in state of residence (%)
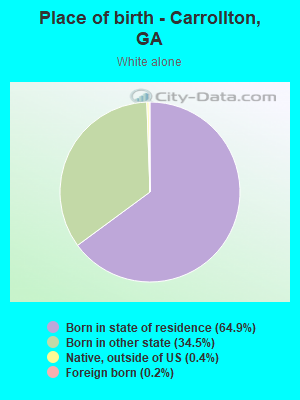
Place of birth - Born in state of residence (%) - White
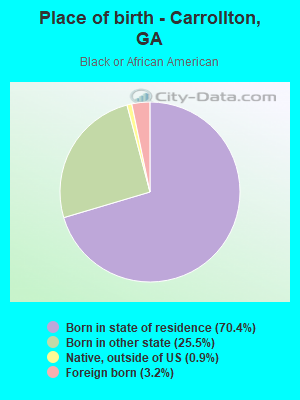
Place of birth - Born in state of residence (%) - Black or African American
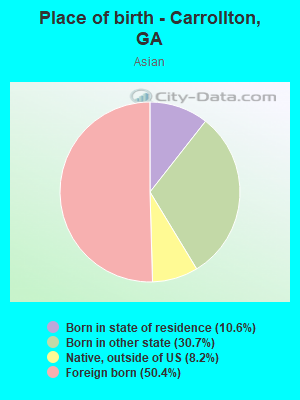
Place of birth - Born in state of residence (%) - Asian
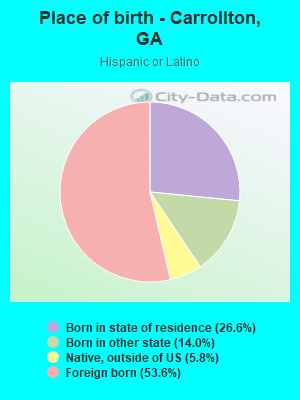
Place of birth - Born in state of residence (%) - Hispanic or Latino
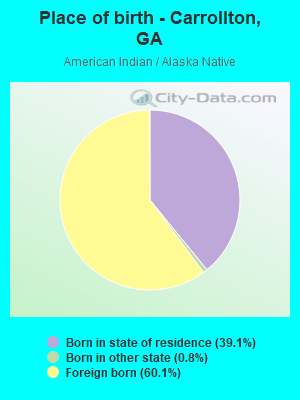
Place of birth - Born in state of residence (%) - American Indian and Alaska Native
Place of birth - Born in state of residence (%) - Multirace
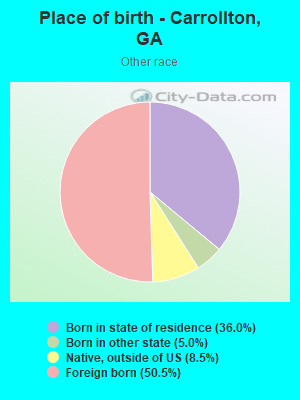
Place of birth - Born in state of residence (%) - Other Race
Place of birth - Born in other state (%)
Place of birth - Born in other state (%) - White
Place of birth - Born in other state (%) - Black or African American
Place of birth - Born in other state (%) - Asian
Place of birth - Born in other state (%) - Hispanic or Latino
Place of birth - Born in other state (%) - American Indian and Alaska Native
Place of birth - Born in other state (%) - Multirace
Place of birth - Born in other state (%) - Other Race
Place of birth - Native, outside of US (%)
Place of birth - Native, outside of US (%) - White
Place of birth - Native, outside of US (%) - Black or African American
Place of birth - Native, outside of US (%) - Asian
Place of birth - Native, outside of US (%) - Hispanic or Latino
Place of birth - Native, outside of US (%) - American Indian and Alaska Native
Place of birth - Native, outside of US (%) - Multirace
Place of birth - Native, outside of US (%) - Other Race
Place of birth - Foreign born (%)
Place of birth - Foreign born (%) - White
Place of birth - Foreign born (%) - Black or African American
Place of birth - Foreign born (%) - Asian
Place of birth - Foreign born (%) - Hispanic or Latino
Place of birth - Foreign born (%) - American Indian and Alaska Native
Place of birth - Foreign born (%) - Multirace
Place of birth - Foreign born (%) - Other Race
Residents speaking English at home (%)
Residents speaking English at home - Born in the United States (%)
Residents speaking English at home - Native, born elsewhere (%)
Residents speaking English at home - Foreign born (%)
Residents speaking Spanish at home (%)
Residents speaking Spanish at home - Born in the United States (%)
Residents speaking Spanish at home - Native, born elsewhere (%)
Residents speaking Spanish at home - Foreign born (%)
Residents speaking other language at home (%)
Residents speaking other language at home - Born in the United States (%)
Residents speaking other language at home - Native, born elsewhere (%)
Residents speaking other language at home - Foreign born (%)
Marital status - Never married (%)
Marital status - Now married (%)
Marital status - Separated (%)
Marital status - Widowed (%)
Marital status - Divorced (%)
Ancestries Reported - Arab (%)
Ancestries Reported - Czech (%)
Ancestries Reported - Danish (%)
Ancestries Reported - Dutch (%)
Ancestries Reported - English (%)
Ancestries Reported - French (%)
Ancestries Reported - French Canadian (%)
Ancestries Reported - German (%)
Ancestries Reported - Greek (%)
Ancestries Reported - Hungarian (%)
Ancestries Reported - Irish (%)
Ancestries Reported - Italian (%)
Ancestries Reported - Lithuanian (%)
Ancestries Reported - Norwegian (%)
Ancestries Reported - Polish (%)
Ancestries Reported - Portuguese (%)
Ancestries Reported - Russian (%)
Ancestries Reported - Scotch-Irish (%)
Ancestries Reported - Scottish (%)
Ancestries Reported - Slovak (%)
Ancestries Reported - Subsaharan African (%)
Ancestries Reported - Swedish (%)
Ancestries Reported - Swiss (%)
Ancestries Reported - Ukrainian (%)
Ancestries Reported - United States (%)
Ancestries Reported - Welsh (%)
Ancestries Reported - West Indian (%)
Ancestries Reported - Other (%)
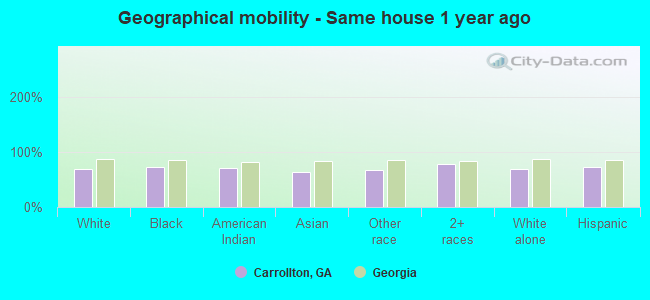
Geographical mobility - Same house 1 year ago (%)
Geographical mobility - Same house 1 year ago (%) - White
Geographical mobility - Same house 1 year ago (%) - Black or African American
Geographical mobility - Same house 1 year ago (%) - Asian
Geographical mobility - Same house 1 year ago (%) - Hispanic or Latino
Geographical mobility - Same house 1 year ago (%) - American Indian and Alaska Native
Geographical mobility - Same house 1 year ago (%) - Multirace
Geographical mobility - Same house 1 year ago (%) - Other Race
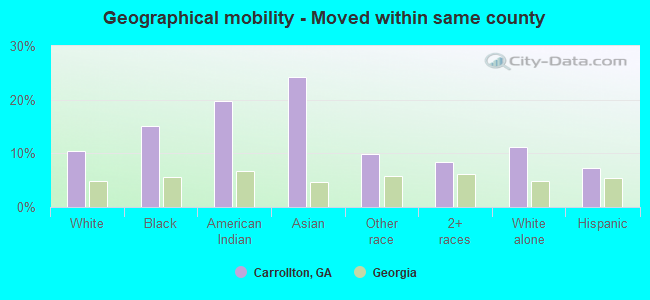
Geographical mobility - Moved within same county (%)
Geographical mobility - Moved within same county (%) - White
Geographical mobility - Moved within same county (%) - Black or African American
Geographical mobility - Moved within same county (%) - Asian
Geographical mobility - Moved within same county (%) - Hispanic or Latino
Geographical mobility - Moved within same county (%) - American Indian and Alaska Native
Geographical mobility - Moved within same county (%) - Multirace
Geographical mobility - Moved within same county (%) - Other Race
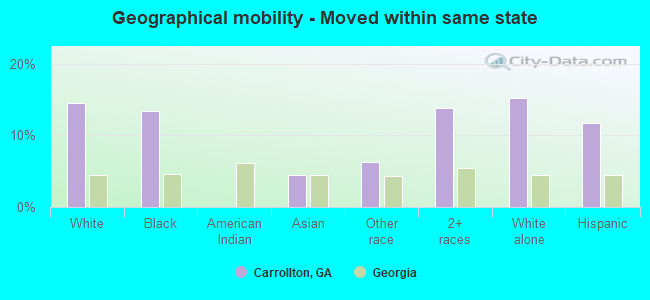
Geographical mobility - Moved from different county within same state (%)
Geographical mobility - Moved from different county within same state (%) - White
Geographical mobility - Moved from different county within same state (%) - Black or African American
Geographical mobility - Moved from different county within same state (%) - Asian
Geographical mobility - Moved from different county within same state (%) - Hispanic or Latino
Geographical mobility - Moved from different county within same state (%) - American Indian and Alaska Native
Geographical mobility - Moved from different county within same state (%) - Multirace
Geographical mobility - Moved from different county within same state (%) - Other Race
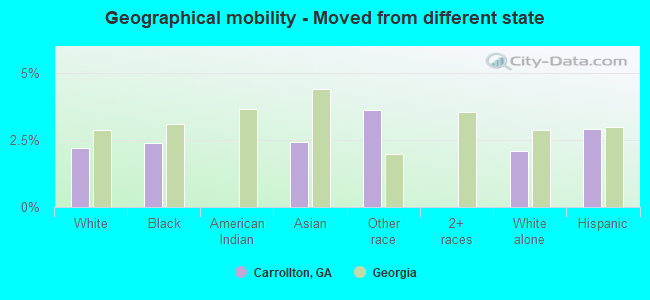
Geographical mobility - Moved from different state (%)
Geographical mobility - Moved from different state (%) - White
Geographical mobility - Moved from different state (%) - Black or African American
Geographical mobility - Moved from different state (%) - Asian
Geographical mobility - Moved from different state (%) - Hispanic or Latino
Geographical mobility - Moved from different state (%) - American Indian and Alaska Native
Geographical mobility - Moved from different state (%) - Multirace
Geographical mobility - Moved from different state (%) - Other Race
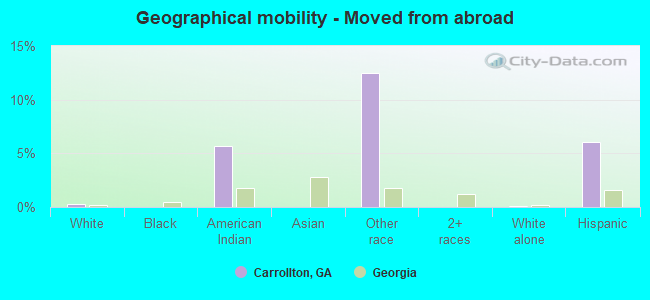
Geographical mobility - Moved from abroad (%)
Geographical mobility - Moved from abroad (%) - White
Geographical mobility - Moved from abroad (%) - Black or African American
Geographical mobility - Moved from abroad (%) - Asian
Geographical mobility - Moved from abroad (%) - Hispanic or Latino
Geographical mobility - Moved from abroad (%) - American Indian and Alaska Native
Geographical mobility - Moved from abroad (%) - Multirace
Geographical mobility - Moved from abroad (%) - Other Race
Place of birth for the foreign-born population - Ireland (%)
Place of birth for the foreign-born population - Denmark (%)
Place of birth for the foreign-born population - Norway (%)
Place of birth for the foreign-born population - Sweden (%)
Place of birth for the foreign-born population - United Kingdom (%)
Place of birth for the foreign-born population - England (%)
Place of birth for the foreign-born population - Scotland (%)
Place of birth for the foreign-born population - Other Northern Europe (%)
Place of birth for the foreign-born population - Austria (%)
Place of birth for the foreign-born population - Belgium (%)
Place of birth for the foreign-born population - France (%)
Place of birth for the foreign-born population - Germany (%)
Place of birth for the foreign-born population - Netherlands (%)
Place of birth for the foreign-born population - Switzerland (%)
Place of birth for the foreign-born population - Other Western Europe (%)
Place of birth for the foreign-born population - Greece (%)
Place of birth for the foreign-born population - Italy (%)
Place of birth for the foreign-born population - Portugal (%)
Place of birth for the foreign-born population - Spain (%)
Place of birth for the foreign-born population - Other Southern Europe (%)
Place of birth for the foreign-born population - Albania (%)
Place of birth for the foreign-born population - Belarus (%)
Place of birth for the foreign-born population - Bosnia and Herzegovina (%)
Place of birth for the foreign-born population - Bulgaria (%)
Place of birth for the foreign-born population - Croatia (%)
Place of birth for the foreign-born population - Czechoslovakia (%)
Place of birth for the foreign-born population - Hungary (%)
Place of birth for the foreign-born population - Latvia (%)
Place of birth for the foreign-born population - Lithuania (%)
Place of birth for the foreign-born population - North Macedonia (Macedonia) (%)
Place of birth for the foreign-born population - Moldova (%)
Place of birth for the foreign-born population - Poland (%)
Place of birth for the foreign-born population - Romania (%)
Place of birth for the foreign-born population - Russia (%)
Place of birth for the foreign-born population - Serbia (%)
Place of birth for the foreign-born population - Ukraine (%)
Place of birth for the foreign-born population - Other Eastern Europe (%)
Place of birth for the foreign-born population - China (%)
Place of birth for the foreign-born population - Hong Kong (%)
Place of birth for the foreign-born population - Taiwan (%)
Place of birth for the foreign-born population - Japan (%)
Place of birth for the foreign-born population - Korea (%)
Place of birth for the foreign-born population - Other Eastern Asia (%)
Place of birth for the foreign-born population - Afghanistan (%)
Place of birth for the foreign-born population - Bangladesh (%)
Place of birth for the foreign-born population - India (%)
Place of birth for the foreign-born population - Iran (%)
Place of birth for the foreign-born population - Kazakhstan (%)
Place of birth for the foreign-born population - Nepal (%)
Place of birth for the foreign-born population - Pakistan (%)
Place of birth for the foreign-born population - Sri Lanka (%)
Place of birth for the foreign-born population - Uzbekistan (%)
Place of birth for the foreign-born population - Other South Central Asia (%)
Place of birth for the foreign-born population - Burma (%)
Place of birth for the foreign-born population - Cambodia (%)
Place of birth for the foreign-born population - Indonesia (%)
Place of birth for the foreign-born population - Laos (%)
Place of birth for the foreign-born population - Malaysia (%)
Place of birth for the foreign-born population - Philippines (%)
Place of birth for the foreign-born population - Singapore (%)
Place of birth for the foreign-born population - Thailand (%)
Place of birth for the foreign-born population - Vietnam (%)
Place of birth for the foreign-born population - Other South Eastern Asia (%)
Place of birth for the foreign-born population - Armenia (%)
Place of birth for the foreign-born population - Iraq (%)
Place of birth for the foreign-born population - Israel (%)
Place of birth for the foreign-born population - Jordan (%)
Place of birth for the foreign-born population - Kuwait (%)
Place of birth for the foreign-born population - Lebanon (%)
Place of birth for the foreign-born population - Saudi Arabia (%)
Place of birth for the foreign-born population - Syria (%)
Place of birth for the foreign-born population - Turkey (%)
Place of birth for the foreign-born population - Yemen (%)
Place of birth for the foreign-born population - Other Western Asia (%)
Place of birth for the foreign-born population - Eritrea (%)
Place of birth for the foreign-born population - Ethiopia (%)
Place of birth for the foreign-born population - Kenya (%)
Place of birth for the foreign-born population - Somalia (%)
Place of birth for the foreign-born population - Uganda (%)
Place of birth for the foreign-born population - Zimbabwe (%)
Place of birth for the foreign-born population - Other Eastern Africa (%)
Place of birth for the foreign-born population - Cameroon (%)
Place of birth for the foreign-born population - Congo (%)
Place of birth for the foreign-born population - Democratic Republic of Congo (Zaire) (%)
Place of birth for the foreign-born population - Other Middle Africa (%)
Place of birth for the foreign-born population - Egypt (%)
Place of birth for the foreign-born population - Morocco (%)
Place of birth for the foreign-born population - Sudan (%)
Place of birth for the foreign-born population - Other Northern Africa (%)
Place of birth for the foreign-born population - South Africa (%)
Place of birth for the foreign-born population - Other Southern Africa (%)
Place of birth for the foreign-born population - Cabo Verde (%)
Place of birth for the foreign-born population - Ghana (%)
Place of birth for the foreign-born population - Liberia (%)
Place of birth for the foreign-born population - Nigeria (%)
Place of birth for the foreign-born population - Senegal (%)
Place of birth for the foreign-born population - Sierra Leone (%)
Place of birth for the foreign-born population - Other Western Africa (%)
Place of birth for the foreign-born population - Australia (%)
Place of birth for the foreign-born population - New Zealand (%)
Place of birth for the foreign-born population - Fiji (%)
Place of birth for the foreign-born population - Micronesia (%)
Place of birth for the foreign-born population - Bahamas (%)
Place of birth for the foreign-born population - Barbados (%)
Place of birth for the foreign-born population - Cuba (%)
Place of birth for the foreign-born population - Dominica (%)
Place of birth for the foreign-born population - Dominican Republic (%)
Place of birth for the foreign-born population - Grenada (%)
Place of birth for the foreign-born population - Haiti (%)
Place of birth for the foreign-born population - Jamaica (%)
Place of birth for the foreign-born population - St. Vincent and the Grenadines (%)
Place of birth for the foreign-born population - Trinidad and Tobago (%)
Place of birth for the foreign-born population - West Indies (%)
Place of birth for the foreign-born population - Other Caribbean (%)
Place of birth for the foreign-born population - Belize (%)
Place of birth for the foreign-born population - Costa Rica (%)
Place of birth for the foreign-born population - El Salvador (%)
Place of birth for the foreign-born population - Guatemala (%)
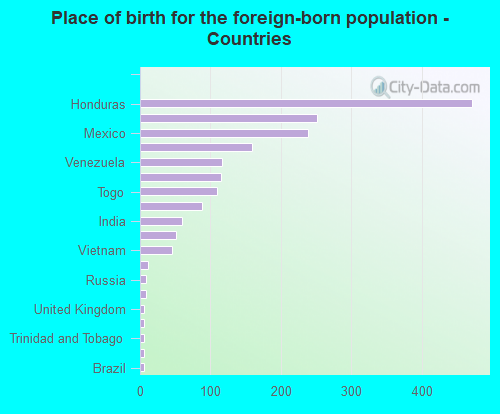
Place of birth for the foreign-born population - Honduras (%)
Place of birth for the foreign-born population - Mexico (%)
Place of birth for the foreign-born population - Nicaragua (%)
Place of birth for the foreign-born population - Panama (%)
Place of birth for the foreign-born population - Other Central America (%)
Place of birth for the foreign-born population - Argentina (%)
Place of birth for the foreign-born population - Bolivia (%)
Place of birth for the foreign-born population - Brazil (%)
Place of birth for the foreign-born population - Chile (%)
Place of birth for the foreign-born population - Colombia (%)
Place of birth for the foreign-born population - Ecuador (%)
Place of birth for the foreign-born population - Guyana (%)
Place of birth for the foreign-born population - Peru (%)
Place of birth for the foreign-born population - Uruguay (%)
Place of birth for the foreign-born population - Venezuela (%)
Place of birth for the foreign-born population - Other South America (%)
Place of birth for the foreign-born population - Canada (%)
Place of birth for the foreign-born population - Other Northern America (%)
Place of birth for the foreign-born population - Other (%)
Latest news about races in Carrollton, GA collected exclusively by city-data.com from local newspapers, TV, and radio stations
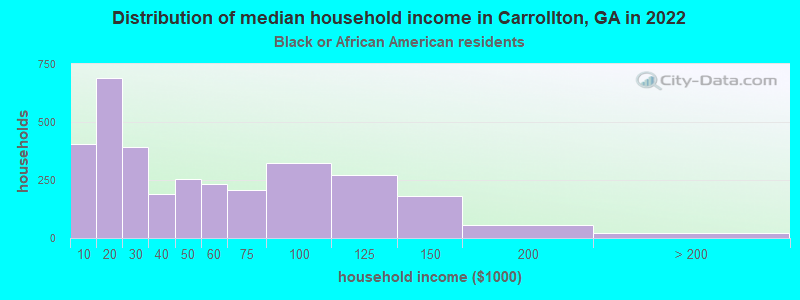
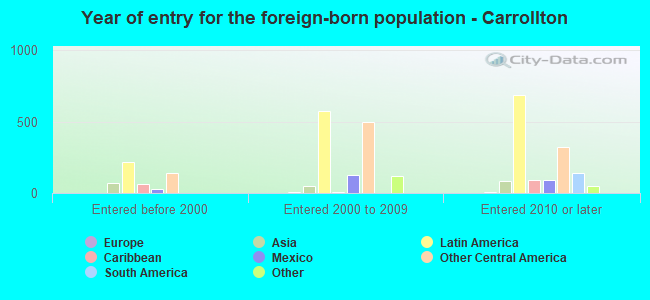
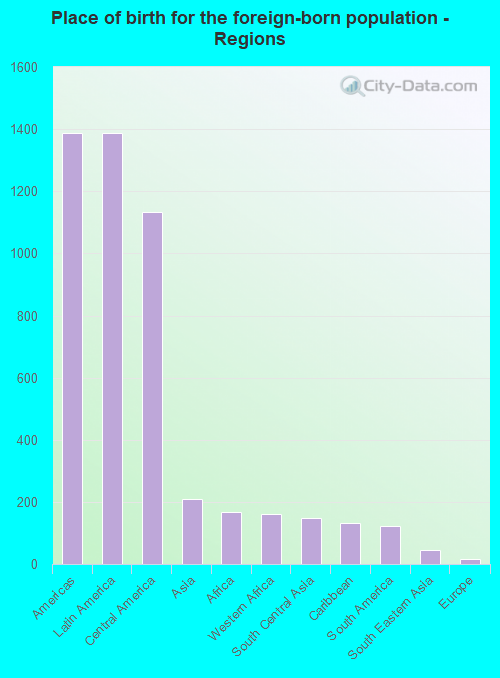
According to 2022 data, the most numerous races in Carrollton, GA are White alone (13,779 residents), Black alone (9,699 residents), and Hispanic (2,735 residents). 88.2% of Carrollton residents speak English at home. 6.5% of Carrollton, GA residents are foreign-born (5.0% born in Latin America, 0.7% born in Asia), which is 55.0% less than the foreign-born rate of 10.0% across the entire state of Georgia.
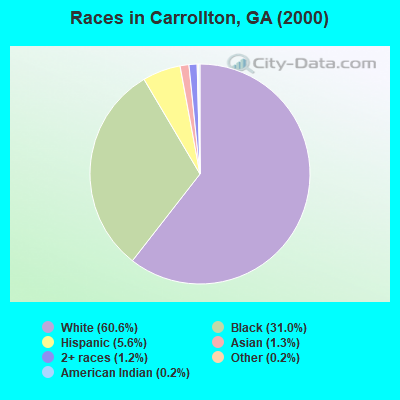
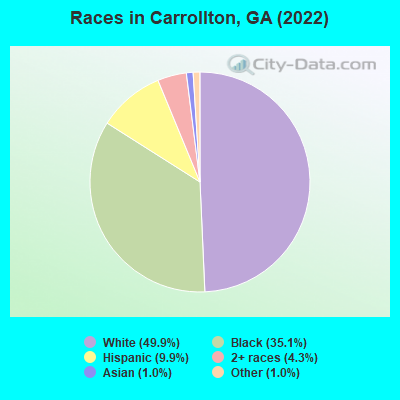
Race distribution in Carrollton
2000 2022
5,128,661 62.6% White alone 2,331,465 28.5% Black alone 435,227 5.3% Hispanic 171,513 2.1% Asian alone 87,364 1.1% Two or more races 17,670 0.2% American Indian alone 11,275 0.1% Other race alone 3,278 0.04% Native Hawaiian and Other
5,415,657 49.6% White alone 3,349,240 30.7% Black alone 1,132,604 10.4% Hispanic 479,156 4.4% Asian alone 462,923 4.2% Two or more races 54,416 0.5% Other race alone 11,923 0.1% American Indian alone 6,957 0.06% Native Hawaiian and Other
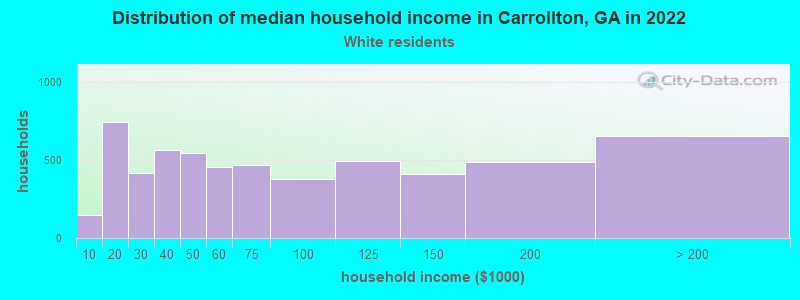
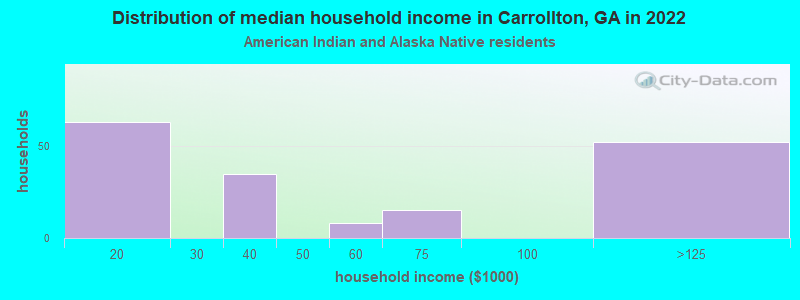
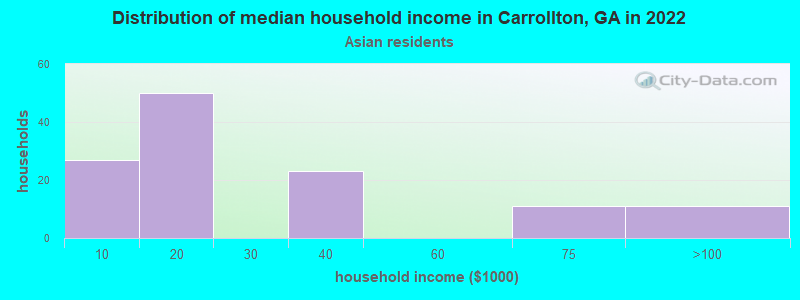
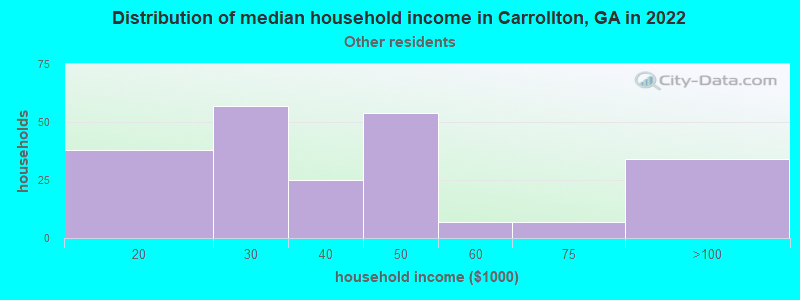
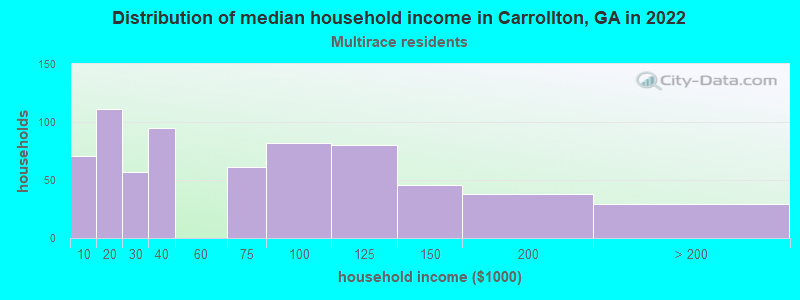
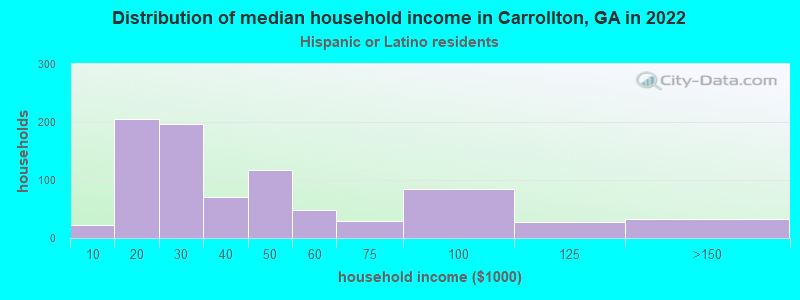
Income and house value in Carrollton Median household income in 2022 $62,855 White non-Hispanic householders$38,887 Black householders$35,242 Some other race householders$29,344 Hispanic or Latino race householdersMedian 2022 house value $382,009 White Non-Hispanic householders$229,138 Black or African American householders $386,733 Asian householders$185,605 Some other race householders$298,655 Two or more races householders$202,478 Hispanic or Latino householders
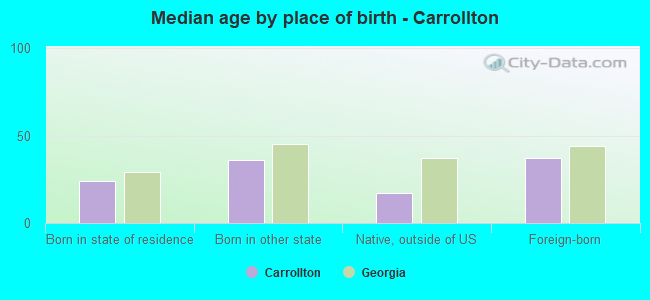
Median age by race in Carrollton
32.6 Median age for White residents28.5 34.7 23.8 Median age for Black or African American residents23.8 22.8 24.2 Median age for American Indian / Alaska Native residents27.3 17.9 24.9 Median age for Asian residents28.5 31.4 -666,666,666.0 Median age for Native Hawaiian / Pacific Islander residents-666,666,666.0 -666,666,666.0 26.3 Median age for Other race residents15.5 23.5 41.2 Median age for Two or more races residents29.7 60.6 33.5 Median age for White alone residents29.7 34.5 20.1 Median age for Hispanic or Latino residents15.5 24.3
Owner/renter occupied households by race in Carrollton
House owners and renters - White residents 2,962 50.2% Owner occupied2,936 49.8% Renter occupiedHouse owners and renters - Black or African American residents 666 25.1% Owner occupied1,986 74.9% Renter occupiedHouse owners and renters - American Indian / Alaska Native residents 57 30.3% Owner occupied131 69.7% Renter occupiedHouse owners and renters - Asian residents 104 100.0% Renter occupiedHouse owners and renters - Other race residents 23 6.7% Owner occupied321 93.3% Renter occupiedHouse owners and renters - Two or more races residents 177 29.9% Owner occupied414 70.1% Renter occupiedHouse owners and renters - White alone residents 2,850 49.9% Owner occupied2,857 50.1% Renter occupiedHouse owners and renters - Hispanic or Latino residents 207 21.2% Owner occupied769 78.8% Renter occupied
Language usage in Carrollton
English speakers - Total 88.2% of residents of Carrollton speak English at home.
8.3% of residents speak Spanish at home 876 41.7% Speak English very well1,226 58.3% Speak English less than very well3.2% of residents speak other language at home 559 68.5% Speak English very well257 31.5% Speak English less than very well
English speakers - Born in the United States 94.4% of residents of Carrollton speak English at home.
3.8% of residents speak Spanish at home 173 59.7% Speak English very well117 40.3% Speak English less than very well1.8% of residents speak other language at home 120 88.2% Speak English very well16 11.8% Speak English less than very well
English speakers - Native, born elsewhere 64.4% of residents of Carrollton speak English at home.
12.3% of residents speak Spanish at home 42 93.3% Speak English very well3 6.7% Speak English less than very well24.9% of residents speak other language at home 91 100.0% Speak English very well
English speakers - Foreign-born 2.4% of residents of Carrollton speak English at home.
68.7% of residents speak Spanish at home 176 14.4% Speak English very well1,049 85.6% Speak English less than very well28.0% of residents speak other language at home 262 52.5% Speak English very well237 47.5% Speak English less than very well
White (Caucasian) - Speak only English Native:
97.0% (12,954)Foreign-born:
15.9% (36)
White (Caucasian) - Speak another language Native:
2.9% (383)Foreign-born:
87.5% (200)
Black or African American - Speak only English Native:
98.3% (8,585)Foreign-born:
4.8% (15)
Black or African American - Speak another language Native:
1.6% (143)Foreign-born:
97.0% (311)
American Indian / Alaska Native - Speak another language Native:
90.2% (202)Foreign-born:
100.0% (416)
Asian - Speak another language Native:
88.4% (107)Foreign-born:
100.0% (145)
Other race - Speak another language Native:
39.3% (108)Foreign-born:
99.0% (462)
Two or more races - Speak another language Native:
27.6% (345)Foreign-born:
99.4% (435)
White alone - Speak only English Native:
99.1% (12,921)Foreign-born:
100.0% (21)
White alone - Speak another language Native:
0.8% (109)Foreign-born:
20.9% (4)
Hispanic or Latino - Speak only English Native:
18.6% (206)Foreign-born:
1.2% (18)
Hispanic or Latino - Speak another language Native:
93.0% (1,029)Foreign-born:
97.9% (1,461)
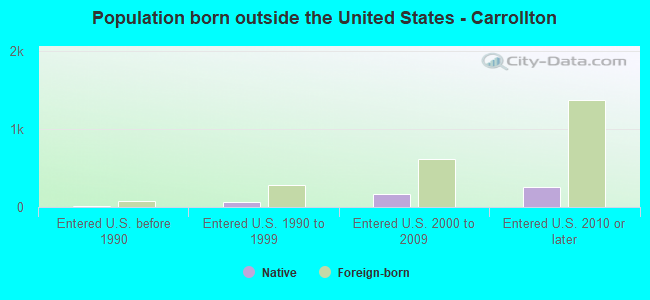
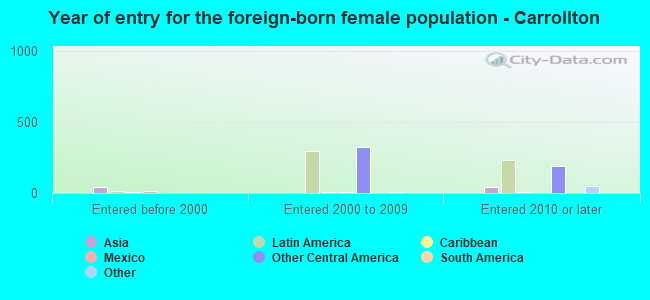
Foreign-born residents in Carrollton 1,782 residents are foreign born (5.0% Latin America , 0.7% Asia ).
This city:
6.5%Georgia:
10.4%
Marital status for residents in Carrollton Marital status - White (Caucasian) population 15 years and over
Males 41.6% Never married43.4% Now married0.8% Separated2.9% Widowed11.3% DivorcedFemales 36.0% Never married42.0% Now married0.8% Separated10.9% Widowed10.4% DivorcedWomen who gave birth in the past 12 months Now married:
40.6% (95)Unmarried:
59.4% (139)
Women who did not give birth in the past 12 months Now married:
38.1% (1,590)Unmarried:
61.9% (2,579)
Marital status - Black or African American population 15 years and over
Males 64.4% Never married20.3% Now married0.4% Separated6.3% Widowed8.6% DivorcedFemales 66.4% Never married15.7% Now married1.7% Separated4.6% Widowed11.6% DivorcedWomen who gave birth in the past 12 months Now married:
0.0% (0)Unmarried:
100.0% (144)
Women who did not give birth in the past 12 months Now married:
8.8% (259)Unmarried:
91.2% (2,676)
Marital status - American Indian / Alaska Native population 15 years and over
Males 7.0% Never married80.6% Now married0.0% Separated0.0% Widowed12.4% DivorcedFemales 74.0% Never married26.0% Now married0.0% Separated0.0% Widowed0.0% DivorcedWomen who did not give birth in the past 12 months Now married:
46.5% (63)Unmarried:
53.5% (73)
Marital status - Asian population 15 years and over
Males 69.5% Never married30.5% Now married0.0% Separated0.0% Widowed0.0% DivorcedFemales 47.2% Never married36.1% Now married0.0% Separated0.0% Widowed16.7% DivorcedWomen who gave birth in the past 12 months Now married:
100.0% (40)Unmarried:
0.0% (0)
Women who did not give birth in the past 12 months Now married:
0.0% (0)Unmarried:
100.0% (53)
Marital status - Other race population 15 years and over
Males 64.4% Never married26.9% Now married2.2% Separated0.0% Widowed6.4% DivorcedFemales 25.9% Never married74.1% Now married0.0% Separated0.0% Widowed0.0% DivorcedWomen who gave birth in the past 12 months Now married:
100.0% (12)Unmarried:
0.0% (0)
Women who did not give birth in the past 12 months Now married:
72.7% (156)Unmarried:
27.3% (58)
Marital status - Two or more races population 15 years and over
Males 61.8% Never married27.6% Now married5.8% Separated0.0% Widowed4.8% DivorcedFemales 25.5% Never married50.0% Now married0.0% Separated1.5% Widowed22.9% DivorcedWomen who did not give birth in the past 12 months Now married:
54.3% (207)Unmarried:
45.7% (175)
Marital status - White alone, not Hispanic / Latino population 15 years and over
Males 41.9% Never married43.0% Now married0.6% Separated3.1% Widowed11.4% DivorcedFemales 35.5% Never married41.7% Now married0.7% Separated11.3% Widowed10.8% DivorcedWomen who gave birth in the past 12 months Now married:
36.7% (81)Unmarried:
63.3% (139)
Women who did not give birth in the past 12 months Now married:
37.4% (1,467)Unmarried:
62.6% (2,457)
Marital status - Hispanic or Latino population 15 years and over
Males 51.9% Never married39.1% Now married1.7% Separated0.0% Widowed7.3% DivorcedFemales 52.4% Never married45.9% Now married1.3% Separated0.0% Widowed0.4% DivorcedWomen who gave birth in the past 12 months Now married:
100.0% (16)Unmarried:
0.0% (0)
Women who did not give birth in the past 12 months Now married:
50.6% (423)Unmarried:
49.4% (413)
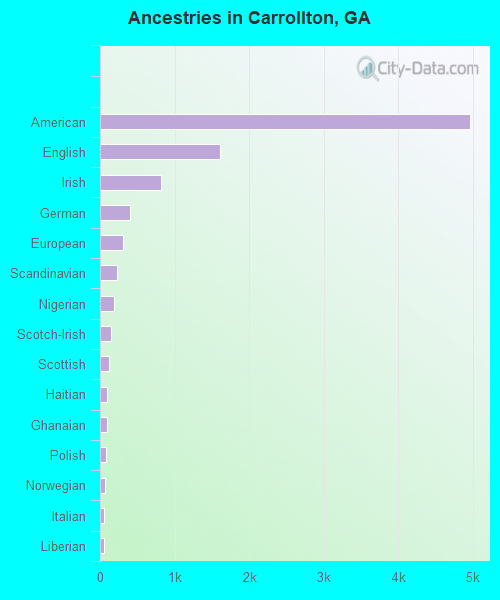
Ancestries in Carrollton
4,972 27.6% American1,607 8.9% English823 4.6% Irish396 2.2% German315 1.8% European222 1.2% Scandinavian193 1.1% Nigerian147 0.8% Scotch-Irish124 0.7% Scottish94 0.5% Haitian91 0.5% Ghanaian76 0.4% Polish65 0.4% Norwegian58 0.3% Italian55 0.3% Liberian45 0.3% Slovak44 0.2% Swedish42 0.2% West Indian23 0.1% Kenyan21 0.1% British19 0.1% Ethiopian16 0.09% Eastern European9 0.05% Jamaican8 0.04% French Canadian6 0.03% French6 0.03% Russian4 0.02% Brazilian4 0.02% Celtic4 0.02% Cape Verdean4 0.02% Bahamian2 0.01% African
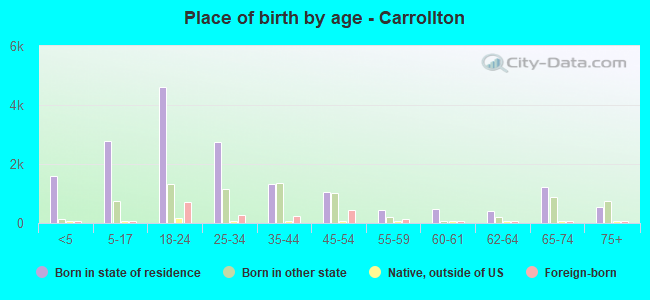
Geographical mobility in Carrollton Same house 1 year ago 10,038 70.2% White (Caucasian)7,059 72.8% Black or African American440 71.2% American Indian / Alaska Native166 63.9% Asian493 66.9% Other race1,418 78.1% Two or more races9,494 69.4% White alone, not Hispanic / Latino1,898 73.6% Hispanic or LatinoMoved within same county 1,494 10.4% White / Caucasian1,464 15.1% Black or African American123 19.8% American Indian / Alaska Native63 24.3% Asian73 9.9% Other race152 8.4% Two or more races1,525 11.1% White alone, not Hispanic / Latino187 7.2% Hispanic or LatinoMoved within same state 2,084 14.6% White / Caucasian1,304 13.4% Black or African American12 4.5% Asian47 6.3% Other race251 13.8% Two or more races2,091 15.3% White alone, not Hispanic / Latino302 11.7% Hispanic or LatinoMoved from different state 314 2.2% White / Caucasian233 2.4% Black or African American6 2.4% Asian27 3.6% Other race284 2.1% White alone, not Hispanic / Latino75 2.9% Hispanic or LatinoMoved from abroad 43 0.3% White4 0.0% Black or African American35 5.7% American Indian / Alaska Native92 12.5% Other race11 0.1% White alone, not Hispanic / Latino156 6.0% Hispanic or Latino
Children Nativity (place of birth) in Carrollton
Children under 6 years - Living with two parents Both parents native 596 100.0% NativeBoth parents foreign-born 119 100.0% NativeOne native, one foreign-born parent 42 100.0% NativeChildren under 6 years - Living with one parent Native parent 1,338 100.0% NativeForeign-born parent 13 100.0% NativeChildren 6 to 17 years - Living with two parents Both parents native 1,266 100.0% NativeBoth parents foreign-born 304 88.1% Native41 11.9% Foreign-bornChildren 6 to 17 years - Living with one parent Native parent 1,098 100.0% NativeForeign-born parent 123 50.3% Native121 49.7% Foreign-born
Grandparents responsible for own grandchildren in Carrollton
Grandparents (30 to 59 years) White / Caucasian 34 100.0% Responsible for grandchildrenBlack or African American 33 44.5% Responsible for grandchildren41 55.5% Not responsible for grandchildrenWhite alone, not Hispanic / Latino 34 100.0% Responsible for grandchildren
Grandparents (60 years and over) White / Caucasian 9 100.0% Not responsible for grandchildrenBlack or African American 14 100.0% Responsible for grandchildrenWhite alone, not Hispanic / Latino 9 100.0% Not responsible for grandchildren