Races in Carthage, Maine (ME) Detailed Stats
Ancestries, Foreign-born residents, place of birth

Discuss Carthage, Maine races on our local forum with over 2,400,000 registered users
0.6% of Carthage, ME residents are foreign-born , which is 420.0% less than the foreign-born rate of 3.0% across the entire state of Maine.
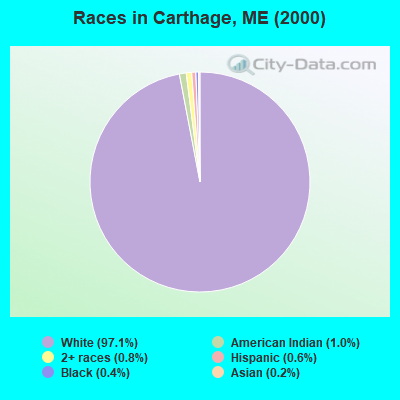
Race distribution in Carthage

- 50597.1%White alone
- 51.0%American Indian alone
- 40.8%Two or more races
- 30.6%Hispanic
- 20.4%Black alone
- 10.2%Asian alone
2000
2022
-
- 1,230,29796.5%White alone
- 11,7310.9%Two or more races
- 9,3600.7%Hispanic
- 9,0140.7%Asian alone
- 6,4400.5%Black alone
- 6,9110.5%American Indian alone
- 8360.07%Other race alone
- 3340.03%Native Hawaiian and Other
Pacific Islander alone

-
- 1,249,23390.2%White alone
- 58,3574.2%Two or more races
- 28,7172.1%Hispanic
- 21,5831.6%Black alone
- 16,1511.2%Asian alone
- 5,8730.4%Other race alone
- 5,2050.4%American Indian alone
- 2210.02%Native Hawaiian and Other
Pacific Islander alone

Income and house value in Carthage
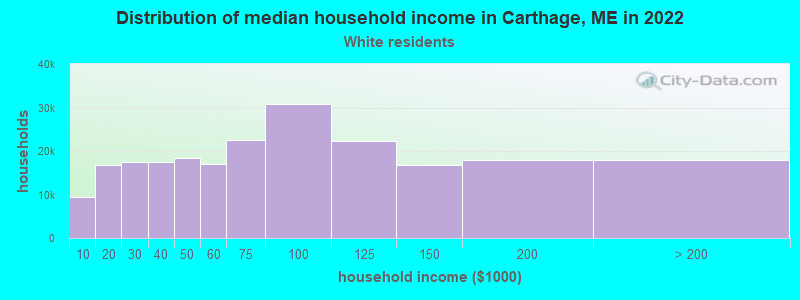
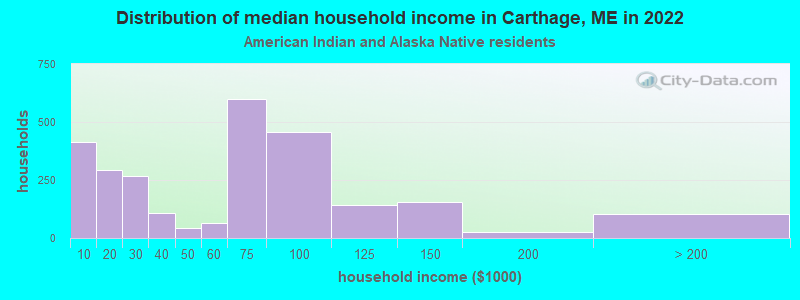
- Median household income in 2022
- $56,256White non-Hispanic householders
- $46,620American Indian and Alaska Native householders
- Median 2022 house value
- $183,407White Non-Hispanic householders
Household income for White non-Hispanic householders
Household income for American Indian and Alaska Native householders
Foreign-born residents in Carthage
3 residents are foreign born
| This city: | 0.6% |
| Maine: | 2.9% |
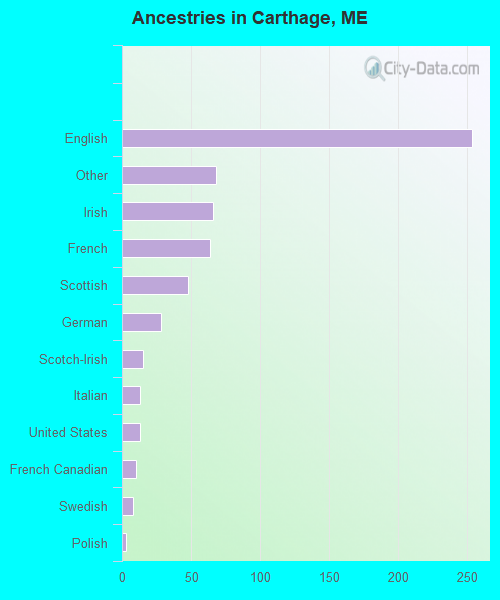
Ancestries in Carthage

- 25342.6%English
- 6811.4%Other
- 6611.1%Irish
- 6410.8%French
- 488.1%Scottish
- 284.7%German
- 152.5%Scotch-Irish
- 132.2%Italian
- 132.2%United States
- 101.7%French Canadian
- 81.3%Swedish
- 30.5%Polish
- 20.3%Danish
- 20.3%Dutch
- 10.2%Welsh
Zip codes: 04224.