Races in Castle Hill, Maine (ME) Detailed Stats
Ancestries, Foreign-born residents, place of birth
0.4% of Castle Hill, ME residents are foreign-born , which is 581.0% less than the foreign-born rate of 3.0% across the entire state of Maine.
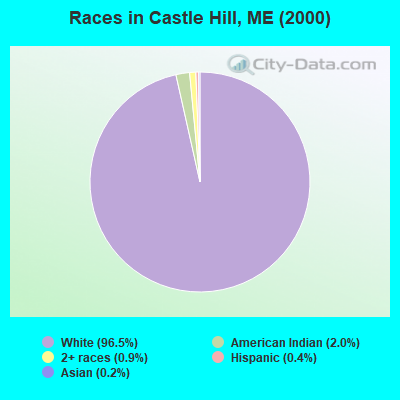
Race distribution in Castle Hill

- 43896.5%White alone
- 92.0%American Indian alone
- 40.9%Two or more races
- 20.4%Hispanic
- 10.2%Asian alone
2000
2022
-
- 1,230,29796.5%White alone
- 11,7310.9%Two or more races
- 9,3600.7%Hispanic
- 9,0140.7%Asian alone
- 6,4400.5%Black alone
- 6,9110.5%American Indian alone
- 8360.07%Other race alone
- 3340.03%Native Hawaiian and Other
Pacific Islander alone

-
- 1,249,23390.2%White alone
- 58,3574.2%Two or more races
- 28,7172.1%Hispanic
- 21,5831.6%Black alone
- 16,1511.2%Asian alone
- 5,8730.4%Other race alone
- 5,2050.4%American Indian alone
- 2210.02%Native Hawaiian and Other
Pacific Islander alone

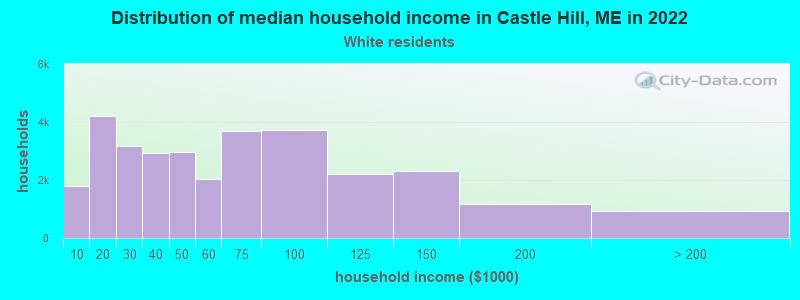
Income and house value in Castle Hill
- Median household income in 2022
- $56,480White non-Hispanic householders
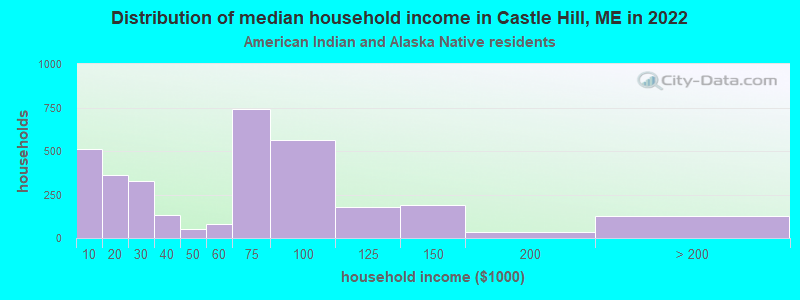
- $80,089American Indian and Alaska Native householders
- Median 2022 house value
- $111,376White Non-Hispanic householders
- $133,167American Indian or Alaska Native householders
Household income for White non-Hispanic householders
Household income for American Indian and Alaska Native householders
Foreign-born residents in Castle Hill
2 residents are foreign born
| This city: | 0.4% |
| Maine: | 2.9% |
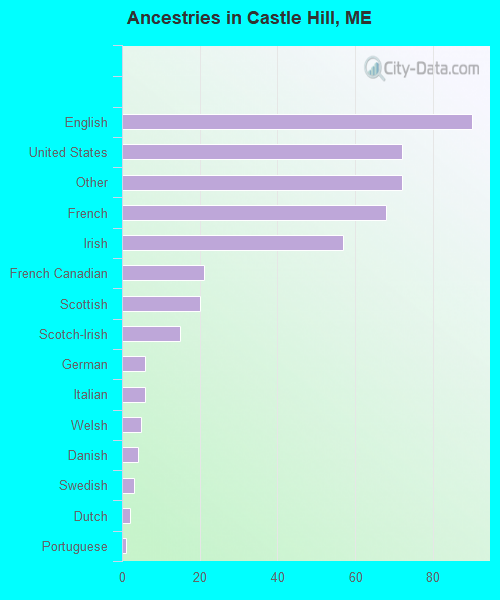
Ancestries in Castle Hill

- 9020.4%English
- 7216.3%United States
- 7216.3%Other
- 6815.4%French
- 5712.9%Irish
- 214.8%French Canadian
- 204.5%Scottish
- 153.4%Scotch-Irish
- 61.4%German
- 61.4%Italian
- 51.1%Welsh
- 40.9%Danish
- 30.7%Swedish
- 20.5%Dutch
- 10.2%Portuguese
Zip codes: 04757.