Races in Cedar Park, Texas (TX) Detailed Stats
Data:
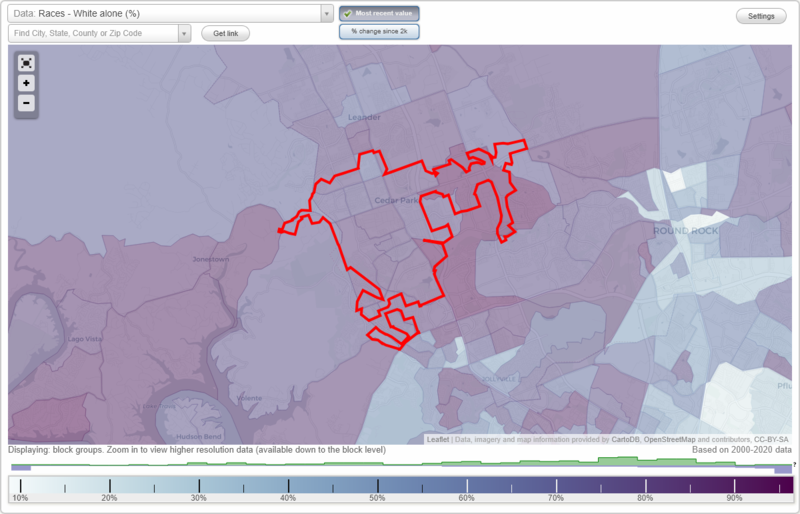
Races - White alone (%)
Races - White alone (% change since 2000)
Races - Black alone (%)
Races - Black alone (% change since 2000)
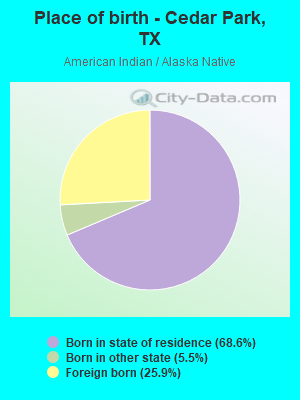
Races - American Indian alone (%)
Races - American Indian alone (% change since 2000)
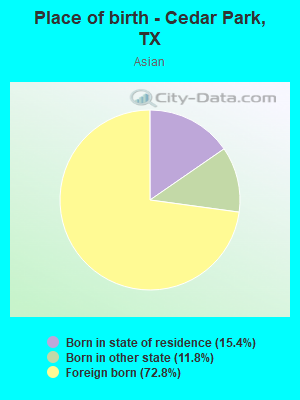
Races - Asian alone (%)
Races - Asian alone (% change since 2000)
Races - Hispanic (%)
Races - Hispanic (% change since 2000)
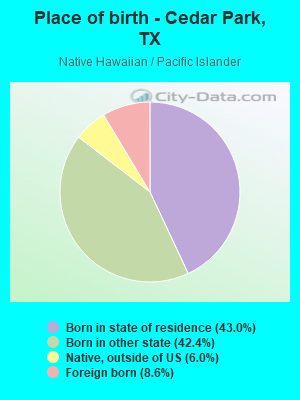
Races - Native Hawaiian and Other Pacific Islander alone (%)
Races - Native Hawaiian and Other Pacific Islander alone (% change since 2000)
Races - Two or more races(%)
Races - Two or more races(% change since 2000)
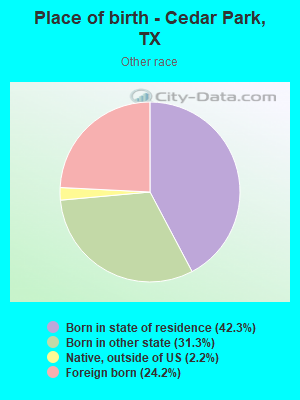
Races - Other race alone (%)
Races - Other race alone (% change since 2000)
Racial diversity
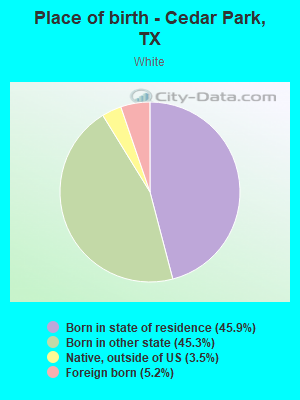
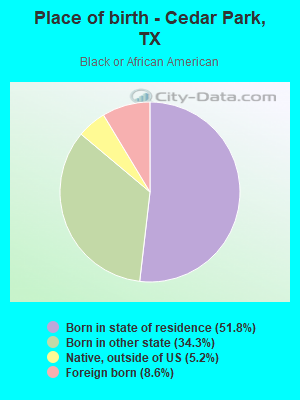
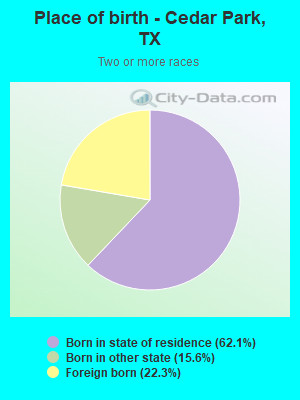
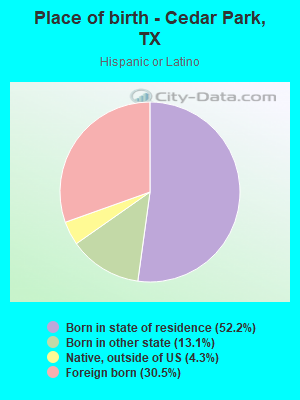
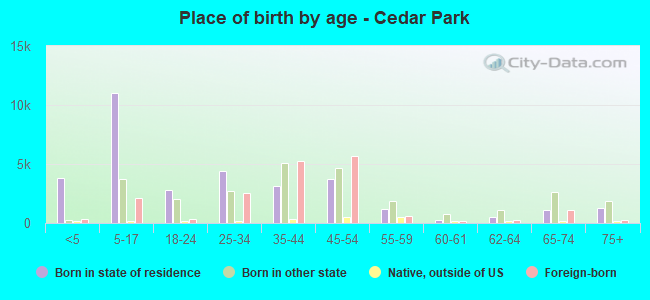
Place of birth - Born in state of residence (%)
Place of birth - Born in state of residence (%) - White
Place of birth - Born in state of residence (%) - Black or African American
Place of birth - Born in state of residence (%) - Asian
Place of birth - Born in state of residence (%) - Hispanic or Latino
Place of birth - Born in state of residence (%) - American Indian and Alaska Native
Place of birth - Born in state of residence (%) - Multirace
Place of birth - Born in state of residence (%) - Other Race
Place of birth - Born in other state (%)
Place of birth - Born in other state (%) - White
Place of birth - Born in other state (%) - Black or African American
Place of birth - Born in other state (%) - Asian
Place of birth - Born in other state (%) - Hispanic or Latino
Place of birth - Born in other state (%) - American Indian and Alaska Native
Place of birth - Born in other state (%) - Multirace
Place of birth - Born in other state (%) - Other Race
Place of birth - Native, outside of US (%)
Place of birth - Native, outside of US (%) - White
Place of birth - Native, outside of US (%) - Black or African American
Place of birth - Native, outside of US (%) - Asian
Place of birth - Native, outside of US (%) - Hispanic or Latino
Place of birth - Native, outside of US (%) - American Indian and Alaska Native
Place of birth - Native, outside of US (%) - Multirace
Place of birth - Native, outside of US (%) - Other Race
Place of birth - Foreign born (%)
Place of birth - Foreign born (%) - White
Place of birth - Foreign born (%) - Black or African American
Place of birth - Foreign born (%) - Asian
Place of birth - Foreign born (%) - Hispanic or Latino
Place of birth - Foreign born (%) - American Indian and Alaska Native
Place of birth - Foreign born (%) - Multirace
Place of birth - Foreign born (%) - Other Race
Residents speaking English at home (%)
Residents speaking English at home - Born in the United States (%)
Residents speaking English at home - Native, born elsewhere (%)
Residents speaking English at home - Foreign born (%)
Residents speaking Spanish at home (%)
Residents speaking Spanish at home - Born in the United States (%)
Residents speaking Spanish at home - Native, born elsewhere (%)
Residents speaking Spanish at home - Foreign born (%)
Residents speaking other language at home (%)
Residents speaking other language at home - Born in the United States (%)
Residents speaking other language at home - Native, born elsewhere (%)
Residents speaking other language at home - Foreign born (%)
Marital status - Never married (%)
Marital status - Now married (%)
Marital status - Separated (%)
Marital status - Widowed (%)
Marital status - Divorced (%)
Ancestries Reported - Arab (%)
Ancestries Reported - Czech (%)
Ancestries Reported - Danish (%)
Ancestries Reported - Dutch (%)
Ancestries Reported - English (%)
Ancestries Reported - French (%)
Ancestries Reported - French Canadian (%)
Ancestries Reported - German (%)
Ancestries Reported - Greek (%)
Ancestries Reported - Hungarian (%)
Ancestries Reported - Irish (%)
Ancestries Reported - Italian (%)
Ancestries Reported - Lithuanian (%)
Ancestries Reported - Norwegian (%)
Ancestries Reported - Polish (%)
Ancestries Reported - Portuguese (%)
Ancestries Reported - Russian (%)
Ancestries Reported - Scotch-Irish (%)
Ancestries Reported - Scottish (%)
Ancestries Reported - Slovak (%)
Ancestries Reported - Subsaharan African (%)
Ancestries Reported - Swedish (%)
Ancestries Reported - Swiss (%)
Ancestries Reported - Ukrainian (%)
Ancestries Reported - United States (%)
Ancestries Reported - Welsh (%)
Ancestries Reported - West Indian (%)
Ancestries Reported - Other (%)
Geographical mobility - Same house 1 year ago (%)
Geographical mobility - Same house 1 year ago (%) - White
Geographical mobility - Same house 1 year ago (%) - Black or African American
Geographical mobility - Same house 1 year ago (%) - Asian
Geographical mobility - Same house 1 year ago (%) - Hispanic or Latino
Geographical mobility - Same house 1 year ago (%) - American Indian and Alaska Native
Geographical mobility - Same house 1 year ago (%) - Multirace
Geographical mobility - Same house 1 year ago (%) - Other Race
Geographical mobility - Moved within same county (%)
Geographical mobility - Moved within same county (%) - White
Geographical mobility - Moved within same county (%) - Black or African American
Geographical mobility - Moved within same county (%) - Asian
Geographical mobility - Moved within same county (%) - Hispanic or Latino
Geographical mobility - Moved within same county (%) - American Indian and Alaska Native
Geographical mobility - Moved within same county (%) - Multirace
Geographical mobility - Moved within same county (%) - Other Race
Geographical mobility - Moved from different county within same state (%)
Geographical mobility - Moved from different county within same state (%) - White
Geographical mobility - Moved from different county within same state (%) - Black or African American
Geographical mobility - Moved from different county within same state (%) - Asian
Geographical mobility - Moved from different county within same state (%) - Hispanic or Latino
Geographical mobility - Moved from different county within same state (%) - American Indian and Alaska Native
Geographical mobility - Moved from different county within same state (%) - Multirace
Geographical mobility - Moved from different county within same state (%) - Other Race
Geographical mobility - Moved from different state (%)
Geographical mobility - Moved from different state (%) - White
Geographical mobility - Moved from different state (%) - Black or African American
Geographical mobility - Moved from different state (%) - Asian
Geographical mobility - Moved from different state (%) - Hispanic or Latino
Geographical mobility - Moved from different state (%) - American Indian and Alaska Native
Geographical mobility - Moved from different state (%) - Multirace
Geographical mobility - Moved from different state (%) - Other Race
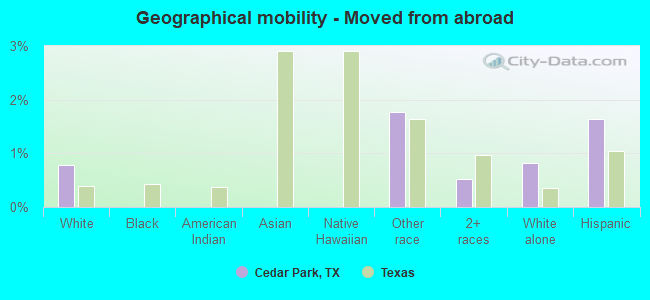
Geographical mobility - Moved from abroad (%)
Geographical mobility - Moved from abroad (%) - White
Geographical mobility - Moved from abroad (%) - Black or African American
Geographical mobility - Moved from abroad (%) - Asian
Geographical mobility - Moved from abroad (%) - Hispanic or Latino
Geographical mobility - Moved from abroad (%) - American Indian and Alaska Native
Geographical mobility - Moved from abroad (%) - Multirace
Geographical mobility - Moved from abroad (%) - Other Race
Place of birth for the foreign-born population - Ireland (%)
Place of birth for the foreign-born population - Denmark (%)
Place of birth for the foreign-born population - Norway (%)
Place of birth for the foreign-born population - Sweden (%)
Place of birth for the foreign-born population - United Kingdom (%)
Place of birth for the foreign-born population - England (%)
Place of birth for the foreign-born population - Scotland (%)
Place of birth for the foreign-born population - Other Northern Europe (%)
Place of birth for the foreign-born population - Austria (%)
Place of birth for the foreign-born population - Belgium (%)
Place of birth for the foreign-born population - France (%)
Place of birth for the foreign-born population - Germany (%)
Place of birth for the foreign-born population - Netherlands (%)
Place of birth for the foreign-born population - Switzerland (%)
Place of birth for the foreign-born population - Other Western Europe (%)
Place of birth for the foreign-born population - Greece (%)
Place of birth for the foreign-born population - Italy (%)
Place of birth for the foreign-born population - Portugal (%)
Place of birth for the foreign-born population - Spain (%)
Place of birth for the foreign-born population - Other Southern Europe (%)
Place of birth for the foreign-born population - Albania (%)
Place of birth for the foreign-born population - Belarus (%)
Place of birth for the foreign-born population - Bosnia and Herzegovina (%)
Place of birth for the foreign-born population - Bulgaria (%)
Place of birth for the foreign-born population - Croatia (%)
Place of birth for the foreign-born population - Czechoslovakia (%)
Place of birth for the foreign-born population - Hungary (%)
Place of birth for the foreign-born population - Latvia (%)
Place of birth for the foreign-born population - Lithuania (%)
Place of birth for the foreign-born population - North Macedonia (Macedonia) (%)
Place of birth for the foreign-born population - Moldova (%)
Place of birth for the foreign-born population - Poland (%)
Place of birth for the foreign-born population - Romania (%)
Place of birth for the foreign-born population - Russia (%)
Place of birth for the foreign-born population - Serbia (%)
Place of birth for the foreign-born population - Ukraine (%)
Place of birth for the foreign-born population - Other Eastern Europe (%)
Place of birth for the foreign-born population - China (%)
Place of birth for the foreign-born population - Hong Kong (%)
Place of birth for the foreign-born population - Taiwan (%)
Place of birth for the foreign-born population - Japan (%)
Place of birth for the foreign-born population - Korea (%)
Place of birth for the foreign-born population - Other Eastern Asia (%)
Place of birth for the foreign-born population - Afghanistan (%)
Place of birth for the foreign-born population - Bangladesh (%)
Place of birth for the foreign-born population - India (%)
Place of birth for the foreign-born population - Iran (%)
Place of birth for the foreign-born population - Kazakhstan (%)
Place of birth for the foreign-born population - Nepal (%)
Place of birth for the foreign-born population - Pakistan (%)
Place of birth for the foreign-born population - Sri Lanka (%)
Place of birth for the foreign-born population - Uzbekistan (%)
Place of birth for the foreign-born population - Other South Central Asia (%)
Place of birth for the foreign-born population - Burma (%)
Place of birth for the foreign-born population - Cambodia (%)
Place of birth for the foreign-born population - Indonesia (%)
Place of birth for the foreign-born population - Laos (%)
Place of birth for the foreign-born population - Malaysia (%)
Place of birth for the foreign-born population - Philippines (%)
Place of birth for the foreign-born population - Singapore (%)
Place of birth for the foreign-born population - Thailand (%)
Place of birth for the foreign-born population - Vietnam (%)
Place of birth for the foreign-born population - Other South Eastern Asia (%)
Place of birth for the foreign-born population - Armenia (%)
Place of birth for the foreign-born population - Iraq (%)
Place of birth for the foreign-born population - Israel (%)
Place of birth for the foreign-born population - Jordan (%)
Place of birth for the foreign-born population - Kuwait (%)
Place of birth for the foreign-born population - Lebanon (%)
Place of birth for the foreign-born population - Saudi Arabia (%)
Place of birth for the foreign-born population - Syria (%)
Place of birth for the foreign-born population - Turkey (%)
Place of birth for the foreign-born population - Yemen (%)
Place of birth for the foreign-born population - Other Western Asia (%)
Place of birth for the foreign-born population - Eritrea (%)
Place of birth for the foreign-born population - Ethiopia (%)
Place of birth for the foreign-born population - Kenya (%)
Place of birth for the foreign-born population - Somalia (%)
Place of birth for the foreign-born population - Uganda (%)
Place of birth for the foreign-born population - Zimbabwe (%)
Place of birth for the foreign-born population - Other Eastern Africa (%)
Place of birth for the foreign-born population - Cameroon (%)
Place of birth for the foreign-born population - Congo (%)
Place of birth for the foreign-born population - Democratic Republic of Congo (Zaire) (%)
Place of birth for the foreign-born population - Other Middle Africa (%)
Place of birth for the foreign-born population - Egypt (%)
Place of birth for the foreign-born population - Morocco (%)
Place of birth for the foreign-born population - Sudan (%)
Place of birth for the foreign-born population - Other Northern Africa (%)
Place of birth for the foreign-born population - South Africa (%)
Place of birth for the foreign-born population - Other Southern Africa (%)
Place of birth for the foreign-born population - Cabo Verde (%)
Place of birth for the foreign-born population - Ghana (%)
Place of birth for the foreign-born population - Liberia (%)
Place of birth for the foreign-born population - Nigeria (%)
Place of birth for the foreign-born population - Senegal (%)
Place of birth for the foreign-born population - Sierra Leone (%)
Place of birth for the foreign-born population - Other Western Africa (%)
Place of birth for the foreign-born population - Australia (%)
Place of birth for the foreign-born population - New Zealand (%)
Place of birth for the foreign-born population - Fiji (%)
Place of birth for the foreign-born population - Micronesia (%)
Place of birth for the foreign-born population - Bahamas (%)
Place of birth for the foreign-born population - Barbados (%)
Place of birth for the foreign-born population - Cuba (%)
Place of birth for the foreign-born population - Dominica (%)
Place of birth for the foreign-born population - Dominican Republic (%)
Place of birth for the foreign-born population - Grenada (%)
Place of birth for the foreign-born population - Haiti (%)
Place of birth for the foreign-born population - Jamaica (%)
Place of birth for the foreign-born population - St. Vincent and the Grenadines (%)
Place of birth for the foreign-born population - Trinidad and Tobago (%)
Place of birth for the foreign-born population - West Indies (%)
Place of birth for the foreign-born population - Other Caribbean (%)
Place of birth for the foreign-born population - Belize (%)
Place of birth for the foreign-born population - Costa Rica (%)
Place of birth for the foreign-born population - El Salvador (%)
Place of birth for the foreign-born population - Guatemala (%)
Place of birth for the foreign-born population - Honduras (%)
Place of birth for the foreign-born population - Mexico (%)
Place of birth for the foreign-born population - Nicaragua (%)
Place of birth for the foreign-born population - Panama (%)
Place of birth for the foreign-born population - Other Central America (%)
Place of birth for the foreign-born population - Argentina (%)
Place of birth for the foreign-born population - Bolivia (%)
Place of birth for the foreign-born population - Brazil (%)
Place of birth for the foreign-born population - Chile (%)
Place of birth for the foreign-born population - Colombia (%)
Place of birth for the foreign-born population - Ecuador (%)
Place of birth for the foreign-born population - Guyana (%)
Place of birth for the foreign-born population - Peru (%)
Place of birth for the foreign-born population - Uruguay (%)
Place of birth for the foreign-born population - Venezuela (%)
Place of birth for the foreign-born population - Other South America (%)
Place of birth for the foreign-born population - Canada (%)
Place of birth for the foreign-born population - Other Northern America (%)
Place of birth for the foreign-born population - Other (%)
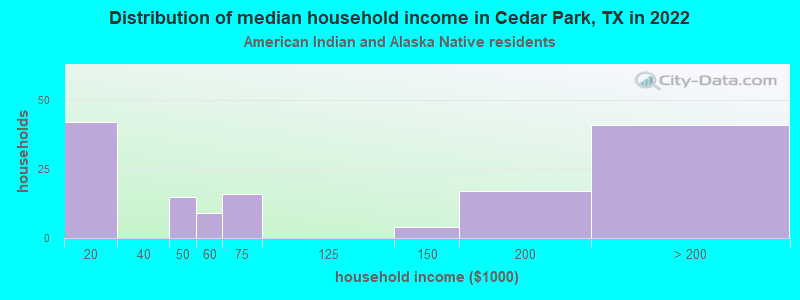
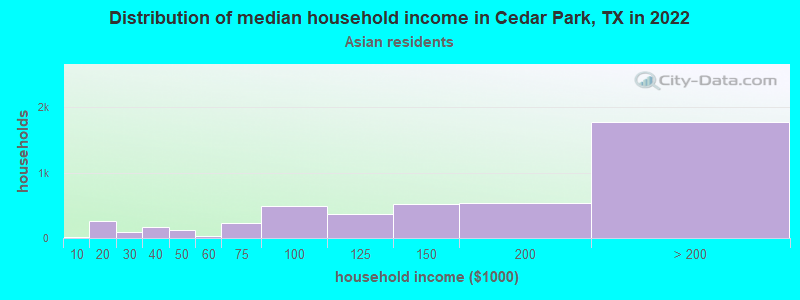
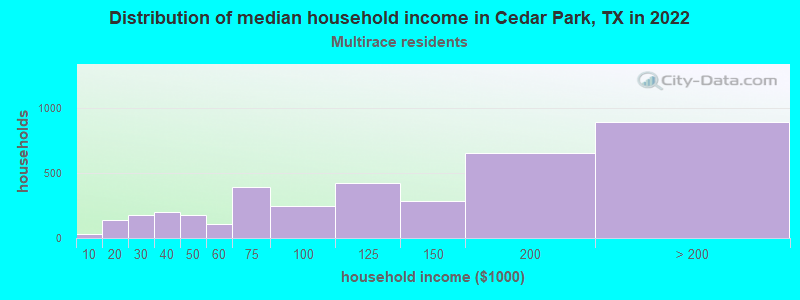
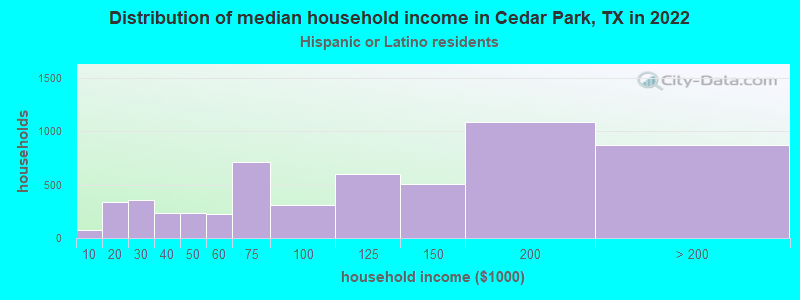
According to 2022 data, the most numerous races in Cedar Park, TX are Hispanic (11,767 residents), White alone (42,564 residents), and Black alone (2,171 residents). 68.4% of Cedar Park residents speak English at home. 16.1% of Cedar Park, TX residents are foreign-born (9.5% born in Asia, 4.8% born in Latin America), which is 5.7% less than the foreign-born rate of 17.0% across the entire state of Texas.
Race distribution in Cedar Park
2000 2022
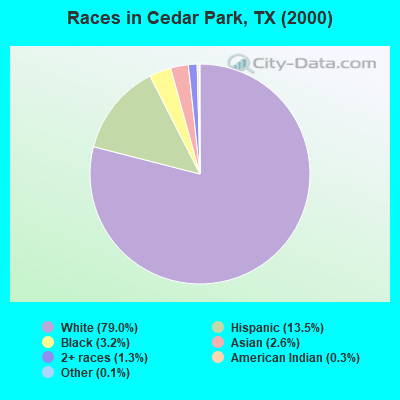
10,933,313 52.4% White alone 6,669,666 32.0% Hispanic 2,364,255 11.3% Black alone 554,445 2.7% Asian alone 230,567 1.1% Two or more races 68,859 0.3% American Indian alone 19,958 0.10% Other race alone 10,757 0.05% Native Hawaiian and Other
12,070,642 40.2% Hispanic 11,683,430 38.9% White alone 3,508,706 11.7% Black alone 1,608,173 5.4% Asian alone 956,560 3.2% Two or more races 125,763 0.4% Other race alone 47,023 0.2% American Indian alone 29,275 0.10% Native Hawaiian and Other
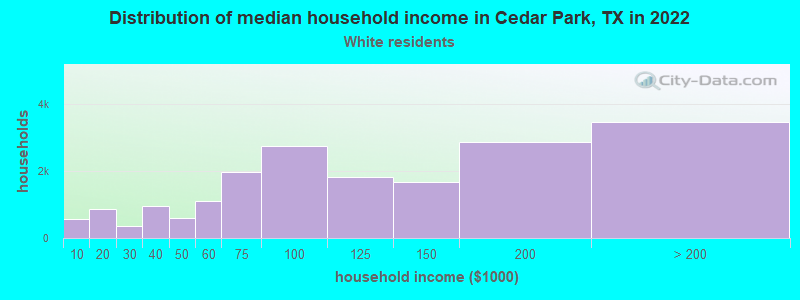
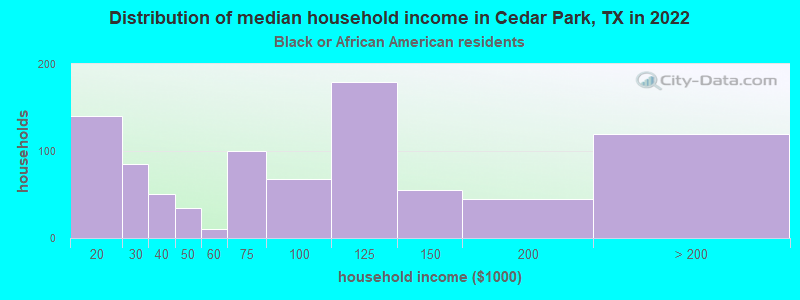
Income and house value in Cedar Park Median household income in 2022 $103,990 White non-Hispanic householders$95,237 Black householdersover $200,000 American Indian and Alaska Native householders$138,920 Asian householders$88,833 Some other race householders$134,294 Two or more races householders$89,849 Hispanic or Latino race householdersMedian 2022 house value $573,548 White Non-Hispanic householders$558,703 Black or African American householders$422,851 American Indian or Alaska Native householders $762,482 Asian householders$561,852 Some other race householders$534,412 Two or more races householders$578,496 Hispanic or Latino householders
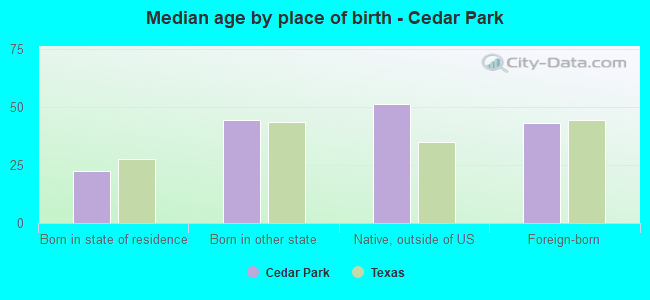
Median age by race in Cedar Park
41.3 Median age for White residents41.0 41.6 25.6 Median age for Black or African American residents26.2 25.5 50.5 Median age for American Indian / Alaska Native residents50.5 47.1 37.8 Median age for Asian residents39.2 35.6 35.7 Median age for Native Hawaiian / Pacific Islander residents-666,666,666.0 -666,666,666.0 37.4 Median age for Other race residents33.8 37.8 27.5 Median age for Two or more races residents25.9 27.9 41.8 Median age for White alone residents42.0 41.7 33.9 Median age for Hispanic or Latino residents33.0 37.6
Owner/renter occupied households by race in Cedar Park
House owners and renters - White residents 11,712 61.5% Owner occupied7,333 38.5% Renter occupiedHouse owners and renters - Black or African American residents 465 53.9% Owner occupied398 46.1% Renter occupiedHouse owners and renters - American Indian / Alaska Native residents 150 90.1% Owner occupied16 9.9% Renter occupiedHouse owners and renters - Asian residents 4,520 71.7% Owner occupied1,787 28.3% Renter occupiedHouse owners and renters - Native Hawaiian / Pacific Islander residents 12 13.5% Owner occupied79 86.5% Renter occupiedHouse owners and renters - Other race residents 586 42.9% Owner occupied781 57.1% Renter occupiedHouse owners and renters - Two or more races residents 2,166 76.0% Owner occupied685 24.0% Renter occupiedHouse owners and renters - White alone residents 11,098 62.5% Owner occupied6,671 37.5% Renter occupiedHouse owners and renters - Hispanic or Latino residents 1,936 51.0% Owner occupied1,858 49.0% Renter occupied
Language usage in Cedar Park
English speakers - Total 68.4% of residents of Cedar Park speak English at home.
9.8% of residents speak Spanish at home 6,504 87.1% Speak English very well960 12.9% Speak English less than very well21.7% of residents speak other language at home 12,050 73.2% Speak English very well4,406 26.8% Speak English less than very well
English speakers - Born in the United States 88.7% of residents of Cedar Park speak English at home.
4.7% of residents speak Spanish at home 1,200 96.1% Speak English very well49 3.9% Speak English less than very well6.6% of residents speak other language at home 1,539 88.6% Speak English very well199 11.4% Speak English less than very well
English speakers - Native, born elsewhere 58.1% of residents of Cedar Park speak English at home.
4.6% of residents speak Spanish at home 86 100.0% Speak English very well37.3% of residents speak other language at home 695 100.0% Speak English very well
English speakers - Foreign-born 9.7% of residents of Cedar Park speak English at home.
18.4% of residents speak Spanish at home 2,692 80.8% Speak English very well640 19.2% Speak English less than very well72.0% of residents speak other language at home 9,166 70.2% Speak English very well3,896 29.8% Speak English less than very well
White (Caucasian) - Speak only English Native:
93.4% (37,384)Foreign-born:
16.9% (400)
White (Caucasian) - Speak another language Native:
6.6% (2,628)Foreign-born:
83.1% (1,969)
Black or African American - Speak only English Native:
94.5% (2,322)Foreign-born:
32.8% (79)
Black or African American - Speak another language Native:
5.2% (128)Foreign-born:
67.3% (162)
American Indian / Alaska Native - Speak only English Native:
52.2% (163)Foreign-born:
37.0% (62)
American Indian / Alaska Native - Speak another language Native:
47.2% (148)Foreign-born:
67.7% (113)
Asian - Speak only English Native:
57.9% (2,340)Foreign-born:
8.7% (1,052)
Asian - Speak another language Native:
42.1% (1,698)Foreign-born:
91.3% (11,080)
Native Hawaiian / Pacific Islander - Speak another language Native:
96.2% (161)Foreign-born:
100.0% (19)
Other race - Speak only English Native:
50.4% (1,472)Foreign-born:
12.9% (120)
Other race - Speak another language Native:
49.6% (1,447)Foreign-born:
87.1% (812)
Two or more races - Speak only English Native:
82.5% (6,678)Foreign-born:
3.6% (88)
Two or more races - Speak another language Native:
17.5% (1,413)Foreign-born:
96.4% (2,382)
White alone - Speak only English Native:
94.8% (36,053)Foreign-born:
19.2% (400)
White alone - Speak another language Native:
5.2% (1,988)Foreign-born:
80.8% (1,686)
Hispanic or Latino - Speak only English Native:
57.7% (4,381)Foreign-born:
4.4% (157)
Hispanic or Latino - Speak another language Native:
42.3% (3,210)Foreign-born:
95.6% (3,427)
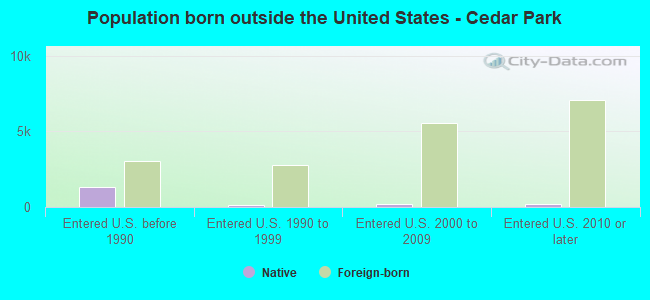
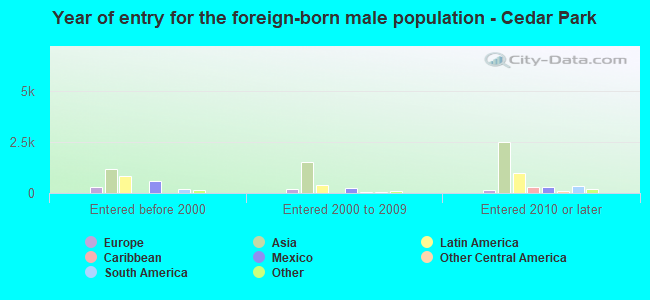
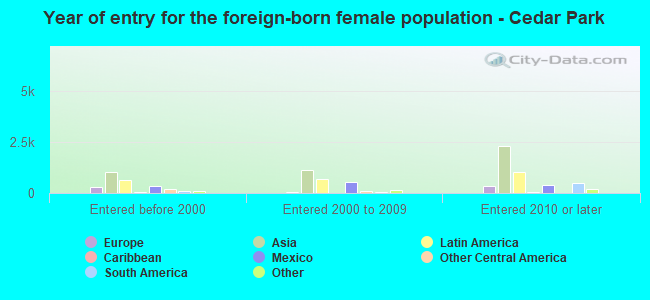
Foreign-born residents in Cedar Park 13,354 residents are foreign born (9.5% Asia , 4.8% Latin America ).
This city:
16.1%Texas:
17.1%
Marital status for residents in Cedar Park Marital status - White (Caucasian) population 15 years and over
Males 28.5% Never married63.9% Now married0.0% Separated1.9% Widowed5.7% DivorcedFemales 22.0% Never married51.4% Now married0.6% Separated11.6% Widowed14.4% DivorcedWomen who gave birth in the past 12 months Now married:
95.1% (1,070)Unmarried:
4.9% (55)
Women who did not give birth in the past 12 months Now married:
46.0% (4,305)Unmarried:
54.0% (5,046)
Marital status - Black or African American population 15 years and over
Males 46.7% Never married38.2% Now married0.0% Separated6.4% Widowed8.7% DivorcedFemales 54.2% Never married26.5% Now married0.0% Separated1.9% Widowed17.4% DivorcedWomen who did not give birth in the past 12 months Now married:
20.6% (198)Unmarried:
79.4% (762)
Marital status - American Indian / Alaska Native population 15 years and over
Males 26.2% Never married61.3% Now married0.0% Separated0.0% Widowed12.5% DivorcedFemales 37.4% Never married33.8% Now married6.1% Separated22.7% Widowed0.0% DivorcedWomen who did not give birth in the past 12 months Now married:
36.7% (52)Unmarried:
63.3% (89)
Marital status - Asian population 15 years and over
Males 16.0% Never married78.4% Now married0.3% Separated0.6% Widowed4.6% DivorcedFemales 21.2% Never married76.2% Now married0.3% Separated0.7% Widowed1.6% DivorcedWomen who gave birth in the past 12 months Now married:
100.0% (240)Unmarried:
0.0% (0)
Women who did not give birth in the past 12 months Now married:
74.9% (3,994)Unmarried:
25.1% (1,340)
Marital status - Native Hawaiian / Pacific Islander population 15 years and over
Males 0.0% Never married100.0% Now married0.0% Separated0.0% Widowed0.0% DivorcedFemales 41.6% Never married12.4% Now married10.2% Separated0.0% Widowed35.8% DivorcedWomen who did not give birth in the past 12 months Now married:
13.6% (11)Unmarried:
86.4% (69)
Marital status - Other race population 15 years and over
Males 36.3% Never married49.6% Now married4.0% Separated0.1% Widowed10.0% DivorcedFemales 36.8% Never married46.9% Now married1.9% Separated3.2% Widowed11.2% DivorcedWomen who did not give birth in the past 12 months Now married:
48.0% (578)Unmarried:
52.0% (626)
Marital status - Two or more races population 15 years and over
Males 45.5% Never married44.2% Now married1.3% Separated1.8% Widowed7.1% DivorcedFemales 27.6% Never married45.3% Now married1.8% Separated5.6% Widowed19.7% DivorcedWomen who gave birth in the past 12 months Now married:
84.9% (126)Unmarried:
15.1% (22)
Women who did not give birth in the past 12 months Now married:
39.2% (1,017)Unmarried:
60.8% (1,579)
Marital status - White alone, not Hispanic / Latino population 15 years and over
Males 28.6% Never married63.8% Now married0.0% Separated2.0% Widowed5.6% DivorcedFemales 22.3% Never married52.4% Now married0.7% Separated11.8% Widowed12.9% DivorcedWomen who gave birth in the past 12 months Now married:
95.1% (1,070)Unmarried:
4.9% (55)
Women who did not give birth in the past 12 months Now married:
47.5% (4,089)Unmarried:
52.5% (4,513)
Marital status - Hispanic or Latino population 15 years and over
Males 44.7% Never married42.4% Now married5.3% Separated0.2% Widowed7.4% DivorcedFemales 33.5% Never married47.8% Now married1.7% Separated5.4% Widowed11.5% DivorcedWomen who gave birth in the past 12 months Now married:
89.4% (132)Unmarried:
10.6% (16)
Women who did not give birth in the past 12 months Now married:
49.1% (2,303)Unmarried:
50.9% (2,387)
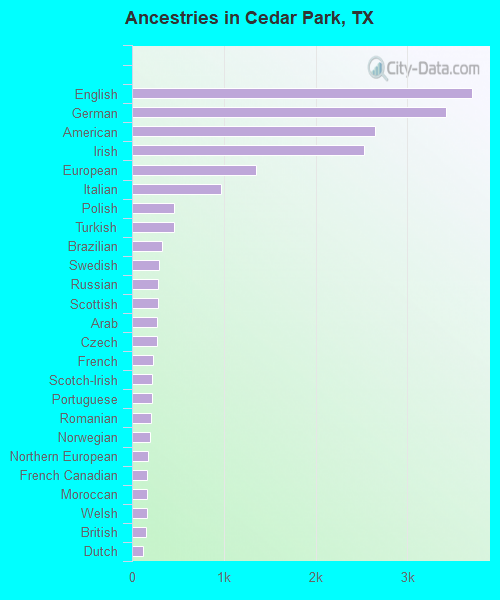
Ancestries in Cedar Park
3,705 9.4% English3,420 8.7% German2,653 6.7% American2,532 6.4% Irish1,355 3.4% European966 2.5% Italian459 1.2% Polish456 1.2% Turkish324 0.8% Brazilian291 0.7% Swedish284 0.7% Russian280 0.7% Scottish270 0.7% Arab269 0.7% Czech226 0.6% French217 0.6% Scotch-Irish214 0.5% Portuguese204 0.5% Romanian201 0.5% Norwegian176 0.4% Northern European167 0.4% French Canadian161 0.4% Moroccan160 0.4% Welsh153 0.4% British124 0.3% Dutch117 0.3% Ukrainian102 0.3% Greek86 0.2% Canadian62 0.2% Czechoslovakian52 0.1% Scandinavian49 0.1% Austrian45 0.1% Eastern European44 0.1% Australian38 0.10% Lebanese37 0.09% Albanian36 0.09% Senegalese34 0.09% Nigerian33 0.08% Iranian32 0.08% Danish32 0.08% Slovene32 0.08% Pennsylvania German19 0.05% Estonian19 0.05% Egyptian19 0.05% Slovak13 0.03% Hungarian12 0.03% British West Indian11 0.03% Slavic11 0.03% Swiss9 0.02% Israeli9 0.02% Icelander8 0.02% Ethiopian8 0.02% Trinidadian and Tobagonian7 0.02% Lithuanian
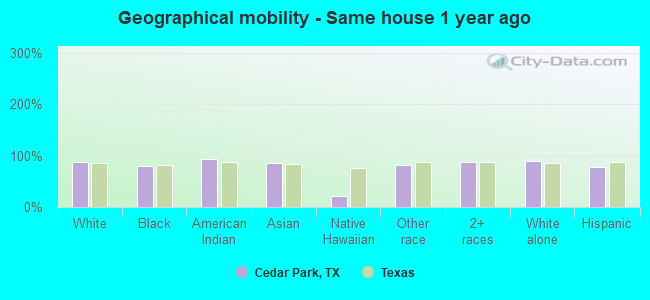
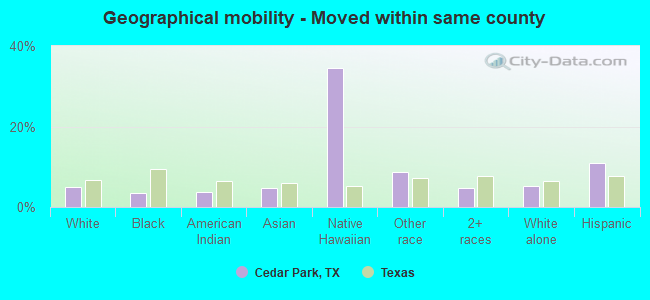
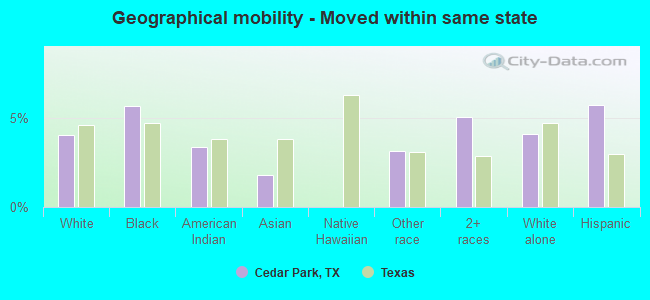
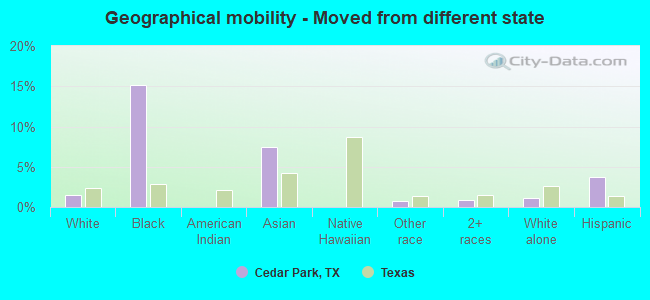
Geographical mobility in Cedar Park Same house 1 year ago 39,232 88.7% White (Caucasian)2,329 79.9% Black or African American467 93.9% American Indian / Alaska Native14,469 86.0% Asian43 21.7% Native Hawaiian / Pacific Islander3,406 81.4% Other race9,446 87.1% Two or more races36,985 88.8% White alone, not Hispanic / Latino9,164 77.9% Hispanic or LatinoMoved within same county 2,197 5.0% White / Caucasian104 3.6% Black or African American19 3.8% American Indian / Alaska Native796 4.7% Asian68 34.6% Native Hawaiian / Pacific Islander364 8.7% Other race506 4.7% Two or more races2,157 5.2% White alone, not Hispanic / Latino1,298 11.0% Hispanic or LatinoMoved within same state 1,781 4.0% White / Caucasian165 5.7% Black or African American17 3.3% American Indian / Alaska Native305 1.8% Asian130 3.1% Other race548 5.1% Two or more races1,696 4.1% White alone, not Hispanic / Latino672 5.7% Hispanic or LatinoMoved from different state 677 1.5% White / Caucasian442 15.1% Black or African American1,259 7.5% Asian29 0.7% Other race89 0.8% Two or more races474 1.1% White alone, not Hispanic / Latino440 3.7% Hispanic or LatinoMoved from abroad 345 0.8% White74 1.8% Other race56 0.5% Two or more races345 0.8% White alone, not Hispanic / Latino193 1.6% Hispanic or Latino
Children Nativity (place of birth) in Cedar Park
Children under 6 years - Living with two parents Both parents native 2,636 100.0% NativeBoth parents foreign-born 1,209 70.1% Native515 29.9% Foreign-bornOne native, one foreign-born parent 308 100.0% NativeChildren under 6 years - Living with one parent Native parent 493 100.0% NativeForeign-born parent 82 100.0% NativeChildren 6 to 17 years - Living with two parents Both parents native 6,762 98.6% Native98 1.4% Foreign-bornBoth parents foreign-born 3,000 64.5% Native1,649 35.5% Foreign-bornOne native, one foreign-born parent 888 100.0% NativeChildren 6 to 17 years - Living with one parent Native parent 1,820 100.0% NativeForeign-born parent 1,611 52.8% Native1,439 47.2% Foreign-born
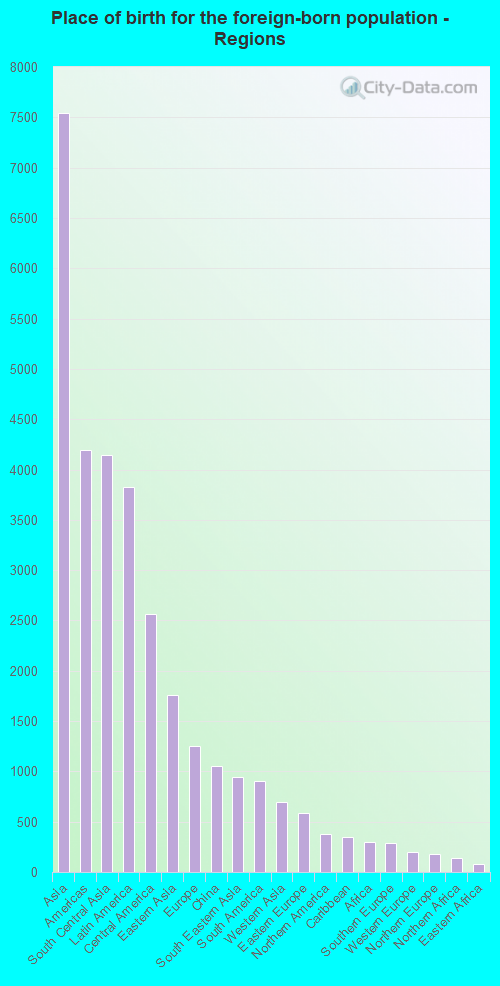
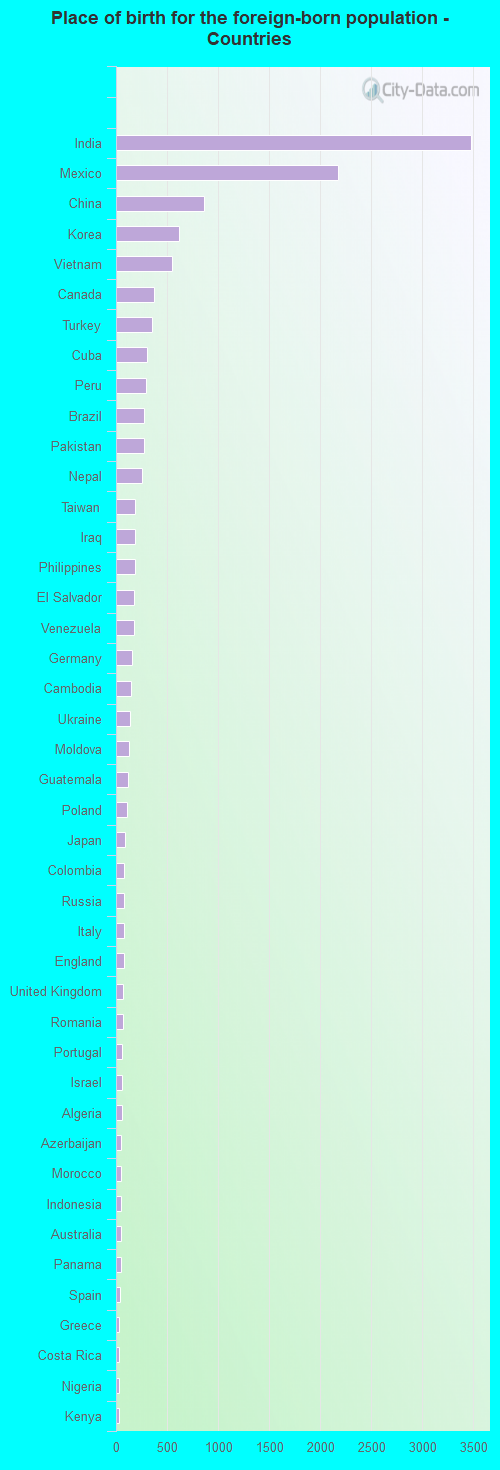
Place of birth for residents in Cedar Park 7,546 Asia4,197 Americas4,140 South Central Asia3,822 Latin America2,568 Central America1,761 Eastern Asia1,252 Europe1,052 China949 South Eastern Asia901 South America695 Western Asia583 Eastern Europe375 Northern America352 Caribbean294 Africa287 Southern Europe203 Western Europe179 Northern Europe137 Northern Africa77 Eastern Africa64 Western Africa63 Oceania46 Australia and New Zealand Subregion14 Southern Africa3,481 India2,173 Mexico858 China616 Korea546 Vietnam375 Canada349 Turkey304 Cuba295 Peru278 Brazil271 Pakistan251 Nepal188 Taiwan187 Iraq182 Philippines175 El Salvador173 Venezuela159 Germany143 Cambodia135 Ukraine123 Moldova113 Guatemala104 Poland92 Japan79 Colombia77 Russia76 Italy75 England72 United Kingdom72 Romania63 Portugal61 Israel55 Algeria50 Azerbaijan50 Morocco49 Indonesia46 Australia46 Panama43 Spain34 Greece34 Costa Rica33 Nigeria32 Kenya31 Senegal31 Egypt30 Sri Lanka29 France29 Tanzania27 Laos27 Iran26 Chile23 Dominica23 Guyana21 Belarus20 Ireland18 Bolivia16 Ethiopia15 Serbia14 Netherlands14 South Africa14 Lebanon13 St. Lucia13 Saudi Arabia13 Bangladesh12 Honduras12 Nicaragua11 Kazakhstan10 Trinidad and Tobago6 Hong Kong5 Argentina
Grandparents responsible for own grandchildren in Cedar Park
Grandparents (30 to 59 years) White / Caucasian 96 64.4% Responsible for grandchildren53 35.6% Not responsible for grandchildrenBlack or African American 5 13.5% Responsible for grandchildren35 86.5% Not responsible for grandchildrenAmerican Indian / Alaska Native 43 100.0% Responsible for grandchildrenAsian 6 100.0% Responsible for grandchildrenOther race 21 47.9% Responsible for grandchildren23 52.1% Not responsible for grandchildrenTwo or more races 34 100.0% Responsible for grandchildrenWhite alone, not Hispanic / Latino 135 78.2% Responsible for grandchildren38 21.8% Not responsible for grandchildrenHispanic or Latino 9 11.1% Responsible for grandchildren69 88.9% Not responsible for grandchildrenGrandparents (60 years and over) White / Caucasian 23 7.5% Responsible for grandchildren285 92.5% Not responsible for grandchildrenBlack or African American 6 100.0% Not responsible for grandchildrenAsian 120 100.0% Not responsible for grandchildrenTwo or more races 387 100.0% Not responsible for grandchildrenWhite alone, not Hispanic / Latino 15 8.2% Responsible for grandchildren165 91.8% Not responsible for grandchildrenHispanic or Latino 455 100.0% Not responsible for grandchildren